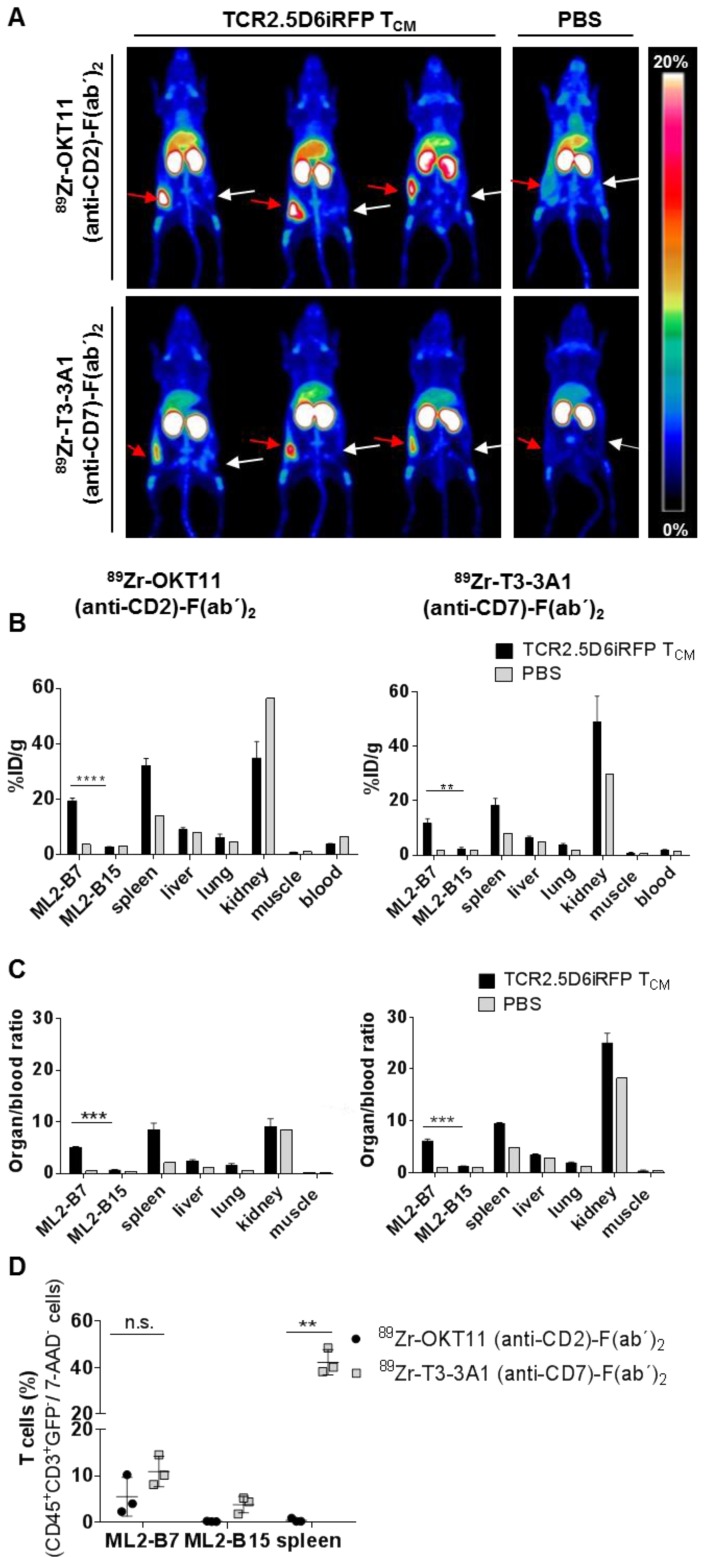
Figure 5.
In vivo imaging of T cells at the specific tumor site by immuno-PET using 89Zr-OKT11 (anti-CD2)-F(ab´)2 and 89Zr-T3-3A1 (anti-CD7)-F(ab´)2. (A) 3D-maximum intensity projection (MIP) pictures of PET/CT imaging of mice. Mice bearing ML2-B7 or ML2-B15 tumors that received TCR2.5D6iRFP TCM or PBS and 89Zr-labeled F(ab´)2 as indicated. Red arrows point at the ML2-B7 tumor site recognized by TCR2.5D6iRFP TCM and white arrows mark the ML2-B15 control tumor site. Animals injected with PBS served as negative controls. The scale bar shows 0-20% of percentage injected dose per gram (%ID/g). (B) Biodistribution analysis based on activity accumulation measurement by a gamma counter of the depicted organs for animals that received 89Zr-OKT11 (anti-CD2)-F(ab´)2 (left panel) or 89Zr-T3-3A1 (anti-CD7)-F(ab´)2 (right panel). %ID/g is depicted as mean ± SD for mice injected with TCR2.5D6iRFP TCM (n = 3 each) or PBS (n = 1 each) as control for various organs as indicated. Unpaired t-test: ** p < 0.01 and **** p < 0.0001. (C) Respective organ-to-blood ratio from %ID/g values shown as mean ± SD for 89Zr-OKT11 (anti-CD2)-F(ab´)2 (left panel) and 89Zr-T3-3A1 (anti-CD7)-F(ab´)2 (right panel). Unpaired t-test: *** p < 0.001. (D) Percentage of T cells detected by flow cytometry in tumors and spleen for animals injected with TCR2.5D6iRFP TCM and either 89Zr-OKT11 (anti-CD2)-F(ab´)2 or 89Zr-T3-3A1 (anti-CD7)-F(ab´)2. Unpaired t-test: ** p < 0.01.

