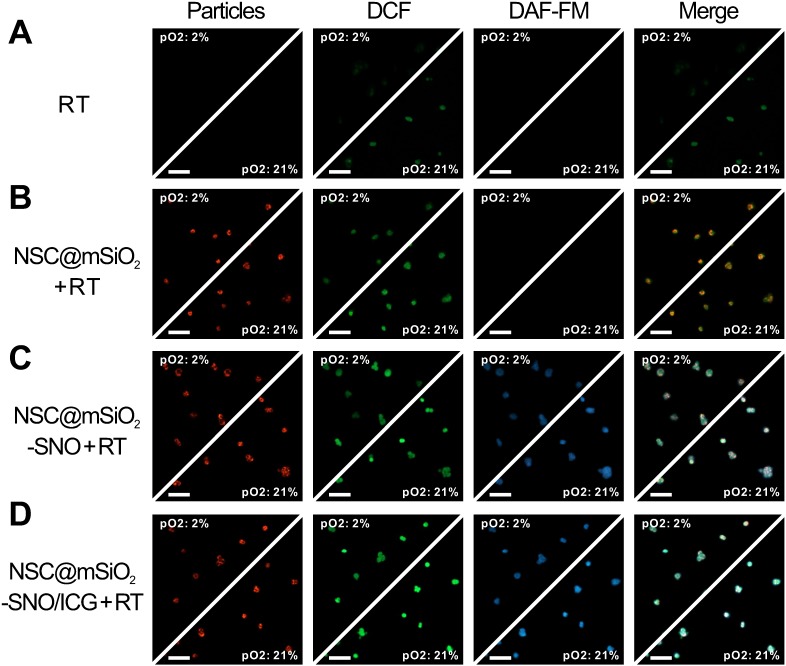
Figure 4.
CLSM fluorescence images of ROS and NO generation in 4T1 cells after normoxic (21% O2) and hypoxic (2% O2) incubation for different treatments including RT alone (A), NSC@mSiO2 + RT (B), NSC@mSiO2-SNO + RT (C), and NSC@mSiO2-SNO/ICG + RT (D). Green and blue luminescence indicated DAF-FM DA and DCFH-DA staining respectively for intracellular ROS and NO, while red luminescence was emitted from NSC cores upon UV excitation. Merge: NSC cores/DCF/DAF-FM. X-ray energy: 6 MeV. X-ray radiation dose: 4 Gy. NPs mass concentration: 50 μg mL-1. Scale bars, 100 μm.

