

Abstract
With the development of flexible electronics, the mechanical flexibility of functional materials is becoming one of the most important factors that needs to be considered in materials selection. Recently, flexible epitaxial nanoscale magnetic materials have attracted increasing attention for flexible spintronics. However, the knowledge of the bending coupled dynamic magnetic properties is poor when integrating the materials in flexible devices, which calls for further quantitative analysis. Herein, a series of epitaxial LiFe5O8 (LFO) nanostructures are produced as research models, whose dynamic magnetic properties are characterized by ferromagnetic resonance (FMR) measurements. LFO films with different crystalline orientations are discussed to determine the influence from magnetocrystalline anisotropy. Moreover, LFO nanopillar arrays are grown on flexible substrates to reveal the contribution from the nanoscale morphology. It reveals that the bending tunability of the FMR spectra highly depends on the demagnetization field energy of the sample, which is decided by the magnetism and the shape factor in the nanostructure. Following this result, LFO film with high bending tunability of microwave magnetic properties, and LFO nanopillar arrays with stable properties under bending are obtained. This work shows guiding significances for the design of future flexible tunable/stable microwave magnetic devices.
Keywords: epitaxial oxide thin films, ferromagnetic resonance, flexible devices, magnetism
Over the past decades, the progress in the development of flexible functional materials has promoted the application of traditional electronics in a wide range, such as flexible transparent display,1, 2, 3 wearable memory devices,4, 5, 6 multifunctional sensors,7, 8, 9, 10 and etc. To meet the practical application requirements of flexible devices, besides the physical characteristics, the mechanical flexibility of functional materials gradually plays an important role in the materials selection.11 For example, the change of resistance during repeated bending cycles is one of the most important benchmarks for the flexibility of soft electrodes. For flexible spintronics based applications, magnetic materials with high spin polarization as well as excellent mechanical flexibility are highly desirable to meet the requirement of high performance and stability.12, 13, 14, 15, 16 In the previous studies, bending‐deformation‐related magnetic hysteresis (M‐H) loops have been found in several flexible epitaxial oxide thin films with high crystalline quality, such as CoFe2O4,17, 18 CuFe2O4,19 LiFe5O8,20 Fe3O4,21 etc. The results indicate that the effects of bending‐induced mechanical strains on the magnetic properties are different for different materials. To meet the future demands in precise control and design of flexible spintronic systems,19, 21 it is of significant importance to establish the relationships between magnetic properties and complex mechanical motions. However, the knowledge of the bending coupled dynamic magnetic properties is still poor when integrating materials in flexible devices. Specifically, magnetocrystalline anisotropy, demagnetization field, and magnetostriction are often considered to play the key role in the coupling between bending and dynamic magnetism, but there is still lack of quantitative analysis for the specific contribution from the three factors.22, 23, 24
As one of the experimental techniques with high sensitivity, ferromagnetic resonance (FMR) is an effective tool for studying static and dynamic characteristics of magnetic thin films.25, 26 It can be employed to correlate the magnetic anisotropy (MA) to the structure of the sample. According to the report by Liu et al., bending deformation could effectively modulate the out‐of‐plane (OOP) FMR resonance field (H r) in the (111)‐oriented CuFe2O4 thin films on flexible fluorophlogopite mica (F‐Mica) substrate, which provides opportunities for wearable mechanics‐magnetic sensors and flexible microwave signal processing devices.19 Nevertheless, the complex in‐plane (IP) multidomain structure on F‐Mica substrate and strain‐sensitive magnetic properties of CuFe2O4 make it difficult to distinguish the contribution of the demagnetization field from that of the magnetocrystalline anisotropy. In addition, nanoscale materials with stable microwave dynamic magnetic properties under bending are highly required in the application of the next‐generation flexible spintronic devices.16, 27 For these requirements, a model sample with simple crystal structure is expected to allow further establishing the precious relationship between bending deformation and the tested FMR signals. Among various microwave ferrites, LiFe5O8 (LFO) is one of the promising candidates owing to its low loss at high microwave frequencies coupled with excellent magnetic properties.28, 29 In addition, LFO films have been reported to besuccessfully transferred onto flexible substrates by the wet etching and transfer methods.16 Relative stable M‐H loops under bending were reported for the transferred LFO films, which was explained by the relatively low magnetostrictive coefficient.20 Hence, it is expected that the flexible LFO films are reproducible with different OOP crystal orientations to investigate the origin of the bending tuned microwave magnetism in flexible magnetic thin films. Besides, the influence from the demagnetization field can be discussed by tuning the nanostructure of the LFO film, since it was reported that nanostructure could effectively modulate the demagnetization factor of materials.30, 31 In the former work, (111)‐oriented CoFe2O4 nanopillar arrays have been successfully grown on flexible fluorophlogopite substrates by the physical deposition and wet etching process, which can be further extended to form the LFO nanostructures.22
In this work, epitaxial LFO thin films (≈150 nm) with (001), (110), (111) OOP orientations have been successfully transferred on flexible polydimethylsiloxane (PDMS) substrates (see Experimental Section and Figure S1, Supporting Information), as shown in the inset of Figure 1 a–c. In addition, (111)‐oriented LFO nanopillar arrays were fabricated on flexible F‐Mica substrates. Angular‐dependent FMR measurements were conducted for all samples under released or bending states. Interestingly, it was shown that the variation of the main resonance field for the LFO samples under bending highly depends on the MA property of the samples under nonbending. In other words, the shape deformation induced easy axis deviation from its initial position is mainly responsible for the bending modulated FMR spectra in the flexible LFO samples, which can be roughly predicted by analyzing the MA energy of the sample with unbent state. This work provides a fundamental basis for the design of future FMR bending sensors or bending tunable/stable spintronic devices.
Figure 1.

XRD θ–2θ scans of A‐LFO and T‐LFO films with a) (001), b) (110), and c) (111) OOP orientations, respectively. Inset of (a)–(c): corresponding photographs of the T‐LFO films. FMR spectra of d) T‐LFO (001), e) T‐LFO (110), and f) T‐LFO (111) along IP (θH = 0°) and OOP (θH = 90°) orientations. g) Experimental (scatter) and fitting curves (dash line) of angular θH‐dependent H r for T‐LFO films with different orientations. Upper left corner of (g): schematic illustration of FMR spectroscopy experimental set‐up for the film sample. h) M s of T‐LFO films with different OOP orientations. Inset of (h): a table listed the 4πM s value and the fitting parameters H eff, HK 1, and HK 2.
To explore the crystal structure evolution during the etching and transfer process, typical X‐ray diffraction (XRD) θ–2θ scans were performed on the transferred LFO (T‐LFO) thin films and the as‐grown LFO/La0.67Sr0.33MnO3 (LSMO) films on SrTiO3 (STO) substrates (A‐LFO) with different crystal orientations. As shown in Figure 1a–c, all of the LFO films show excellent single orientation without any detectable peaks of impurity phases. After the wet etching and transfer process, all of the peaks from the STO substrate and the LSMO buffer layer disappeared, only leaving the peaks from the transferred LFO phases. Compared with the as‐grown film, only tiny changes of interplanar spacing (<0.1%) along OOP directions is found in the T‐LFO films, which are in the range of the test error. The lattice spacing of LFO (004) plane, LFO (110) plane, and LFO (111) plane are 2.08, 5.89, and 4.81 Å, respectively, revealing that all of the transferred films are fully relaxed. ϕ scans were conducted to confirm the IP crystal structural relation of the LFO films, as shown in Figure S2 in the Supporting Information. The azimuthal scan of the LFO layers with both (001) and (110) OOP orientations shows the same symmetry with that of the STO substrate, revealing typical single‐domain feature with the rotation pole along [001] and [110] in cubic, respectively. For the films on STO (111) substrates, the LFO layers exhibit sixfold symmetry, indicating a multidomain structure. Although we have not obtained the ϕ scan result for T‐LFO (111) dueto the low signal‐to‐noise ratio (SNR), according to the results for T‐LFO (001) and T‐LFO (110) films, it could be concluded that this transfer method retains the crystal symmetry of the as‐grown film.
FMR measurements were conducted on the T‐LFO films. As shown in the upper left corner of Figure 1g, H represents the external magnetic field, which is set in the xz‐plane with an azimuthal angle θH. M is the effective magnetization. θM and ϕM represent the azimuthal angles of M in the xz‐plane and in the xy‐plane, respectively. In the experiment, angular θH‐dependent FMR signals were measured by rotating H in the xz‐plane. The bottom of Figure 1d–f shows the relationships between the crystallographic orientations of the LFO films and the x, y, and z axes. As there exists an asymmetry in the experimental FMR lines due to the dispersion components of the susceptibility of the microwave electromagnetic field, modified Dyson function is applied to fit the experimental FMR lines,32, 33 as shown in Figure 1d–f. From this fitting, the H r can be obtained with better accuracy. To understand the origin of the MA properties of the T‐LFO films with different crystallographic orientations, formula fitting method is applied based on the experimental results of the θH‐dependent H r. Considering the contributions of the crystal orientations and specimen shape, the free energy related to the magnetization of the films can be expressed as34
| (1) |
The first term is the Zeeman energy. The second one is the demagnetization field energy characterized by the saturation magnetization M s and the demagnetization factor N (N = N z = 1 for thin film). The third and fourth terms represent the OOP uniaxial anisotropy energy characterized by a constant K u and the magnetocrystalline anisotropy energies F MAE characterized by constants Ki (i = 1,2,3…), respectively. The last term is the magnetoelastic energy, which is discussed by the orthogonal normal stresses model35(see more details in the Supporting Information). In this study, the T‐LFO films are fully relaxed so that the F MAE can be ignored. Hence, based on the Smit–Beljers formalism,36 while neglecting the contribution from constant Ki (i > 2) and setting ϕM = ϕH = 0, the expression for the FMR frequency can be derived as
| (2) |
| (3) |
where ω is the microwave angular frequency, γ is the gyromagnetic factor (≈2.768 GHz kOe−1). H eff represents the effective field (H eff = 4πNM s‐2K u/M s) that highly relates to the demagnetization field energy. HK 1 and HK 2 are the anisotropy fields (HK 1 = K 1/M s, HK 2 = K 2/M s) that mainly depend on the magnetocrystalline anisotropy.37, 38, 39 A 1(θM), A 2(θM), B 1(θM), B 2(θM), C 1(θM), and C 2(θM) are decided by the film orientations, as shown in Table S1 in the Supporting Information. Figure 1h collects the M s measured at room temperature by vibrating sample magnetometer systems. The corresponding M‐H loops are shown in Figure S3 in the Supporting Information. According to the formulas, the H eff, HK 1, and HK 2 can be obtained by fitting simultaneously the Kittel's resonance equations with the experimental values of H r and ω/γ. In the inset of Figure 1h, the values of H eff, HK 1, and HK 2 are listed for the T‐LFO films, which are obtained by fitting the experimental data for the angular θH‐dependent H r with the formulas, as shown in Figure 1g. The formulas fit well with the experimental results of the T‐LFO (001), (110), and (111) films. It is clear that the contribution from H eff dominates the MA properties of the T‐LFO films with a relatively high M s. When M s is not large enough, the F MAE influenced by the reduced symmetry of domain boundaries, interfaces, and roughness should have important effects on H r.40 More discussions on the contribution of HK 1 and HK 2 to the MA of the LFO films are given in the Supporting Information, which play the dominant role only at a relatively low M s. According to the previous reports, the substrate orientations usually play an important role in the formation of interfacial antiphase boundaries in spinel ferrite.41 Although all of the films were grown with almost the same thicknesses (≈150 nm), the different amount of interfacial defects could act as magnetic “dead” layers with different thicknesses, thus leading to the lowest M s in T‐LFO (111) films.42 To further prove this, the T‐LFO (111)* film with poorer crystalline quality was fabricated by reducing the growth temperature from 650 to 550 °C, whose full width at half maximum (FWHM) of XRD rocking curve was boarder than that for T‐LFO (111), as shown in Figure S4 in the Supporting Information. (The growth condition was present in the Supporting Information.) The FMR spectra lines for the T‐LFO (111)* film were presented in Figure S5 in the Supporting Information. The nonzero noises at low scanning field come from the empty cavity, since FMR signals from the LFO (111)* samples are much weaker than the others. Although we failed to simulate the FMR line of LFO (111)* samples by the modified Dyson function due to the low SNR, the H r can be roughly evaluated by using the zero passage of the FMR lines, as shown in Figure 1g. The corresponding fitting lines of H r, fitting parameters and M s are also collected in Figure 1g,h. However, the fitting does not conduct very well, which called for the higher order of MA energy contributions for satisfied fitting. The T‐LFO (111)* film with poor crystalline quality showed lower MA in the FMR measurements, which further proved the main role that the M s (or H eff) plays on the MA properties in the LFO films.
Figure 2 a displays the schematic illustration of FMR spectroscopy experimental set‐up for the sample under bending. The θH‐dependent FMR spectra for the T‐LFO (001) film with unbent and bending states is shown in Figure 2b,c, respectively. As shown in the top left corner of Figure 2c, the bending axis is set along the y‐axis, which parallels to LFO [010] orientation in the whole bending film. The x‐axis and z‐axis are set along LFO [100] and [001] orientations of the central approximate nonbending unit cell, respectively. R represents the bending radius of the film, which is approximately the sum of the bending radius of the homemade bending mold and the thickness of the substrate. At a relatively small θH angle, the FMR spectra for the bent film retains the shape as the nearly uniform precession mode. When θH is higher than 40°, complex resonance modes gradually appeared, which are marked in Figure 2c. Figure 2d–g displays the contour plots of the θH‐dependent integrated FMR absorption spectra for the T‐LFO (001) films with different bending states. Apparently increasing half width can be found in the bending films accompanied by the complex modes, which indicates the increasing loss. Moreover, it can be seen that the center of the red part in Figure 2d–g decreases with increasing of 1/R, which relates to the main resonance absorption peak of the film. After 1000 bending cycles (Figure 2h, in which the interruptions result from the low plot step of θH in the graph), the FMR spectrum retains its shape, showing excellent bending fatigue.
Figure 2.

a) Schematic illustration of FMR spectroscopy experimental set‐up for the sample under bending. Angular θH‐dependent FMR spectra for T‐LFO (001) film with b) unbent and c) bending status. d–h) Counter plot of the θH‐dependent‐integrated FMR spectra for the T‐LFO (001) film with different bending states.
In order to explain the bending tuned FMR spectra of the LFO film, a simplified model is established. As shown in Figure 3 a, ∆φ represents the central angle of the bending film, and ∆φ = C/R, where C is the length of the film along the bending directions. For a specific sample, C is a constant. Then, R can be considered as ∆φ dependent only. If we divide a bending film into a great amount of parts defined by a small dφ, the film could be approximately regarded as the collection of various crystal domains with different orientations along the direction of applied H. In order to facilitate calculation, here dφ is set as 1°. The overall dimensions of the samples and the corresponding calculation of ∆φ are present in the Table S3 in the Supporting Information. Thus, the final FMR spectra of the bent film could be considered as the sum of the FMR signals for the divided pieces of the thin film with different angles between the OOP orientation and the applied H. In other word, the basis of this model is the misorientation effect induced by bending, which makes the plane of the divided pieces deviate from the initial position and changes the included angle between the plane of the divided pieces and the direction of applied H. Following this consideration, we simulate the FMR spectra of the bending films through the mathematical integral operations on the data for unbent film using the closest ∆φ values, as shown in Figure 3b. Similar trend of graphic shape with decreasing R s (R s present the bending radius in the simulation, 1/R s = ∆φ/C) has been found in the simulated bending data in Figure 3b, while the half width of the counter plot seems to be smaller than that for the experimental data in Figure 2e–g. Figure 3c displays the comparison of the experimental and the simulated result for a specific FMR spectra line obtained by the methods above. The simulated FMR lines show high similarity with the experimental FMR lines, especially for the position of the zero passages (Hz). Although more than one Hz value (Hz 0, Hz 1, Hz 2) could be found for the blue experimental FMR line in Figure 3c, there exists a set of very close Hz values (Hz 0 in Figure 3c, which is defined as Hz c) between the experimental and the simulated lines. Here, we argue that existence of Hz c should be attributed to the bending induced misorientation effect, which is also the main basis of the simulation. To further prove this, we list out all of Hz values for the experimental FMR lines through a simple program, while that for the simulated lines is obtained by catching the maximum of the FMR absorption lines. Figure 3d–f collects the Hz for the experimental and simulated FMR result. The Hz 0 (or Hz c), Hz 1, Hz 2 in Figure 3c is marked in Figure 3d. For each θH, a set of very close Hz values (Hz c) can always been found, which further proves the effect induced by the misorientation model. The Hz c for the experimental and simulated result is further listed in Figure 3g. It can be seen that the Hz c of the films shows an overall falling trend at relatively high θH values with increasing value of 1/R, which fits very well with the simulated curves. The simulated change of Hz c value (∆Hz c) for T‐LFO (001) films under bending at θH ranging from 0° to 90° is present in Figure S6 in the Supporting Information, according to which it could be possible to predict the bending state of the film by comparing the Hz c data. The differences between the experimental and simulated Hz c values are collected in Figure S7d in the Supporting Information. However, in comparison with the simulated data, the experimental FMR spectra show higher loss as well as complex modes in details, as shown in Figure S7a–c in the Supporting Information, where the experimental and simulated FMR lines under different conditions are compared. Here, we note that the break of symmetry and the effective field fluctuations associated with the MA of randomly oriented domains in the bending film may be considered as two effective factors for the complex modes of the experimental results.43, 44 As shown in Figure 3a, the bending deformation induces a rotation of neighbor unit cell. From the volume perspective, every spin along the bending edge will deviate from its initial equilibrium orientation to accommodate spin flip over the spin chain, which might lead to the excitation of two‐magnon scattering (TMS) in the bending films.43 According to the previous reports, TMS is an important type of spin wave, and plays an important role in the magnetic relaxation mechanism for the limit of gigahertz excitations, which corresponds to the high loss in the bending films.45, 46 The tensile strain should also be one of the factors responsible for the complex modes in the bending films, which is reported to favor excitation of the surface spin‐wave mode.47
Figure 3.
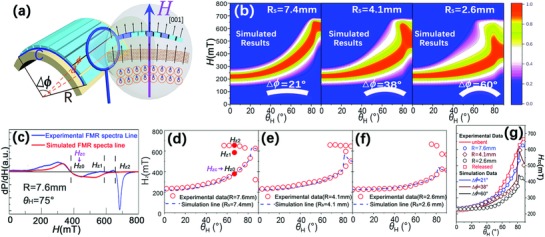
a) Diagram of the simple model for explaining the bending tuned FMR spectra of the LFO film. b) Counter plot of the simulated θH‐dependent‐integrated FMR spectra for the T‐LFO (001) film with different bending status. Here, R s = C/▵ϕ. c) Comparison of the experimental and simulated FMR spectra lines for T‐LFO films at θH = 75°, R = 7.6 mm. d–f) Experimental (scatter) and simulation curves (dash line) of angular θH‐dependent H z for T‐LFO (001) films under different bending states. g) Angular θH‐dependent Hz c for T‐LFO (001) films under different bending states.
It is revealed that the mathematic simulation based on the misorientation effect can roughly predict the bending tuned Hz c of flexible LFO films. Because that the unbent T‐LFO (001) displays apparent MA in the FMR measurements (Figure 1g), the misorientation effect further induces the bending tenable Hz c during the tests. In other words, we argue that the bending tenability of Hz c should highly depend on the MA property (or H eff values in Figure 1h) of the unbent LFO film. Figures S8 and Figure S9 in the Supporting Information show the experimental and simulated data of the bending tuned FMR spectra for T‐LFO (111), respectively, whose H eff is lower than that for T‐LFO (001). Figure S10 in the Supporting Information displays the result for the T‐LFO (111)* with the lowest H eff in the figure, whose SNR becomes too low to get precise simulated data. Compared with that for T‐LFO (001), the positions of the red parts of the integrated FMR spectra (the main FMR absorption peak) in Figure S8‐10 in the Supporting Information only change a little under bending, which proves the relationship between the MA property (or H eff values) of the unbent LFO film and the bending tuned magnetic properties.
Besides the contribution from the crystalline orientation, for nanoscale materials, it is reported that the MA of materials can be further modulated by tuning the size and space distribution of the nano unit.30, 48 Hence, we consider fabricating LFO nanopillar arrays (NP‐LFO) on flexible F‐Mica substrates. As shown in Figure 4 a,b, the NP‐LFO produced by chemical etching method shows excellent morphology (see Experimental Section in the Supporting Information).22 The crystalline structure of NP‐LFO is ensured by the XRD results in Figure S11 in the Supporting Information, which also shows the (111) OOP orientation and IP multi‐domain structure. Figure 4c displays the M‐H loops and FMR spectra along both IP and OOP orientations for NP‐LFO, which shows excellent soft ferrimagnetism with the highest M s among all LFO samples. The LFO film directly grown on the fluorophlogopite substrate (M‐LFO) with the same growth condition has also been measured for comparison. Modified Dyson function is applied to simulate the FMR spectra line and help find the H r. As shown in Figure 4d, a stable H r is found in the NP‐LFO sample, whereas in the M‐LFO, there exists an apparent MA. The fitting curves calculated by Equations (2) and (3) fit very well to the experimental data. According to the fitting parameters collected in the inset table of Figure 4d, very low H eff has been found in the NP‐LFO sample, which should be result from the low N (H eff = 4πNM s − K u/M s) in nanopillar structure.30 For nanoscale materials, N can be modulated by tuningthe size and space distribution of the nano unit.30, 48 Thus, according to the Equation (1), the decreasing of N (N < 1 for nanopillar/nanodot arrays, N = 1 for film) could effectively decrease the demagnetization field energy (4πNM s 2sin2θM), leading to the low maximum difference of H r (MDR) in NP‐LFO samples. Figure 4e–h shows the counter plots of the θH‐dependent‐integrated FMR spectra for the NP‐LFO (111) film with different bending states, which show nice stability under bending. It indicates that the low MA leads to the low tunability of Hz c. Further works are required to investigate the relationship between the bending tuned FMR spectra and the structure‐related demagnetization factor N. Besides, the different bending deformation mechanism of the nanopillar arrays should also contribute to the stability under bending.22
Figure 4.
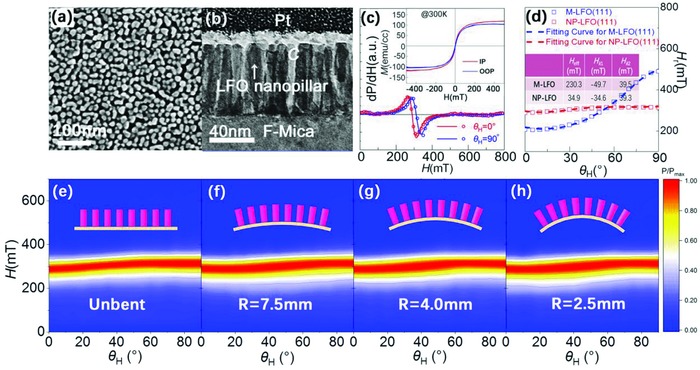
a) SEM image of the NP‐LFO (111) showing the surface morphology. b) The cross‐sectional TEM image showing the microstructure of the NP‐LFO (111). c) FMR spectra measured along IP and OOP orientations for the NP‐LFO (111). The scatter and the solid line are the experimental FMR data and the modified Dyson line, respectively. Inset of (c): corresponding M‐H loops of the NP‐LFO (111) measured at room temperature (300 K). d) Experimental (scatter) and fitting curves (dash line) of angular θH‐dependent H r for the NP‐LFO and the M‐LFO samples. Inset of (d) is a table, in which the fitting parameters H eff, HK 1, and HK 2 are listed. e–h) Counter plot of the θH‐dependent‐integrated FMR spectra for the NP‐LFO (111) film with different bending states.
Figure 5 a concludes the relationship among the 4πM s, the fitted H eff and MDR for all flexible LFO samples. It can be seen that the MDR increases with the increasing of H eff for all samples, which is highly related to the demagnetization field energy. According to the former discussions, the high MDR relates to high bending tunability, and thus promises the application in bending sensors or flexible tunable resonators and filters, etc.19 A representative example could be the T‐LFO (001) film, as shown in the red line of Figure 5b. Bending could effective change the Hz c due to the disorientation effect in the bending T‐LFO film. The low MDR means relatively stable FMR spectra under bending, which could be further applied in flexible spintronics that demand stable properties. In fact, according to our results, the MDR of the discussed T‐LFO films is not low enough to meet the requirement of stable bending properties. Besides, low SNR induced by the poor ferrimagnetism accompanied with low M s should also be avoided for future designs. Hence, NP‐LFO with low H eff (or demagnetization field energy) is prepared, which not only displays the lowest MDR among all samples in this work, but also retains a high M s to ensure the relatively high SNR. As shown in Figure 5b, the NP‐LFO (111) film nearly retains the values of Hz c under bending. From a practical point of view, nanopillar arrays is reported to have better bending flexible fatigue than films,49 which can be a good choice for flexible devices with stable properties under bending.
Figure 5.
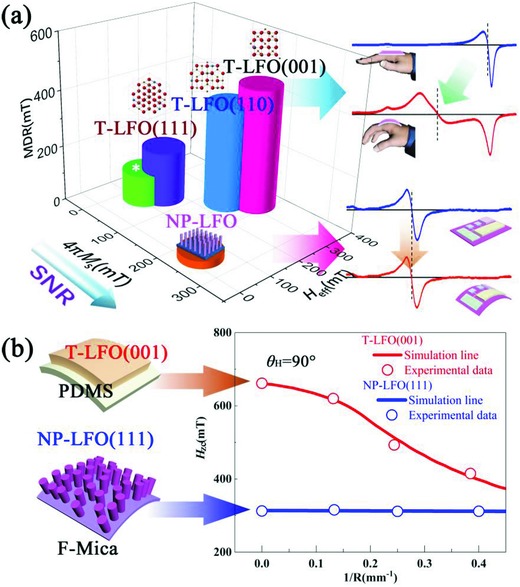
a) Diagram for the relationship among the 4πM s, H eff, MDR, and the promising application area of the LFO samples. b) The quantitative result of the bending radius R‐dependent H zc for T‐LFO (001) and NP‐LFO (111) at θH = 90°.
In summary, the relationship between the bending tunability of Hz c and the MA properties of flexible LFO samples with different structures has been investigated and concluded on the basis of the FMR spectra tests. It is revealed that the MA properties of the T‐LFO films mainly contribute from the different M s induced by the growth mechanism of LFO on substrates with different OOP orientations. The bending tunability of Hz c in the bending samples highly depends on the MA energy of the sample, and thus could be predicted by numerical simulations. With increasing MA energy, the Hz c of the LFO sample exhibits increasing tunability under bending, which shows the potential in the application of bending sensors or flexible tunable resonators and filters, etc. For the application of bending stable flexible devices that needs low MA energy, materials with high M s as well as low H eff (or demagnetization field energy) are required to ensure the high SNR. Thus, we obtain the NP‐LFO that holds the balance of low MA and high SNR. This work shows guiding significances for the design of future flexible tunable/stable microwave magnetic devices.
Conflict of Interest
The authors declare no conflict of interest.
Supporting information
Supplementary
Acknowledgements
L.S., L.G., L.L., M.L., and C.‐L.J. acknowledge the supports by National Science Foundation of China (No. 51390472) and National “973” projects of China (No. 2015CB654903). M.L. and C.M. acknowledge the supports by Fundamental Research Funds for the Central Universities and China Postdoctoral Science Foundation (No. 2015M582649). C.C. and C.J. acknowledge the support from the National Natural Science Foundation of China (No. 51671099). H.F. and C.Y. acknowledge the support by the National Science Foundation of China (No. 51371140 and No. 51771145). X.L. acknowledges the support by the National Science Foundation of China (No. 51572211). Y.Y. acknowledges the National Key R&D Program of China (No. 2017YFA0208000). L.C. acknowledges the Hong Kong, Macao and Taiwan Science and Technology Cooperation Program of China (No. 2015DFH10200) and the National Natural Science Foundation of China (No.11474146 and No. U1532142).
Shen L., Lan G., Lu L., Ma C., Cao C., Jiang C., Fu H., You C., Lu X., Yang Y., Chen L., Liu M., Jia C.‐L., Adv. Sci. 2018, 5, 1800855 10.1002/advs.201800855
References
- 1. Lee H. E., Kim S., Ko J., Yeom H.‐I., Byun C.‐W., Lee S. H., Joe D. J., Im T.‐H., Park S.‐H. K., Lee K. J., Adv. Funct. Mater. 2016, 26, 6170. [Google Scholar]
- 2. Choi M.‐C., Kim Y., Ha C.‐S., Prog. Polym. Sci. 2008, 33, 581. [Google Scholar]
- 3. Gelinck G. H., Huitema H. E. A., van Veenendaal E., Cantatore E., Schrijnemakers L., van der Putten J. B., Geuns T. C., Beenhakkers M., Giesbers J. B., Huisman B.‐H., Nat. Mater. 2004, 3, 106. [DOI] [PubMed] [Google Scholar]
- 4. Yu H., Chung C. C., Shewmon N., Ho S., Carpenter J. H., Larrabee R., Sun T. L., Jones J. L., Ade H., O'Connor B. T., So F., Adv. Funct. Mater. 2017, 27, 1700461. [Google Scholar]
- 5. Yang Y., Yuan G., Yan Z., Wang Y., Lu X., Liu J. M., Adv. Mater. 2017, 29, 1700425. [DOI] [PubMed] [Google Scholar]
- 6. Bakaul S. R., Serrao C. R., Lee O., Lu Z., Yadav A., Carraro C., Maboudian R., Ramesh R., Salahuddin S., Adv. Mater. 2017, 29, 1605699. [DOI] [PubMed] [Google Scholar]
- 7. Han S. T., Peng H., Sun Q., Venkatesh S., Chung K. S., Lau S. C., Zhou Y., Roy V. A. L., Adv. Mater. 2017, 29, 1700375. [DOI] [PubMed] [Google Scholar]
- 8. Wu W. W., Wang B., Segev‐Bar M., Dou W., Niu F., Horev Y. D., Deng Y. F., Plotkin M., Huynh T. P., Jeries R., Zhu H., Garaa A., Badarneh S., Chen L. F., Du M. L., Hu W. W., Haick H., Adv. Funct. Mater. 2017, 27, 1703147. [Google Scholar]
- 9. McAlpine M. C., Ahmad H., Wang D., Heath J. R., Nat. Mater. 2007, 6, 379. [DOI] [PMC free article] [PubMed] [Google Scholar]
- 10. Zang Y., Zhang F., Di C.‐a., Zhu D., Mater. Horiz. 2015, 2, 140. [Google Scholar]
- 11. Wang D., Zhang Y., Lu X., Ma Z., Xie C., Zheng Z., Chem. Soc. Rev. 2018, 47, 4611. [DOI] [PubMed] [Google Scholar]
- 12. Makarov D., Melzer M., Karnaushenko D., Schmidt O. G., Appl. Phys. Rev. 2016, 3, 011101. [Google Scholar]
- 13. Bedoya‐Pinto A., Donolato M., Gobbi M., Hueso L. E., Vavassori P., Appl. Phys. Lett. 2014, 104, 062412. [Google Scholar]
- 14. Li H., Zhan Q., Liu Y., Liu L., Yang H., Zuo Z., Shang T., Wang B., Li R. W., ACS Nano 2016, 10, 4403. [DOI] [PubMed] [Google Scholar]
- 15. Canon Bermudez G. S., Karnaushenko D. D., Karnaushenko D., Lebanov A., Bischoff L., Kaltenbrunner M., Fassbender J., Schmidt O. G., Makarov D., Sci. Adv. 2018, 4, eaao2623. [DOI] [PMC free article] [PubMed] [Google Scholar]
- 16. Gueye M., Wague B. M., Zighem F., Belmeguenai M., Gabor M. S., Petrisor T., Tiusan C., Mercone S., Faurie D., Appl. Phys. Lett. 2014, 105, 062409. [Google Scholar]
- 17. Zhang Y., Shen L., Liu M., Li X., Lu X., Lu L., Ma C., You C., Chen A., Huang C., Chen L., Alexe M., Jia C. L., ACS Nano 2017, 11, 8002. [DOI] [PubMed] [Google Scholar]
- 18. Liu H. J., Wang C. K., Su D., Amrillah T., Hsieh Y. H., Wu K. H., Chen Y. C., Juang J. Y., Eng L. M., Jen S. U., Chu Y. H., ACS Appl. Mater. Interfaces 2017, 9, 7297. [DOI] [PubMed] [Google Scholar]
- 19. Liu W. L., Liu M., Ma R., Zhang R. Y., Zhang W. Q., Yu D. P., Wang Q., Wang J. N., Wang H., Adv. Funct. Mater. 2018, 28, 1705928. [Google Scholar]
- 20. Shen L., Wu L., Sheng Q., Ma C., Zhang Y., Lu L., Ma J., Ma J., Bian J., Yang Y., Chen A., Lu X., Liu M., Wang H., Jia C. L., Adv. Mater. 2017, 29, 1702411. [DOI] [PubMed] [Google Scholar]
- 21. Wu P. C., Chen P. F., Do T. H., Hsieh Y. H., Ma C. H., Ha T. D., Wu K. H., Wang Y. J., Li H. B., Chen Y. C., Juang J. Y., Yu P., Eng L. M., Chang C. F., Chiu P. W., Tjeng L. H., Chu Y. H., ACS Appl. Mater. Interfaces 2016, 8, 33794. [DOI] [PubMed] [Google Scholar]
- 22. Shen L., Liu M., Ma C., Lu L., Fu H., You C., Lu X., Jia C.‐L., Mater. Horiz. 2018, 5, 230. [Google Scholar]
- 23. Gan Q., Rao R. A., Eom C. B., Garrett J. L., Lee M., Appl. Phys. Lett. 1998, 72, 978. [Google Scholar]
- 24. Bitla Y., Chu Y.‐H., FlatChem 2017, 3, 26. [Google Scholar]
- 25. Zhou C., Shen L. K., Liu M., Gao C. X., Jia C. L., Jiang C. J., Phys. Rev. Appl. 2018, 9, 014006. [Google Scholar]
- 26. Golosovsky M., Monod P., Muduli P. K., Budhani R. C., Phys. Rev. B 2007, 76, 184413. [Google Scholar]
- 27. Chumak A. V., Vasyuchka V. I., Serga A. A., Hillebrands B., Nat. Phys. 2015, 11, 453. [Google Scholar]
- 28. Pachauri N., Khodadadi B., Althammer M., Singh A. V., Loukya B., Datta R., Iliev M., Bezmaternykh L., Gudim I., Mewes T., Gupta A., J. Appl. Phys. 2015, 117, 233907. [Google Scholar]
- 29. Zhang R., Liu M., Lu L., Mi S.‐B., Wang H., CrystEngComm 2015, 17, 8256. [Google Scholar]
- 30. Noh S., Monma D., Miyake K., Doi M., Kaneko T., Imamura H., Sahashi M., IEEE Trans. Magn. 2011, 47, 2387. [Google Scholar]
- 31. Nowosielecka U., Pelka R., Moszyńska I., Guskos N., Typek J., Żołnierkiewicz G., J. Magn. Magn. Mater. 2017, 443, 324. [Google Scholar]
- 32. Popovych V., Bester M., Stefaniuk I., Kuzma M., Nukleonika 2015, 60, 385. [Google Scholar]
- 33. Joshi J. P., Bhat S. V., J. Magn. Reson. 2004, 168, 284. [DOI] [PubMed] [Google Scholar]
- 34. Lee S., Grudichak S., Sklenar J., Tsai C. C., Jang M., Yang Q., Zhang H., Ketterson J. B., J. Appl. Phys. 2016, 120, 033905. [Google Scholar]
- 35. Gueye M., Zighem F., Belmeguenai M., Gabor M., Tiusan C., Faurie D., J. Phys. D: Appl. Phys. 2016, 49, 265001. [Google Scholar]
- 36. Smit J., Beljers H. G., Philips Res. Rep. 1955, 10, 113. [Google Scholar]
- 37. Dyakonov V., Shapovalov V., Zubov E., Aleshkevych P., Klimov A., Varyukhin V., Pashchenko V., Kamenev V., Mikhailov V., Dyakonov K., Popov V., Lewandowski S. J., Berkowski M., Zuberek R., Szewczyk A., Szymczak H., J. Appl. Phys. 2003, 93, 2100. [Google Scholar]
- 38. Kohmoto O., J. Magn. Magn. Mater. 2003, 262, 280. [Google Scholar]
- 39. Kohmoto O., Jpn. J. Appl. Phys. 2003, 42, 7299. [Google Scholar]
- 40. Farle M., Rep. Prog. Phys. 1998, 61, 755. [Google Scholar]
- 41. Gatel C., Warot‐Fonrose B., Matzen S., Moussy J. B., Appl. Phys. Lett. 2013, 103, 092405. [Google Scholar]
- 42. Guo E. J., Charlton T., Ambaye H., Desautels R. D., Lee H. N., Fitzsimmons M. R., ACS Appl. Mater. Interfaces 2017, 9, 19307. [DOI] [PubMed] [Google Scholar]
- 43. Xue X., Zhou Z., Dong G., Feng M., Zhang Y., Zhao S., Hu Z., Ren W., Ye Z. G., Liu Y., Liu M., ACS Nano 2017, 11, 9286. [DOI] [PubMed] [Google Scholar]
- 44. Collet M., de Milly X., Kelly O. d. A., Naletov V. V., Bernard R., Bortolotti P., Ben Youssef J., Demidov V. E., Demokritov S. O., Prieto J. L., Munoz M., Cros V., Anane A., de Loubens G., Klein O., Nat. Commun. 2016, 7, 10377. [DOI] [PMC free article] [PubMed] [Google Scholar]
- 45. Azevedo A., Oliveira A. B., de Aguiar F. M., Rezende S. M., Phys. Rev. B 2000, 62, 5331. [Google Scholar]
- 46. Zakeri K., Lindner J., Barsukov I., Meckenstock R., Farle M., von Hoersten U., Wende H., Keune W., Rocker J., Kalarickal S. S., Lenz K., Kuch W., Baberschke K., Frait Z., Phys. Rev. B 2007, 76, 104416. [Google Scholar]
- 47. Shapovalov V., Dyakonov V., Aleshkevych P., Dyakonov K., Zhikharev I., Kuzminski M., Szymczak H., Phys. Status Solidi B 2007, 244, 347. [Google Scholar]
- 48. Salado J., Insausti M., Lezama L., de Muro I. G., Goikolea E., Rojo T., Chem. Mater. 2011, 23, 2879. [Google Scholar]
- 49. Merabtine S., Zighem F., Faurie D., Garcia‐Sanchez A., Lupo P., Adeyeye A. O., Nano Lett. 2018, 18, 3199. [DOI] [PubMed] [Google Scholar]
Associated Data
This section collects any data citations, data availability statements, or supplementary materials included in this article.
Supplementary Materials
Supplementary