Figure 5.

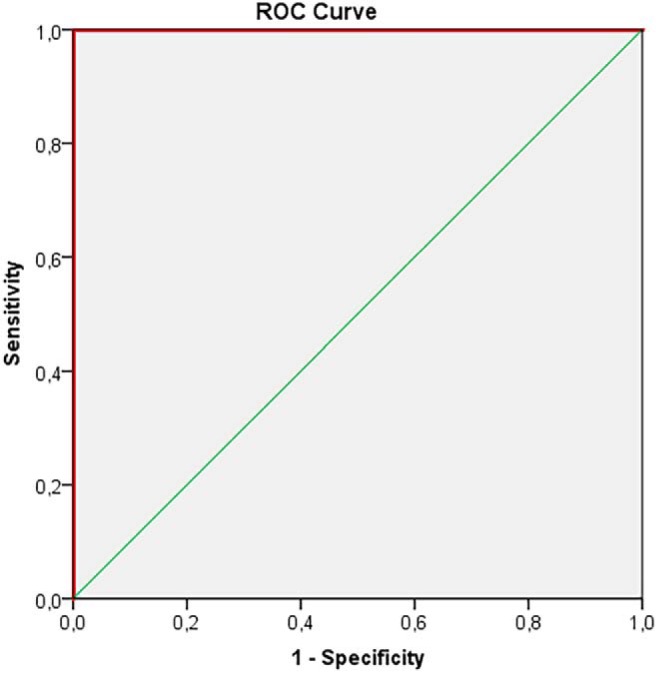
ROC-curve for MET and LGG in tumor tissue (nCE, CE) for tLip/tCho, Ins/tCho. AUC = 1.00; 95% CI 1.00–1.00; P-value < 0.001 (9 MET, 7 LGG).

ROC-curve for MET and LGG in tumor tissue (nCE, CE) for tLip/tCho, Ins/tCho. AUC = 1.00; 95% CI 1.00–1.00; P-value < 0.001 (9 MET, 7 LGG).