

Abstract
Dynamic glucose-enhanced (DGE) imaging uses chemical exchange saturation transfer magnetic resonance imaging to retrieve information about the microcirculation using infusion of a natural sugar (D-glucose). However, this new approach is not yet well understood with respect to the dynamic tissue response. DGE time curves for arteries, normal brain tissue, and cerebrospinal fluid (CSF) were analyzed in healthy volunteers and compared with the time dependence of sampled venous plasma blood glucose levels. The arterial response curves (arterial input function [AIF]) compared reasonably well in shape with the time curves of the sampled glucose levels but could also differ substantially. The brain tissue response curves showed mainly negative responses with a peak intensity that was of the order of 10 times smaller than the AIF peak and a shape that was susceptible to both noise and partial volume effects with CSF, attributed to the low contrast-to-noise ratio. The CSF response curves showed a rather large and steady increase of the glucose uptake during the scan, due to the rapid uptake of D-glucose in CSF. Importantly, and contrary to gadolinium studies, the curves differed substantially among volunteers, which was interpreted to be caused by variations in insulin response. In conclusion, while AIFs and tissue response curves can be measured in DGE experiments, partial volume effects, low concentration of D-glucose in tissue, and osmolality effects between tissue and blood may prohibit quantification of normal tissue perfusion parameters. However, separation of tumor responses from normal tissue responses would most likely be feasible.
Keywords: MRI, CEST, AIF, glucose, glucoCEST, perfusion, sugar
Introduction
Contrast agents are important for improving specificity and sensitivity in the visualization of anatomy and physiology that is not attainable with standard imaging. For instance, they can be used to assess perfusion parameters such as blood flow, blood volume, and transcapillary permeability. At present, all contrast agents for the 2 clinically most available methods, that is, computed tomography (CT) and magnetic resonance imaging (MRI), require chemical labeling. Annually, about 30 million patients worldwide are injected with iodinated CT agents (IMV Medical Information Division Inc. CT Census Market Summary Report, 2004) and another 8.5 million with gadolinium agents (MRI) (Joint Meeting of the Cardiovascular and Renal Drugs and Drug Safety and Risk Management Advisory Committee; Gadolinium-Based Contrast Agents & Nephrogenic Systemic Fibrosis. FDA Briefing Document, 2009). While gadolinium agents are overall considered safe, reports of adverse effects including nephrogenic systemic fibrosis (NSF) (1), gadolinium deposition in deep brain structures (2–4) and bones (5), and increased risk of stillbirth and neonatal death (6) are accumulating.
D-glucose is a regulatory-approved biocompatible substance. Oral glucose tolerance tests are already used clinically for the diagnosis of diabetes (7), and intravenous glucose tolerance testing is often used in clinical research settings to measure insulin sensitivity (8). Injection of small amounts of glucose will not change conventional MRI contrast. However, by using Chemical exchange saturation transfer (CEST) MRI (9, 10), an approach using radiofrequency (RF)-based labeling followed by label transfer (11), small (millimolar) amounts of glucose can be detected through the water signal with greatly enhanced sensitivity by using the glucose hydroxyl protons as a natural label that exchanges with water protons (12–17). This method is named glucoCEST (12–14, 18). In addition, the relaxation times T1ρ and T2 are also sensitive to proton exchange, and can be used to study the effect of glucose and its derivatives on image contrast (15, 18–22). By injecting the glucose while performing dynamic imaging (dynamic glucose-enhanced MRI [DGE MRI]) with glucoCEST, information about the microvasculature and tumor glucose uptake can be obtained (23, 24). These studies are being performed using both CEST (24) and spin-lock (19–22) approaches in animals and recently in humans (21). In this study, we applied the DGE MRI method using glucoCEST in healthy volunteers at 7 T to investigate the response curves from different tissues in the brain (arterial blood, normal brain tissue, CSF), and compared them with the time dependence of blood glucose levels measured using blood gas analysis of venous blood.
Methodology
Subjects and MR Imaging
The project was approved by the local ethics committee (The Regional Ethical Review Board in Lund and the Institutional Review Board at the Johns Hopkins University in Baltimore), and written informed consent was obtained from each volunteer. Seven healthy volunteers (4 males; age 24–50 years) were examined in Lund on an actively shielded 7 T MRI scanner (“Achieva”, Philips, Best, The Netherlands) equipped with a dual transmit head coil with a 32-channel phased-array receive coil (Nova Medical, Wilmington, MA). To exclude any pathology, morphologic images of each volunteer were examined by an experienced neuroradiologist (PS). To participate in the study, the volunteers had to be able to tolerate gadolinium (creatinine was tested for) as well as D-glucose (ie, diabetes mellitus, sickle cell disease, and blood iron deficiency were contraindicatory). A fasting blood glucose value between 3.9mM to 7.5mM (70 mg/dL to 135 mg/dL) was considered normal. Previously published data (24) from the Johns Hopkins University, Baltimore, were also included to increase the number of samples. That data consisted of 4 healthy volunteers (1 male; average age 28 years). A difference from the Lund data to the Baltimore data was that the normal fasting glucose value was limited to <7mM (126 mg/dL) at the Johns Hopkins University.
The RF-based saturation in the CEST sequence was achieved using an equidistant train of 32 sinc-gauss pulses with peak B1 = 1.96 μT, duration of 50 milliseconds, and separation of 25 milliseconds. Since acquisition of a full Z-spectrum is not needed using DGE-MRI due to the peak width of the glucose OH resonance, data were acquired at a single saturation offset of 1.2 ppm, where 3 of the hydroxyl protons of glucose resonate. Each saturation train was followed by a gradient-echo imaging module with repetition time = 5 milliseconds, echo time = 1.48 milliseconds, and a flip angle of 30°, to dynamically acquire a single transaxial slice with thickness of 6 mm, field of view of 224 × 224 mm2, and in-plane resolution of 3 × 3 mm2. Saturation images were acquired at a temporal resolution of 5.3 seconds. For 1 subject, a protocol with 90 dynamics was used (total scan time, 7 minutes and 57 seconds) was employed however, to get more information, the rest of the subjects were scanned using a protocol with 180 dynamics. Total scan time was 7 minutes and 57 seconds for the first protocol and 15 minutes and 54 seconds for the second protocol.
The images from the Johns Hopkins University were acquired in the same way as the experiments described in this study. However 1 volunteer was scanned using a protocol of 90 dynamics, 1 using a protocol of 70 dynamics, and the rest with at least 165 dynamics.
Normal D-glucose (50% dextrose, APL, clinical grade) was used as a contrast agent. Manual infusion started 3 minutes into the scan, and the infusion time ranged from 23 to 65 seconds. The total amount of glucose that was infused was 25 g in a 50-mL unit. Before the scan, a venous blood sample was drawn and the plasma glucose level was measured using a blood gas analyzer (i-Stat, Abbot Scandinavia AB, Sweden). Venous blood samples were also collected and analyzed for plasma glucose at 0.5, 1.0, 1.5, 2.0, 3.0, 5.0, 7.0, 10, 15, 20, 30, 45, 60 minutes after end of the infusion. The amount of blood that was drawn for each sample was ∼1–2 mL. After the scanning, the volunteers were asked to report their experiences during the infusion.
Postprocessing
The first 2 of the DGE images was discarded to assure a proper steady state. Baseline images with intensity Sbase were generated by averaging 3–27 of the preinfusion images. Glucose dynamic difference images were generated by taking the difference between Sbase and dynamic image intensity S(t), normalized to Sbase:
| (1) |
where S(ti) is the image intensity at time point i. One AIF was registered in each volunteer by selecting 2–3 voxels in the anterior cerebral artery (ACA) and then averaging the dynamic relative glucose difference curves for these voxels. The AIFs were temporally smoothed using a 4-point moving average.
Maps of the area under the curve (AUC) were calculated from the DGE images using the following equation:
| (2) |
The AUC over a 5-minute postinjection period was calculated. The start of the bolus was assigned as t = 0 (cf. Results) and the venous plasma glucose levels where subtracted with the baseline level.
The postprocessing was done in a similar fashion, with 2–3 voxels selected from the ACA. The limited number of voxels was selected to minimize partial volume effects as much as possible. ACA was used in all cases except 1, where no AIF could be found in the ACA and the AIF was instead selected in the insular artery.
In addition to analyzing the differences between the AIFs and the blood glucose levels, we also placed 2 regions of interest (ROIs) in the brain tissue of the volunteers. These ROIs were placed so that the outer cortical matter and ventricles were excluded. The ROI response (ie, relative signal difference) curves were then averaged to 1 curve. Furthermore, data from ROIs placed in the CSF in the ventricles (1 in each of the frontal horns of the lateral ventricle) were averaged for analysis of the DGE curve from CSF.
Results
Figure 1 shows the AIFs in comparison with the sampled increase in venous plasma glucose levels, for a period of −154 seconds to 302 seconds in 2 subjects, and to 604 seconds in the remainder of the subjects. Note that a positive glucoCEST intensity reflects an increased concentration of D-glucose in the voxel. There are clear differences between the AIFs in different volunteers, both in terms of maximum intensity and the decay rate of the glucoCEST intensity. The increase in glucoCEST effect in general is proportional to that in the measured increase in blood glucose level.
Figure 1.

Comparison of the arterial input function (AIFs) from dynamic glucose-enhanced (DGE) imaging (red) with the sampled venous plasma blood glucose levels (blue) for all volunteers from Baltimore (B1–B4) and Lund (L1–L7). The pink-shaded area shows the glucose infusion period. Notice the different vertical scales used to maximize the visualization of the shape.
In Figure 2, the AUC image from 1 volunteer is shown together with all the individual voxel AUC values plotted in a histogram. Note that CSF spaces can show either hypointensity (negative CEST effect) or hyperintensity, which will be further discussed below, while vessels always show hyperintensity (high CEST effect).
Figure 2.
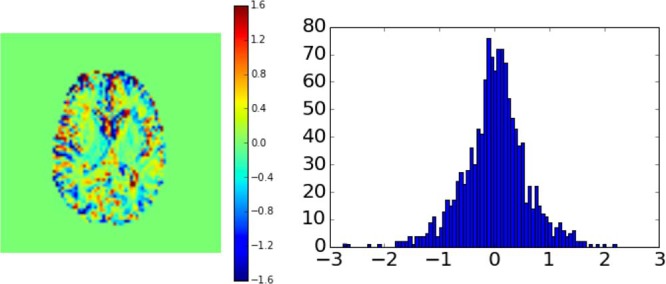
Area under the curve (AUC) image from 1 volunteer together with the values of the individual AUC voxels plotted in a histogram. The image is calculated using the first 5-minute images after start of injection. The color scale bar corresponds to relative signal difference in percent.
Figure 3 shows the tissue response curves from ROIs in the normal brain tissue for the volunteers. One can see an increase in the glucoCEST intensity when the glucose arrives in similar fashion to the AIF, but followed by a negative signal change in most cases.
Figure 3.

D-glucose response curves obtained from ROIs in healthy brain tissue from the volunteers from Baltimore (B1–B4) and Lund (L1–L7).
CSF response curves for the volunteers are shown in Figure 4. Interestingly, there was a fairly steady uptake of glucose throughout the response curve in 3 cases.
Figure 4.

D-glucose response curves obtained from ROIs in the ventricles from the volunteers from Baltimore (B1–B4) and Lund (L1–L7).
Figure 5 shows a scatter plot between the venous blood glucose and the AIFs for all individual exams (without zero baseline). When including the (0, 0) point, the correlation analysis showed r = 0.3.
Figure 5.

Scatter plot between the venous blood glucose and the AIFs for all individual exams. While the scatter is large, most likely because of partial volume effects, a small correlation of r = 0.3 is found.
The volunteers reported effects ranging from feeling warm, sugary taste in the mouth, transient heat flashes in head and crotch, to a feeling of the urge to urinate during the initial part of the glucose infusion. The effect was short-lived and was usually resolved within a few minutes. We noted that some of these side effects were stronger when the infusion was faster, and they were comparable to some adverse effects caused by some iodine-based contrast agents (25). We attribute some of these effects to the osmolarity of the glucose solution, which is approximately 10 times higher than the osmolarity of blood. When highly osmotic contrast agents are injected in the bloodstream a transport of water from the extravascular space to the intravascular space will occur in an effort to restore equilibrium in the osmotic pressure. This will lead to an increase in intravascular pressure.
Discussion
Arterial input functions are often required when tracer kinetic approaches are used to extract different perfusion-related parameters, such as cerebral blood volume, cerebral blood flow and transcapillary permeability. In T2*-weighted dynamic susceptibility contrast (DSC) MRI for perfusion imaging, the concentration–time curve is deconvolved with the AIF to obtain the tissue impulse response function (26), which can be used to calculate cerebral blood flow and mean transit time (MTT). In T1-weighted dynamic contrast-enhanced MRI (DCE-MRI) for perfusion and permeability imaging, one could, in principle, also deconvolve the concentration–time curve with the AIF (27), although this approach is not frequently applied due to low signal-to-noise ratio. Instead, compartment models such as the so-called Tofts or extended Tofts models are more common (28, 29). The extended Tofts model requires the use of the AIF to calculate the permeability-related parameter Ktrans, the extravascular extracellular volume and the plasma volume. As the tracer kinetics in DGE-MRI is different (delivery, uptake, and metabolism combined), it is important to be able to characterize the AIF in order to calculate perfusion- and/or permeability-related parameters using DGE-MRI. Another difference between DSC-MRI/DCE-MRI and DGE-MRI is that individual insulin responses will influence the shape of the DGE AIF. However, since every change in the AIF will be followed by a change in the uptake curve in the tissue the correct assessment of the AIF should not hamper calculation of the tracer kinetic parameters.
A first observation regarding the blood glucose curves in Figure 1 is that, contrary to typical gadolinium infusion experiments, all individuals showed very different temporal patterns of plasma glucose after the infusion, both in shape and magnitude. This variability of glycemic responses may be because of individual differences in insulin secretion from the pancreas and/or peripheral insulin sensitivity (30, 31), although this was not explicitly assessed in our study. After infusion, the glucose arrives in the brain tissue, where a small fraction is extracted and transported over the blood–brain barrier to the extravascular extracellular space (EES) and further to the glial and neuronal cells via active transport by the GLUT1 and GLUT3 transporters proteins (32). After entering the brain and crossing the EES, the D-glucose is taken up in the intracellular space, where it is rapidly phosphorylated and metabolized to pyruvate. The intracellular concentration of phosphorylated glucose is in the micromolar range (33), indicating that the signal in glucoCEST mainly originates from the EES (12), with some intravascular contribution. Most of the blood sugar is not taken up by the brain (the glucose extraction fraction, GEF, for normal brain is only about 10% (34)) and will instead recirculate in the rest of the body where it will be metabolized by all organs. The glucose uptake in peripheral tissues (eg, skeletal muscles), is facilitated by other transport proteins, such as GLUT4, which is insulin-dependent. GLUT4 is coupled to hexokinase II that facilitates the metabolism of glucose in peripheral tissues under insulin-stimulated conditions, such as during the postglucose infusion period (35). As plasma blood glucose levels rise, pancreatic insulin secretion is stimulated in response (36). The circulating insulin in the blood then facilitates insulin-mediated glucose uptake in peripheral tissues, therefore lowering the blood glucose level. For the short period of time over which the DGE response is studied, the brain metabolism most likely has only a minor influence on the blood glucose response curve as a whole, because the GEF is constant in healthy volunteers and would produce a similar shape and intensity. We therefore attribute the variations in early decay rate seen in the blood glucose drawn from the intravenous blood to the insulin response. A vigorous insulin response will lead to a quick drop in blood glucose level after the infusion peak, while a slower or more modest insulin response will manifest as a slowly decaying curve.
In addition to real differences likely based on insulin response, a major confounding factor that may influence the maximum intensity of the experimentally measured AIF is the occurrence of partial volume effects. Due to the limitation in spatial resolution (3 × 3 × 6 mm3), it is difficult if not impossible to obtain information from a voxel that contains only blood. Due to the low GEF, the sagittal sinus would be another choice for monitoring, but then as a venous output function. However, such a voxel may still not contain 100% blood, mainly due to the through plane resolution of 6 mm. Due to the partial volume effects, we have contributions from normal brain tissue and, especially in cortical and ventricular regions, CSF are included in the AIF sampling, and this can of course influence the shape and the amplitude of the AIF, similar to DSC-MRI (26). Also, in our current experimental protocol, we were limited to one slice covering healthy brain tissue thereby excluding a full coverage sagittal sinus.
The normal brain tissue response (Fig. 3) shows a trend with a small early rise and then a decay to a constant negative or close to zero level until the glucose level in blood has normalized. While the shape of this normal brain tissue response reflects somewhat the AIF shape, this normal brain tissue response was generally within the noise level. These curves have very low signal-to-noise ratio compared with, for example, DSC-MRI [where the signal drop is often of the order of 40% in healthy tissue (37)]. The negative effect in DGE may be because of tissue water loss due to the difference in osmolality of blood and combined with the small contrast-to-noise may make it problematic to determine perfusion parameters for normal tissue from DGE. This small effect in normal tissue is expected because of the ∼4–5 times lower glucose level in the brain tissue (38, 39) compared to blood. Fortunately, uptake in the EES of brain tumors with an affected blood–brain barrier should be much higher, which, contrary to fluorodeoxyglucose-positron emission tomography, enables stronger observation of DGE contrast between tumor and normal brain tissue.
Several response curves from CSF showed a fairly steady increase of glucose uptake, much higher than in tissue. This is in line with reports of rapid ventricular glucose uptake (40). Under normal conditions, the CSF/plasma glucose ratio is between 0.3 and 0.8 (mean 0.6) (41). This ratio can be higher under hyperglycemic conditions, as glucose can enter the CSF through the choroid plexus. This is a vascular tissue that connects the blood and the CSF (ie, the blood–CSF barrier) and allows facilitated transport of glucose into the CSF (42). Interestingly, the glucoCEST values in ROIs near and in CSF spaces can appear both as hyperintense and hypointense. One would expect glucoCEST hyperintensity in pure CSF, where the water saturation curve broadens. On the other hand, partial volume effects with tissue due to ventricular swelling as a consequence of glucose uptake (40) will cause hypointensity, because the much narrower CSF saturation spectrum is mixed with the tissue saturation spectrum (24). In addition, similar to brain tissue, vessel dilatations due to the injection of the glucose can also result in a signal change at the boundary between tissue, vessel, and CSF. To simplify interpretation in and near the CSF, a major improvement of the DGE technique would therefore be to remove the CSF signals using suppression techniques.
Another issue that might be relevant during the rather long glucoCEST scan is motion. Minor motion patterns were observed in a few of the subjects, but these effects might be much larger in patients, as they are frequently affected by, for example, agitation or pain. Brain or even just ventricular motion can also cause positive and negative effects due to different partial volume rations in ventricular border regions as described above for ventricular swelling. This physiological motion may cause positive false effects in the DGE images. Motion correction is often necessary in dynamic experiments, but the use of a single slice hampered motion correction methods for the current group of subjects. In the future, acquisition of more slices is thus warranted, not only for more complete coverage of the pathology but also to be able to do retrospective realignment of volumes.
As a final technical issue, it is important to realize that the blood water signal intensities measured in the current DGE approach depend on RF saturation effects induced in D-glucose and transferred to water over a period of 2.4 seconds. For the small Nova Medical head coil used, the saturation of blood water starts only when it enters at the bottom of the brain and may thus be incomplete, depending on which vessel is studied and on the time of coil entrance of the blood relative to the time of measurement. So, contrary to stationary tissue DGE signal, the arterial DGE signal in different vessels will likely have experienced an individual spin saturation history. The transit time from the carotids and basilar arteries to the ACA is about 1 second (43), so saturation is much less than for D-Glucose in CSF and tissue. This situation will improve at lower fields, using body coil RF irradiation.
In conclusion, we have demonstrated that we can measure both AIFs and tissue response curves in dynamic glucose-enhanced experiments. The interpretation of these curves is currently hampered by partial volume effects with CSF, the low concentration of D-glucose in tissue, and osmolality effects between blood and tissue. While this may prohibit assessment of normal tissue perfusion parameters, separation of tumor responses from normal tissue responses would most likely be feasible, especially when using AUC values.
Acknowledgments
This project was supported by Swedish Research Council grants no 2015-04170 and 2017-00995, Swedish Cancer Society grant no CAN 2015/251 and Swedish Brain Foundation grant no FO2017-0236 and NIH grants RO1EB019934, K99EB026312. Lund University Bioimaging Center (LBIC), Lund University, is gratefully acknowledged for providing experimental resources.
The authors are grateful to Boel Hansson and Johanna Arborelius for their assistance with the experiments and for helping out with the scanning and contrast agent injection.
Disclosures: Dr. Peter C.M. van Zijl is a paid lecturer for Philips Healthcare and has technology licensed to them. This arrangement has been approved by Johns Hopkins University in accordance with its conflict of interest policies.
Footnotes
- DGE
- Dynamic glucose-enhanced
- CSF
- cerebrospinal fluid
- AIF
- arterial input function
- CT
- computed tomography
- MRI
- magnetic resonance imaging
- CEST
- chemical exchange saturation transfer
- RF
- radiofrequency
- AUC
- area under the curve
- ROIs
- regions of interest
- DSC
- dynamic susceptibility contrast
- EES
- extravascular extracellular space
References
- 1. Thomsen HS, Morcos SK, Almén T, Bellin MF, Bertolotto M, Bongartz G, Clement O, Leander P, Heinz-Peer G, Reimer P, Stacul F, van der Molen A, Webb JA; ESUR Contrast Medium Safety Committee. Nephrogenic systemic fibrosis and gadolinium-based contrast media: updated ESUR Contrast Medium Safety Committee guidelines. Eur Radiol. 2013;23:307–318. [DOI] [PubMed] [Google Scholar]
- 2. McDonald RJ, McDonald JS, Kallmes DF, Jentoft ME, Paolini MA, Murray DL, Williamson EE, Eckel LJ. Gadolinium deposition in human brain tissues after contrast-enhanced MR imaging in adult patients without intracranial abnormalities. Radiology. 2017;285:546–554. [DOI] [PubMed] [Google Scholar]
- 3. Kanda T, Fukusato T, Matsuda M, Toyoda K, Oba H, Kotoku J, Haruyama T, Kitajima K, Furui S. Gadolinium-based contrast agent accumulates in the brain even in subjects without severe renal dysfunction: evaluation of autopsy brain specimens with inductively coupled plasma mass spectroscopy. Radiology. 2015;276:228–232. [DOI] [PubMed] [Google Scholar]
- 4. Gulani V, Calamante F, Shellock FG, Kanal E, Reeder SB; International Society for Magnetic Resonance in Medicine. Gadolinium deposition in the brain: summary of evidence and recommendations. Lancet Neurol. 2017;16:564–570. [DOI] [PubMed] [Google Scholar]
- 5. Lord ML, Chettle DR, Grafe JL, Noseworthy MD, McNeill FE. Observed deposition of gadolinium in bone using a new noninvasive in vivo biomedical device: results of a small pilot feasibility study. Radiology. 2018;287:96–103. [DOI] [PubMed] [Google Scholar]
- 6. Ray JG, Vermeulen MJ, Bharatha A, Montanera WJ, Park AL. Association between MRI exposure during pregnancy and fetal and childhood outcomes. JAMA. 2016;316:952–961. [DOI] [PubMed] [Google Scholar]
- 7. Alberti KG, Zimmet PZ. Definition, diagnosis and classification of diabetes mellitus and its complications. Part 1: diagnosis and classification of diabetes mellitus provisional report of a WHO consultation. Diabet Med. 1998;15:539–553. [DOI] [PubMed] [Google Scholar]
- 8. Kahn SE, Prigeon RL, McCulloch DK, Boyko EJ, Bergman RN, Schwartz MW, Neifing JL, Ward WK, Beard JC, Palmer JP. The contribution of insulin-dependent and insulin-independent glucose uptake to intravenous glucose tolerance in healthy human subjects. Diabetes. 1994;43:587–592. [DOI] [PubMed] [Google Scholar]
- 9. van Zijl PCM, Yadav NN. Chemical exchange saturation transfer (CEST): what is in a name and what isn't? Magn Reson Med. 2011;65:927–948. [DOI] [PMC free article] [PubMed] [Google Scholar]
- 10. van Zijl PCM, Lam WW, Xu J, Knutsson L, Stanisz GJ. Magnetization transfer contrast and chemical exchange saturation transfer MRI. Features and analysis of the field-dependent saturation spectrum. Neuroimage. 2018;168:222–241. [DOI] [PMC free article] [PubMed] [Google Scholar]
- 11. Knutsson L, Xu J, Ahlgren A, van Zijl PCM. CEST, ASL, and magnetization transfer contrast: How similar pulse sequences detect different phenomena. Magn Reson Med. 2018;80:1320–1340. [DOI] [PMC free article] [PubMed] [Google Scholar]
- 12. Chan KW, McMahon MT, Kato Y, Liu G, Bulte JW, Bhujwalla ZM, Artemov D, van Zijl PC. Natural D-glucose as a biodegradable MRI contrast agent for detecting cancer. Magn Reson Med. 2012;68:1764–1773. [DOI] [PMC free article] [PubMed] [Google Scholar]
- 13. Walker-Samuel S, Ramasawmy R, Torrealdea F, Rega M, Rajkumar V, Johnson SP, Richardson S, Gonçalves M, Parkes HG, Arstad E, Thomas DL, Pedley RB, Lythgoe MF, Golay X. In vivo imaging of glucose uptake and metabolism in tumors. Nat Med. 2013;19:1067–1072. [DOI] [PMC free article] [PubMed] [Google Scholar]
- 14. Nasrallah FA, Pages G, Kuchel PW, Golay X, Chuang KH. Imaging brain deoxyglucose uptake and metabolism by glucoCEST MRI. J Cereb Blood Flow Metab. 2013;33:1270–1278. [DOI] [PMC free article] [PubMed] [Google Scholar]
- 15. Yadav NN, Xu J, Bar-Shir A, Qin Q, Chan KW, Grgac K, Li W, McMahon MT, van Zijl PC. Natural D-glucose as a biodegradable MRI relaxation agent. Magn Reson Med. 2014;72:823–828. [DOI] [PMC free article] [PubMed] [Google Scholar]
- 16. Gore JC, Brown MS, Mizumoto CT, Armitage IM. Influence of glycogen on water proton relaxation times. Magn Reson Med. 1986;3:463–466. [DOI] [PubMed] [Google Scholar]
- 17. Zu Z, Spear J, Li H, Xu J, Gore JC. Measurement of regional cerebral glucose uptake by magnetic resonance spin-lock imaging. Magn Reson Imaging. 2014;32:1078–1084. [DOI] [PMC free article] [PubMed] [Google Scholar]
- 18. Rivlin M, Tsarfaty I, Navon G. Functional molecular imaging of tumors by chemical exchange saturation transfer MRI of 3-O-methyl-D-glucose. Magn Reson Med. 2014;72:1375–1380. [DOI] [PubMed] [Google Scholar]
- 19. Jin T, Iordanova B, Hitchens TK, Modo M, Wang P, Mehrens H, Kim SG. Chemical exchange-sensitive spin-lock (CESL) MRI of glucose and analogs in brain tumors. Magn Reson Med. 201880:488–495. [DOI] [PMC free article] [PubMed] [Google Scholar]
- 20. Schuenke P, Koehler C, Korzowski A, Windschuh J, Bachert P, Ladd ME, Mundiyanapurath S, Paech D, Bickelhaupt S, Bonekamp D, Schlemmer HP, Radbruch A, Zaiss M. Adiabatically prepared spin-lock approach for T1ρ-based dynamic glucose enhanced MRI at ultrahigh fields. Magn Reson Med. 2017;78:215–225. [DOI] [PubMed] [Google Scholar]
- 21. Paech D, Schuenke P, Koehler C, Windschuh J, Mundiyanapurath S, Bickelhaupt S, Bonekamp D, Bäumer P, Bachert P, Ladd ME, Bendszus M, Wick W, Unterberg A, Schlemmer HP, Zaiss M, Radbruch A. T1ρ-weighted dynamic glucose-enhanced MR imaging in the human brain. Radiology. 2017;285:914–922. [DOI] [PubMed] [Google Scholar]
- 22. Jin T, Mehrens H, Hendrich KS, Kim SG. Mapping brain glucose uptake with chemical exchange-sensitive spin-lock magnetic resonance imaging. J Cereb Blood Flow Metab. 2014;34:1402–1410. [DOI] [PMC free article] [PubMed] [Google Scholar]
- 23. Xu X, Chan KWY, Knutsson L, Artemov D, Xu J, Liu G, Kato Y, Lal B, Laterra J, McMahon M, van Zijl PCM. Dynamic glucose enhanced (DGE) MRI for combined imaging of blood brain barrier break down and increased blood volume in brain cancer. Magn Reson Med. 2015;74:1556–1563. [DOI] [PMC free article] [PubMed] [Google Scholar]
- 24. Xu X, Yadav NN, Knutsson L, Hua J, Kalyani R, Hall E, Laterra J, Blakeley J, Strowd R, Pomper M, Barker P, Chan K, Liu G, McMahon M, Stevens RD, van Zijl PCM. Dynamic glucose-enhanced (DGE) MRI: translation to human scanning and first results in glioma patients. Tomography. 2015;1:105–114. [DOI] [PMC free article] [PubMed] [Google Scholar]
- 25. Beckett KR, Moriarity AK, Langer JM. Safe use of contrast media: what the radiologist needs to know. RadioGraphics. 2015;35:1738–1750. [DOI] [PubMed] [Google Scholar]
- 26. Knutsson L, Ståhlberg F, Wirestam R. Absolute quantification of CBF using DSC-MRI? Pitfalls and Possibilities. MAGMA. 2010. February;23:1–21. [DOI] [PubMed] [Google Scholar]
- 27. Larsson HB, Courivaud F, Rostrup E, Hansen AE. Measurement of brain perfusion, blood volume, and blood-brain barrier permeability, using dynamic contrast-enhanced T(1)-weighted MRI at 3 tesla. Magn Reson Med. 2009;62:1270–1281. [DOI] [PubMed] [Google Scholar]
- 28. Tofts PS, and Kermode AG. Measurement of the blood–brain barrier permeability and leakage space using dynamic MR imaging. 1. Fundamental concepts. Magn Reson Med. 1991;17:357–367. [DOI] [PubMed] [Google Scholar]
- 29. Tofts PS. Modeling tracer kinetics in dynamic Gd-DTPA MR imaging. J Magn Reson Imaging. 1997;7:91–101. [DOI] [PubMed] [Google Scholar]
- 30. Takahashi K, Nakamura H, Sato H, Matsuda H, Takada K, Tsuji T. Four plasma glucose and insulin responses to a 75 g OGTT in healthy young Japanese women. J Diabetes Res. 2018. January 30;2018:5742497. [DOI] [PMC free article] [PubMed] [Google Scholar]
- 31. Nolfe G, Spreghini MR, Sforza RW, Morino G, Manco M. Beyond the morphology of the glucose curve following an oral glucose tolerance test in obese youth. Eur J Endocrinol. 2012;166:107–114. [DOI] [PubMed] [Google Scholar]
- 32. Vannucci SJ. Developmental expression of GLUT1 and GLUT3 glucose transporters in rat brain. J Neurochem. 1994;62:240–246. [DOI] [PubMed] [Google Scholar]
- 33. Powers WJ, Dagogo-Jack S, Markham J, Larson KB, Dence CS. Cerebral transport and metabolism of l-''C-D-glucose during stepped hypoglycemia. Ann Neurol. 1995;38:599–609. [DOI] [PubMed] [Google Scholar]
- 34. van Zijl PC, Davis D, Eleff SM, Moonen CT, Parker RJ, Strong JM. Determination of cerebral glucose transport and metabolic kinetics by dynamic MR spectroscopy. Am J Physiol. 1997;273(6 Pt 1):E1216–E1227. [DOI] [PubMed] [Google Scholar]
- 35. Ebeling P, Koistinen HA, Koivisto VA. Insulin-independent glucose transport regulates insulin sensitivity. FEBS Lett. 1998:436:301–303. [DOI] [PubMed] [Google Scholar]
- 36. Bardet S, Pasqual C, Maugendre D, Remy JP, Charbonnel B, Sai. Inter and intra individual variability of acute insulin response during intravenous glucose tolerance tests. Diabetes Metab. 1989;15:224–232. [PubMed] [Google Scholar]
- 37. Knutsson L, Ståhlberg F, Wirestam R. Aspects on the accuracy of rCBF using dynamic susceptibility contrast MRI under various experimental conditions: a simulation study. Magn Reson Imaging. 2004;22:789–798. [DOI] [PubMed] [Google Scholar]
- 38. Gruetter R, Novotny EJ, Boulware SD, Rothman DL, Mason GF, Shulman GI, Shulman RG, Tamborlane WV. Direct measurement of brain glucose concentrations in humans by 13C NMR spectroscopy. Proc Natl Acad Sci U S A. 1992;89:1109–1112. [DOI] [PMC free article] [PubMed] [Google Scholar]
- 39. Leybaert L, De Bock M, Van Moorhem M, Decrock E, De Vuyst E. Neurobarrier coupling in the brain: adjusting glucose entry with demand. J Neurosci Res. 2007;85:3213–3220. [DOI] [PubMed] [Google Scholar]
- 40. Puri BK, Lewis HJ, Saeed N, Davey NJ. Volumetric change of the lateral ventricles in the human brain following glucose loading. Exp Physiol. 1999;84:223–226. [DOI] [PubMed] [Google Scholar]
- 41. Hegen H, Auer M, Deisenhammer F. Serum glucose adjusted cut-off values for normal cerebrospinal fluid/serum glucose ratio: implications for clinical practice. Clin Chem Lab Med. 2014;52:1335–1340. [DOI] [PubMed] [Google Scholar]
- 42. Lund-Andersen H. Transport of glucose from blood to brain. Physiological Reviews. 1979;59:305–352. [DOI] [PubMed] [Google Scholar]
- 43. Hendrikse J, Petersen ET, van Laar PJ, Golay X. Cerebral border zones between distal end branches of intracranial arteries: MR imaging. Radiology. 2008;246:572–580. [DOI] [PubMed] [Google Scholar]