

Abstract
As Iran is one of the richest pistachio germplasms a few studies have been conducted on different sexes of pistachio trees, in areas where this crop emerged. To this end, 40 male and female Iranian pistachio genotypes from Feizabad region, Khorasan, Iran; were evaluated using morphological characters and randomly amplified polymorphic DNA (RAPD) markers. For morphological assessments, 54 variables were considered to investigate similarities between and among the studied genotypes. Morphological data indicated relative superiority in some female genotypes (such as Sefid 1, Sefid Sabuni 2, Garmesiah, and Ghermezdorosht Z) regarding characters such as halfcrackedness, the percentages of protein and fat content. 115 polymorphic bands were recorded with 92.83% average polymorphism among all primers. The total resolving power (Rp) of the primers was 74.54. The range of genetic similarity varied from about 0.31 to about 0.70. Genotypes were segregated into eight groups at the similarity limit of 0.41. Results of present investigation could be helpful for strategic decisions for maintaining Iranian pistachio genotypes.
Keywords: Pistachio, Genetic diversity, Morphological characters, RAPD
1. Introduction
The Pistachio, Pistacia vera L. which belongs to Anacardiaceae is a deciduous, dioecious and wind-pollinated tree species [22], [10]. It is referred to as the ‘‘green gold tree’’ due to its high economic and high nutritional value [3]. Its origin is still undefined, but the majority of researchers believe that it most likely originated from the Middle East [6], [17], [7]. Number of pistachio cultivars and genotypes indicate that Iran is one of the richest resources of pistachio in the world [20], [17]. Although Iran has the greatest cultivation area of pistachio in the world, it is clear, that for breeding of promising pistachio cultivars using this germplasms, an appropriate characterization and discrimination of the pistachio cultivars are indispensable. To date, different types of markers such as morphological, biochemical and molecular have been used for genetic variation analysis in pistachio. Different types of DNA markers have been studied for genetic diversity evaluation in pistachio, such as RFLPs [4], AFLPs [1], [18], [15], ISSR [11] and RAPD. Among them, RAPD developed by Williams et al. [9] has been commonly used for genetic variability assessment in pistachio [21], [8], [19]. All in all, among this vast range of studies genetic diversity of some Iranian Pistachios is not fully investigated by molecular markers. Hence, the present study sought to investigate a wide range of Iranian pistachio genotypes using morphological and RAPD markers and determine the associations between these markers.
2. Materials and methods
2.1. Plant materials and DNA extraction
The young leaves of 40 male (15 genotypes) and female (25 genotypes) pistachio genotypes were gathered from Khorasan, Iran (Table 1). DNA extraction was carried out using [13] with minor modifications. The DNA concentration and quality were estimated electrophoretically and spectrophotometrically, respectively.
Table 1.
Forty male and female studied genotypes.
| No. | Sex |
||||
|---|---|---|---|---|---|
| Female |
Male |
||||
| Genotype | No. | No. | Genotype | ||
| 1 | Badami sefid1 | 16 | Genotype16 | 1 | Genotype1 |
| 2 | Badami sefid2 | 17 | Genotype17 | 2 | Genotype2 |
| 3 | Badami sefid3 | 18 | Genotype18 | 3 | Genotype3 |
| 4 | Sefid sabuni1 | 19 | Genotype19 | 4 | Genotype4 |
| 5 | Sefid sabuni2 | 20 | Genotype20 | 5 | Genotype5 |
| 6 | Badamighermez | 21 | Genotype21 | 6 | Genotype6 |
| 7 | Ghermezzodrasdorosht | 22 | Genotype22 | 7 | Genotype7 |
| 8 | Germe riz1 | 23 | Genotype23 | 8 | Genotype8 |
| 9 | Germe riz2 | 24 | Genotype24 | 9 | Genotype9 |
| 10 | Germesiah | 25 | Genotype25 | 10 | Genotype10 |
| 11 | Germezodras | 11 | Genotype11 | ||
| 12 | Akbari | 12 | Genotype12 | ||
| 13 | Ohadi | 13 | Genotype13 | ||
| 14 | Momtaz | 14 | Genotype14 | ||
| 15 | Kale ghochi | 15 | Genotype15 | ||
2.2. Morphological evaluation
The morphological characters of the samples were determined on the basis of the pistachio descriptor. To this end, 55 morphological variables (44 quantitative and 11 qualitative) were recorded during 2 years as described in Table 2, Table 3.
Table 2.
Descriptive statistics for quantitative morphological traits among 15 male pistachio genotypes during 2 years of the study.
| No. | Character | Min | Max | Mean | CV | Unit |
|---|---|---|---|---|---|---|
| 1 | Tree canopy | 4.63 | 28.63 | 16.09 | 51.67 | m |
| 2 | Tree diameter | 27.67 | 96.33 | 63.26 | 39.17 | cm |
| 3 | Yearly growth of trees | 8.17 | 32.33 | 14.09 | 42.33 | cm |
| 4 | Number of buds | 5 | 12.33 | 8.75 | 25.51 | No. |
| 5 | Density of buds | 1.09 | 3.34 | 1.76 | 39.13 | No. |
| 6 | Length of multiple buds | 0.73 | 1.13 | 0.915 | 10.29 | cm |
| 7 | Width of multiple buds | 0.5 | 0.7 | 0.615 | 9.13 | cm |
| 8 | Thickness of multiple buds | 0.3 | 0.63 | 0.462 | 18.62 | cm |
| 9 | Number of leaflets | 2.67 | 4.67 | 3.22 | 16.89 | No. |
| 10 | Length of leaves | 10 | 16.17 | 12.06 | 13.01 | cm |
| 11 | Width of leaves | 10.83 | 19.5 | 15.04 | 16.08 | cm |
| 12 | Length of petioles | 3.33 | 7.83 | 4.67 | 24.95 | cm |
| 13 | Length of the terminal leaf | 6.5 | 13.17 | 9.85 | 17 | cm |
| 14 | Width of the terminal leaf | 4.67 | 8.5 | 6.33 | 17.59 | cm |
| 15 | Length of inflorescence | 1.6 | 4.63 | 3.31 | 25.54 | cm |
| 16 | Number of racemules per flower | 11.67 | 20 | 15.46 | 13.69 | No. |
| 17 | Pollen germination | 44 | 87 | 61 | 0.24 | % |
m = meter, cm = centimeter, No. = number, % = percent.
Table 3.
Descriptive statistics for 43 quantitative morphological traits among 25 female pistachio genotypes during 2 years of the study.
| No. | Character | Min | Max | Mean | CV | Unit |
|---|---|---|---|---|---|---|
| 1 | Tree canopy | 8.5 | 44.97 | 19.47 | 49.19 | m |
| 2 | Tree diameter | 37.67 | 98.33 | 69.29 | 25.87 | cm |
| 3 | Yearly growth of trees | 4 | 12.67 | 10.97 | 48.61 | cm |
| 4 | Number of buds | 3 | 9.33 | 6.05 | 24.50 | No. |
| 5 | Density of buds | 0.77 | 3.92 | 1.83 | 39.42 | No. |
| 6 | Length of multiple buds | 0.5 | 0.93 | 0.692 | 15.75 | cm |
| 7 | Width of multiple buds | 0.33 | 0.8 | 0.516 | 23.76 | cm |
| 8 | Thickness of multiple buds | 0.27 | 0.63 | 0.356 | 24.02 | cm |
| 9 | Number of leaflets | 2.67 | 4.67 | 3.2 | 12.75 | No. |
| 10 | Length of leaves | 8.17 | 14.5 | 11.65 | 13.88 | cm |
| 11 | Width of leaves | 12.83 | 18.17 | 15.81 | 9.92 | cm |
| 12 | Length of petioles | 3.33 | 8.67 | 5.32 | 23.48 | cm |
| 13 | Length of the terminal leaf | 7 | 12.67 | 9.78 | 12.77 | cm |
| 14 | Width of the terminal leaf | 4 | 8.5 | 6.14 | 14.81 | cm |
| 15 | Length of inflorescence | 4.17 | 12.83 | 7.04 | 27.24 | cm |
| 16 | Number of racemules per flower | 9 | 16.33 | 12.78 | 14.71 | No. |
| 17 | Percentage of fruit formed | 7 | 25.33 | 15.81 | 13.72 | % |
| 18 | Fruit length | 1.1 | 2.43 | 2.08 | 14.39 | cm |
| 19 | Fruit width | 1.1 | 1.83 | 1.37 | 14.66 | cm |
| 20 | Fruit thickness | 0.63 | 1.5 | 1.02 | 22.04 | cm |
| 21 | Number of fruit per inflorescence | 11 | 28 | 19.47 | 26.9 | No. |
| 22 | Kernel infestation | 0 | 4.17 | 1.27 | 17.40 | % |
| 23 | Half-crackedness | 71 | 93.33 | 85.6 | 7.17 | % |
| 24 | Unfilled fruit | 0 | 5.67 | 2.15 | 74.93 | % |
| 25 | Weight of 100 pistachios | 2.43 | 4.33 | 3.45 | 13.98 | g |
| 26 | Weight of 100 dried pistachios | 72.8 | 122.57 | 98.46 | 13.07 | g |
| 26 | Weight of 100 dried pistachio kernels | 37.39 | 67.86 | 50.41 | 13.99 | g |
| 28 | Ratio of the weight of 100 dried pistachio kernels to the weight of 100 pistachios | 35.95 | 62.5 | 50.6 | 11.55 | g |
| 29 | The ratio of the pistachio kernel to the testa | 0.65 | 1.27 | 1.02 | 12.82 | g |
| 30 | Length of the pistachio kernel | 1.13 | 1.97 | 1.67 | 10.97 | cm |
| 31 | Width of the pistachio kernel | 0.6 | 1.23 | 0.839 | 16.5 | cm |
| 32 | Thickness of the pistachio kernel | 0.63 | 1.1 | 0.879 | 13.54 | cm |
| 33 | Lipid | 45.47 | 57.29 | 51.42 | 5.18 | % |
| 34 | Proteins | 16.27 | 32.1 | 21.81 | 16.55 | % |
| 35 | Nitrogen | 2.2 | 4.29 | 3.34 | 15.4 | % |
| 36 | Sodium | 0.05 | 0.18 | 0.091 | 30.61 | % |
| 37 | Potassium | 0.69 | 1.35 | 0.999 | 15.37 | % |
| 38 | Calcium | 0.24 | 0.47 | 0.375 | 16.4 | % |
| 39 | Magnesium | 0.13 | 0.18 | 0.154 | 11.20 | mg/l |
| 40 | Fe | 17 | 62.4 | 37.84 | 35.19 | mg/l |
| 41 | Manganese | 0.73 | 17.33 | 12.85 | 23.46 | mg/l |
| 42 | Zinc | 6.77 | 30.3 | 23.68 | 20.54 | mg/l |
| 43 | Phosphorous | 0.43 | 0.73 | 0.566 | 14.1 | % |
m = meter, cm = centimeter, No. = number, % = percent, mg/l = milligrams per liter.
2.3. Molecular evaluation
Initially, a total of 60 RAPD primers were applied for PCR amplification. Of these, 15 RAPD primers which produced discernible and reproducible bands were selected for amplification (Table 4). RAPD amplification was carried out according to Williams et al. [9] with minor modifications in thin-walled microcentrifuge tubes by thermocycler (iCycler, Bio Rad Co., USA).
Table 4.
RAPD primers and number of polymorphic bands.
| Primer | Sequence 5′ → 3′ | No. of bands | No. of polymorphic bands | Polymorphism (%) | Resolving power (Rp) |
|---|---|---|---|---|---|
| BE11 | GTCCTGCTGT | 7 | 7 | 100 | 4.57 |
| BD11 | CAACCGAGTC | 9 | 9 | 100 | 6.36 |
| BC07 | TGTGCCTGAC | 7 | 6 | 85.71 | 4.10 |
| BC08 | GGTCTTCCCT | 5 | 5 | 100 | 2.94 |
| BC12 | CCTCCACCAG | 10 | 10 | 100 | 7.89 |
| BC13 | CCTGGCACAG | 11 | 10 | 90.9 | 6.94 |
| BC17 | CCGTTAGTCC | 6 | 3 | 50 | 1.36 |
| BC18 | GTGAAGGAGG | 12 | 11 | 91.66 | 7.36 |
| OPC07 | GTCCCGACGA | 6 | 5 | 83.33 | 3.21 |
| OPC09 | CTCACCGTCC | 5 | 5 | 100 | 3.94 |
| OPB17 | AGGGAACGAG | 9 | 9 | 100 | 5.52 |
| OPE11 | GAGTCTCAGG | 7 | 7 | 100 | 4.47 |
| OPK10 | GTGCAACGTG | 8 | 8 | 100 | 4.31 |
| OPN13 | AGCGTCACTC | 10 | 10 | 100 | 6.84 |
| OPG11 | TGCCCGTCGT | 11 | 10 | 90.9 | 4.73 |
| Total | – | 123 | 115 | – | 74.54 |
| Average | – | 8.2 | 7.66 | 92.83 | 4.97 |
Reaction was performed in a final volume of 25 μl, containing 2.5 μl of 10× PCR buffer (20 mM of Tris–HCl, pH = 8.4, 50 mM KCl), 1.75 mM of MgCl2, 0.2 mM of each dNTPs, 0.2 μM of each primer, 10 ng of genomic DNA, and 1 unit of Taq DNA polymerase. The amplification conditions for the RAPD markers were an initial step of 3 min at 94 °C followed by 40 cycles of 1 min at 94 °C for denaturing 45 s at 37.5 °C for annealing, 2 min at 72 °C for extension and a final extension of 5 min at 72 °C. Amplified PCR products were electrophoresed through 1.2% (w v−1) agarose gels using TBE buffer. The DNA bands were stained with Ethidium Bromide and digitalized under UV light (Gel Doc system: UVP, Bio Doc Co., USA) for further analysis.
2.4. Band scoring
Bands were scored as 1 denoting presence or 0 denoting absence, and the data were entered into a binary matrix as discrete variables. For each of the primers the Resolving power (Rp) was determined. Rp expresses the degree of efficiency of a primer in isolating and segregating samples studied [2] and it is calculated using the following formulas: ; . In these formulas, lb is the degree of informativeness of each of the bands of a primer and, according to the above formulas, it may vary from zero to one for each of the bands produced; and p represents the proportion of the genotypes which possess the band under consideration.
2.5. Statistical analysis
Cluster analysis for morphological characters was carried out using SPSS 20 (SPSS Inc., Chicago, IL, USA). The genetic similarities for the RAPD were calculated using the Jaccard similarity index [14]. The cophenetic correlation coefficient was generated by means of a COPH algorithm. Complete linkage was performed to set up a dendrogram using RAPD data. The cluster and PCA analyses were conducted using the NTSYS-pc software version 2.02 [5].
3. Results and discussion
3.1. Morphological analysis
Based on cluster analysis, the 25 female genotypes were divided into three major groups (Fig. 1). Group I consists of eight genotypes and was divided into two subgroups. The first subgroup consists of Badamisefid, Ohadi, Sefidsabuni2, Garmeriz1, Garmeriz2, and Badamighermez genotypes. The leaves of these genotypes were larger than other groups; also pistachio nuts were smaller and lighter than most of the genotypes (Table 1). The second subgroup of group I included Badamisefid 1 and 2 genotypes. Flowering and maturity time of these genotypes was later than most of the genotypes; and their zinc content was lower than the other groups. Group II consists of seven genotypes. This group was also divided into two subgroups. The first subgroup consists of three genotypes (Nos. 16, 18 and 23). Leaf size of these genotypes was the smallest among all genotypes; also the percentage of half-crackedness and iron content in this subgroup was relatively high. The genotypes 19, 20, 21 and Sefidsabuni1 were in the second subgroup, which had considerably large pistachio nuts and high protein content. Group III consists of ten genotypes. This group was divided into three subgroups. The genotype 24, Momtaz and Kale Ghuchi were in the first subgroup. They were medium maturing with respect to phenological features such as the time when leaves emerged, inflorescences formed, and pistachio nuts ripened; and they had considerably large amounts of iron, manganese and zinc in their pistachio nuts. The second subgroup consists of genotypes 17, 22, 25 and Garme-Zoodras-Dorosht, which were early maturing and had a lower percentage of half-crackedness than other groups. The third subgroup contained Garme-Zoodras-Dorosht, Garmesiah, and Akbari genotypes. They had large leaf surface areas and high percentages of half-crackedness; they were early maturing as well, their protein content was lower than other genotypes, and they had lower iron and manganese in their pistachio nuts. The result of dendrogram analysis showed that the Ohadi variety with the genotypes of Badamisefid 1, Sefidsabuni2, the genotype 24, Garmesiah, and Garme-Zoodras-Dorosht was in the same group with the main commercial varieties of Ohadi, Kale Ghuchi, Momtaz, and Akbari. This shows that the variety Ohadi and its genotypes have morphological features and chemical compositions similar to those of these commercial varieties; and that it will be possible, by carrying out further studies, to use these genotypes extensively and commercially according to their adaptation to their environment. Of course, weather conditions are one of the factors that have to be taken into account because the yield and fruit bearing of pistachio trees vary under different weather conditions. However, cold winters and hot summers are favorable in pistachio production. Cluster analysis divided male genotypes into two groups (Fig. 2). The first group consists of six genotypes (Nos. 1, 6, 7, 8, 9 and 10) and group 2 included nine genotypes (Nos. 2, 3, 4, 5, 11, 12, 13, 14 and 15). The genotypes in group 1 had late flowering and lower percentage of pollen germination (45–78%) than the second group. Group 2 genotypes had early to medium flowering, which could be used for adapting the time of flowering for the female varieties. Results indicate that male genotypes have lower variation than female genotypes (Figure 1, Figure 2). It can be explained by the fact that nowadays asexual propagation has become common and most pistachio growers use grafting for propagations. In general, among the female genotypes studied, the genotypes Badamisefid 1 and Sefidsabuni2 are extensively used in areas with similar weather conditions to those in Feizabad, Khorasan, Iran, because they have large pistachio nuts along with suitable colors, which are preferred in the market. The genotypes Garmesiah and Garme-Zoodras-Dorosht, which have the important advantage of early maturity, are proposed for consumption as unprocessed pistachios. The genotypes 11, 12, 13, and 14, which have a long flowering period and possess a high percentage of pollen germination, could be used as the male genotypes. Of course, it is worth noting that the genotypes mentioned are medium flowering and must be used together with female varieties and genotypes with overlapping flowering.
Figure 1.

Dendrogram of 25 female genotypes of pistachio of Iran, according to the morphological characters using Ward’s minimum variance.
Figure 2.
Dendrogram of 15 male genotypes of pistachio of Iran, according to the morphological characters using Ward’s minimum variance.
3.2. RAPD analysis
Among 60 examined RAPD primers, 15 produced amplified polymorphic bands. A gel image of OPG11 primer is shown as an example (Fig. 3). A total of 123 bands were produced by these 15 primers of which 115 (93.5%) were polymorphic (Table 2). The number of produced bands ranged from 5 to 12 among primers with an average of 7.66 polymorphic bands per primer. The total Resolving power (Rp) of the primers was 74.54 with an average of 4.97 for each primer. The highest and lowest of this value were 7.89 and 1.36 in BC12 and BC17 primers, respectively (Table 2). The result obtained from the similarity matrix showed the highest similarity (74%; data not shown) between two male genotypes (Nos. 13 and 14), these genotypes were collected from one location, and they have probably descended from the same parents. The lowest similarity (18%) was observed among the female genotypes Garmesiah and Sefidsabuni that was as expected, because of difference in their morphological features. The average genetic similarity among the genotypes studied was 0.46% for the female genotypes and 0.56% for the male genotypes. This indicates that the female genotypes have greater genetic diversity than their male counterparts; this result is similar to morphological cluster. The greater similarity among the male genotypes can be attributed to the fact that the number of male genotypes was lower than the female ones. The mean of genetic similarity for all genotypes was 0.51% which is lower than report given by Kamangar and Farsam [23]. They studied genetic diversity among Kerman genotypes and reported 0.63% for the mean of genetic similarity; it shows that pistachios of Feizabad have higher genetic diversity than Kerman pistachios. The Mantel analysis between the Jaccard similarity coefficients that were calculated based on the presence or absence of the RAPD markers demonstrated a low correlation (0.54), denoting a low fitness between the dendrogram clusters and the similarity matrices.
Figure 3.

RAPD patters of male and female of pistachio genotypes produced by primer OPG11.
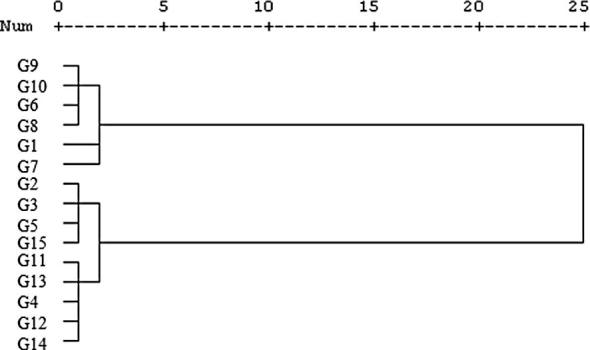
According to the RAPD cluster, three main groups were produced (Fig. 4). Group I consists of 13 genotypes. This group was divided into two subgroups. The first subgroup consists of 11 genotypes, four of them were male genotypes (Nos. 6, 11, 12, 15). Genotypes 11, 12 and 15 in male morphological dendrogram, also were in one group (Fig. 2). The second subgroup included two female genotypes Garme-Rize1 and Garme-Siah. These genotypes in female morphological cluster had a high distance from each other (Fig. 1). Group II consists of 23 genotypes. This group was also divided into two subgroups. The first subgroup consists of 19 genotypes. Two male genotypes (Nos. 13 and 14) in this subgroup had the highest genetic similarity in the root of dendrogram. These genotypes in male morphological genotypes were in one cluster and had a low distance. In this group, also two other genotypes had a high genetic similarity (Nos. 2 and Ohadi). Four genotypes were in secondary subgroup (10, 20, 22 and Badami-Ghermez), that genotype 10 was male and three other genotypes were female. Group III had high distance from two other groups. One female (Sefidsabuni1) and one male (No. 4) genotype were in this group. In three groups, male and female genotypes were seen. It indicated that the selected primers were not useful for separating the genotypes based on sex condition.
Figure 4.

Dendrogram of 38 pistachio genotypes (G1–G15 are male and other are female) based on RAPD data using the complete linkage method.
As shown in Fig. 2, the Momtaz and Ohadi genotypes were in group II; this result is in concurrence with Mirzaei et al. [21] and Kamangar and Farsam [23]. Their presence in one group can be a compelling reason for considering Khorassan as one of the pistachios origins. That could be investigated for finding more wild genotypes and gene pools in the future. To compare the extent of agreement between information derived from morphological and RAPD markers, a similarity matrix was constructed for each assay and compared using the Mantel test. The low relationship observed between morphological and molecular markers (r = −0.12, p = 0.021) could be due to sampling deviation and failure of phenotypes to differentiate the genotypes precisely [16], [12]. Principle component analysis (PCA) indicated that the first three principal components account for more than 47% of the total variation. The PCA analysis plot demonstrates that Sefidsabuni1 genotype is clustered at the bottom of the plot and is separated from the other genotypes, a result that corresponds closely to the cluster analysis results (Fig. 5). The information presented here could be useful in selecting suitable rootstocks and scions for improving the existing orchards. Moreover, because of the diversity of weather conditions all over the world, paying attention to the similarities of the genotypes can help us to select suitable genotypes for establishing new orchards in a specific geographical area. Obviously, it is possible to segregate the genotypes present in this region more minutely and with greater accuracy by using more primers and by employing other types of molecular markers. The information thus gathered can be exploited in breeding programs.
Figure 5.
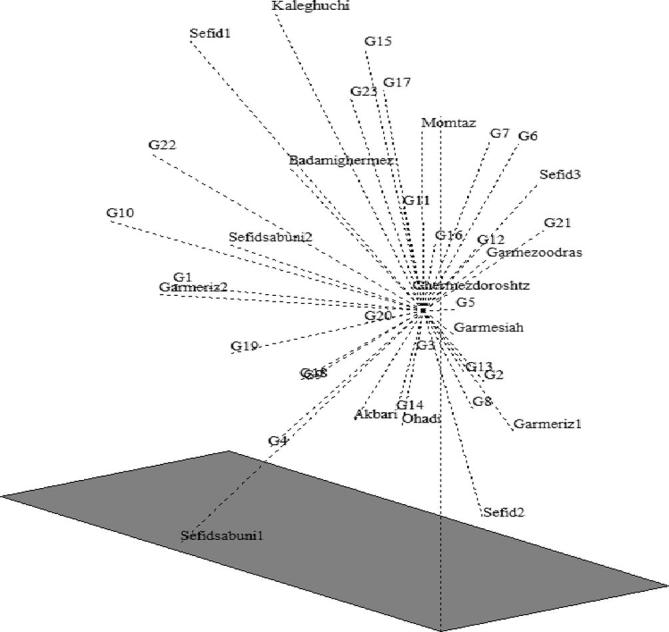
Three plots derived from the principal component analysis of 38 pistachio genotypes (G1–G15 are male and others are female).
These genotypes are native and it has taken a long time to evolve under the prevailing soil and climatic conditions of the condition, they can be suitable candidates to be selected for improving programs for pistachio varieties and also could be considered as valuable gene pools. In conclusion, the results of the present study indicate a high genetical and morphological diversity among native pistachio genotypes, therefore it is necessary to identify and preserve these valuable germplasms for strategic decisions for maintaining Iranian pistachio genotypes.
Footnotes
Peer review under responsibility of National Research Center, Egypt.
References
- 1.Katsiotis A., Hagidimitriou M., Drossou A., Pontikis C., Loukas M. Euphytica. 2003;132:279–286. [Google Scholar]
- 2.Prevost A., Wilkinson M.J. Theor. Appl. Genet. 1999;98(1):107–112. [Google Scholar]
- 3.Benmahioul B., Dorion N., Kaid-Harche M., Daguin F. Plant Cell Tissue Organ Cult. 2012;108(2):353–358. [Google Scholar]
- 4.Parfitt D.E., Badenes L.Maria. Proc. Natl. Acad. Sci. 1997;94(15):7987–7992. doi: 10.1073/pnas.94.15.7987. [DOI] [PMC free article] [PubMed] [Google Scholar]
- 5.F.J. Rohlf, NTSYS-pc Numerical taxonomy and multivariate analysis system, Version 2.00, Exeter Software, Setauket, New York, (1998).
- 6.Hosseinzadeh H., Abolghasem S., Tabassi S., Moghadam N., Rashedinia M., Mehri H.S. Iranian J. Pharm. Res. 2012;11(3):879–887. [PMC free article] [PubMed] [Google Scholar]
- 7.Maghsoudi H., Khoshtaghaza M.H., Minaei S., Dizaji H.Z. J. Agric. Sci. Technol. 2012;14:299–310. [Google Scholar]
- 8.Hormaza J.I., Pinney K., Polito V.S. Econ. Bot. 1998;52(1):78–87. [Google Scholar]
- 9.Williams J.G.K., Kubelik A.R., Livak K.J., Rafalski J.A., Tingey S.V. Nucleic Acids Res. 1990;18:6531–6535. doi: 10.1093/nar/18.22.6531. [DOI] [PMC free article] [PubMed] [Google Scholar]
- 10.Djamila K., Ammar B., Mefti M. E3 J. Biotechnol. Pharm. Res. 2012;3(3):47–53. [Google Scholar]
- 11.Fares K., Guasmi F., Touil L., Triki T., Ferchichi A. Biotechnology. 2009;8:24–34. [Google Scholar]
- 12.Farajpour M., Ebrahimi M., Amiri R., Golzari R., Sanjari S. Biochem. Syst. Ecol. 2012;43:73–79. [Google Scholar]
- 13.Murray M.G., Thompson W.Fm. Nucleic Acids Res. 1980;8(19):4321–4326. doi: 10.1093/nar/8.19.4321. [DOI] [PMC free article] [PubMed] [Google Scholar]
- 14.Sneath P.H., Sokal R.R. Numeric. Taxon. Princ. Pract. Numeric. Classif. 1973 [Google Scholar]
- 15.Shanjani P., Mardi M., Pazouki L., Hagidimitriou M., Avanzato D., Pirseyedi S.M. Tree Genet. Genomes. 2009;5(3):447–458. [Google Scholar]
- 16.Dreisigacker S., Zhang P., Warburton M.L., Van Ginkel M., Hoisington D., Bohn M., Melchinger A.E. Crop Sci. 2004;44:381–388. [Google Scholar]
- 17.Mahmoodabadi S.K., Panahi B., Agharahimi J., Salajegheh F. J. Biol. Environ. Sci. 2012;6(16):81–86. [Google Scholar]
- 18.Kafkas S. Plant Syst. Evol. 2006;262(1–2):113–124. [Google Scholar]
- 19.Kafkas S., Perl-Treves R. Theor. Appl. Genet. 2001;102(6–7):908–915. [Google Scholar]
- 20.Karimi S., Rahemi M. J. Nuts. 2012;3(2):21–30. [Google Scholar]
- 21.Mirzaei S., Bahar M., Sharifnabi B. Acta Horticult. 2004;726:30–43. [Google Scholar]
- 22.Abu-Zahra T., Al-Abbadr A. J. Plant Sci. 2007;2:228–232. [Google Scholar]
- 23.Kamangar T., Farsam H. J. Food Sci. 1997;42(4):1135–1136. [Google Scholar]