

Abstract
Background:
Cardiac events after electroconvulsive therapy (ECT) have been reported sporadically, but a systematic assessment of the risk is missing. The goal of this study was to obtain a robust estimate of the incidence of major adverse cardiac events in adult patients undergoing ECT.
Methods:
Systematic review and meta-analysis of studies that investigated ECT and reported major adverse cardiac events and/or mortality. Endpoints were incidence rates of major adverse cardiac events, including myocardial infarction, arrhythmia, pulmonary edema, pulmonary embolism, acute heart failure, and cardiac arrest. Additional endpoints were all-cause and cardiac mortality. We calculated pooled estimated incidence rates and 95% confidence intervals (CI 95) of individual major adverse cardiac events and mortality per 1,000 patients and per 1,000 ECT treatments.
Results:
After screening of 2,641 publications and full-text assessment of 284 studies, data of 82 studies were extracted (total n=106,569 patients; n=786,995 ECT treatments). The most commonly reported major adverse cardiac events were acute heart failure, arrhythmia, and acute pulmonary edema with an incidence [CI 95] of 24 [12.48 – 46.13], 25.83 [14.83 – 45.00], and 4.92 [0.85 – 28.60] per 1,000 patients, or 2.44 [1.27 – 4.69], 4.66 [2.15 – 10.09], and 1.50 [0.71 – 3.14] per 1,000 ECT treatments. All-cause mortality was 0.42 [0.11 – 1.52] deaths per 1,000 patients and 0.06 [0.02 – 0.23] deaths per 1,000 ECT treatments. Cardiac death accounted for 29% (23/79) of deaths.
Conclusions:
Major adverse cardiac events and death after ECT are infrequent and occur in about one in 50 patients and after about one in 200 – 500 ECT treatments.
Introduction
Electroconvulsive therapy (ECT) provides a potentially life-saving option for severe psychiatric conditions.1 ECT is generally considered safe.2 Nevertheless, the brief, yet intense, hemodynamic stress caused by seizure initiation during ECT may increase the risk of cardiovascular events, especially in patients with pre-existing cardiovascular conditions.3,4
Major adverse cardiovascular events after ECT, such as acute myocardial infarction or acute heart failure, have been reported sporadically in individual case reports5,6 or case series.7 Retrospective cohort studies8–10 have aimed to assess the risk of major adverse cardiac events after ECT, but the infrequent occurrence of these complications rendered it difficult to obtain good population-level estimates about true incidence rates.11,12 To obtain a more robust estimate about the incidence of major adverse cardiac events and mortality after ECT we therefore conducted a systematic review and meta-analysis.
Methods
Data Sources
PubMed, PsychInfo, Scopus, Cochrane CENTRAL, Cochrane SysReviews and Current Content were searched with cut-off date of November 12, 2016. Additionally, bibliographies of articles included in data extraction and of pertinent books were hand searched. Articles reporting cardiac morbidity and mortality in the context of ECT published from January 1, 1980 to November 12, 2016 were identified using indexed terms and text words (see supplemental digital content, S1. Search terms and engines).
Study Selection
After screening of 2641 publications by two independent investigators, 284 studies were assessed in full text for eligibility. Interventional, retrospective and prospective observational studies and surveys that investigated ECT and reported major adverse cardiac events and/or mortality were included for data extraction. Exclusion criteria were ECT performed in children (age 18 years or younger) or pregnant women, ECT performed without general anesthesia, or reports in any language other than English or German. Studies that mentioned neither the absence nor the occurrence of adverse events were excluded from data extraction (qualitative analysis).
Data Extraction and Synthesis
The PRISMA guidelines were followed to extract data. Quality of harms assessment and reporting was based on the McMaster tool.13 Ten percent of selected articles were captured by two independent investigators to test the feasibility of prespecified criteria and to develop a data extraction plan (see supplemental digital content; S2. Items extracted and risk of bias assessment at study-level). The criteria were discussed and a database developed on consensus of all investigators that allowed uniform capture of data extraction. Three investigators (AD, MM, BP) retrieved data of a randomly chosen subset of studies. Of each study included in the qualitative analysis a single investigator extracted the number of included patients, the number of ECT treatments, frequency of reported major adverse cardiac events, cardiac death and all-cause mortality, the design, information about the population’s cardiovascular health status at inclusion, duration of follow-up and the quality of harms reporting. Extracted components of major adverse cardiac events were myocardial infarction, arrhythmia, pulmonary edema, pulmonary embolism, acute heart failure, and cardiac arrest. Supplemental digital content (S3. Definition of Major Adverse Cardiac Events and Death) provides the definition used for each component of MACE and mortality. Most studies did only report a subset of major adverse cardiac events and/or mortality.
Risk of bias was assessed based on study design, cardiovascular health status at inclusion, duration of follow-up and the quality of harms reporting (see supplemental digital content; S2. Items extracted and risk of bias assessment at study-level). Finally, extraction and adjudication of outcome data included in the meta-analysis was repeated by a second investigator and differences compared to the first investigator discussed and corrected. The meta-analysis of each component of major adverse cardiac events included studies that reported the occurrence or absence of the investigated component of major adverse cardiac events. In 28 of 82 studies, authors reported that there were “no adverse events”, but did not report what type of adverse events were assessed. Those studies were not included to calculate incidence rate of major adverse cardiac events, because the risk that such events may have been missed was deemed too high. However, it appeared unlikely that authors missed deaths and therefore, these 28 studies were included in the calculation of mortality incidence. The meta-analysis of all-cause mortality and cardiac death included studies that reported the occurrence of death or absence of any adverse event within 30 days after ECT. In a sensitivity analysis of mortality, we excluded studies that reported the absence of any adverse events.
Statistical Analysis
Incidence rates of major adverse cardiac events, which included acute myocardial infarction, arrhythmia, pulmonary edema, pulmonary embolism, acute heart failure, and cardiac arrest, are reported. Additionally, we report incidence rates of all-cause mortality and cardiac death. For each individual study, probability and the Jeffrey’s confidence interval were calculated.14 We estimated the pooled probabilities and 95% confidence interval (CI 95) using two different methods that were considered equally appropriate for a meta-analysis of rare or zero events studies: One analysis was a random effects model based on the method of DerSimonian and Laird with the estimate of heterogeneity from the Mantel-Haenszel model and standard error by Jeffrey’s beta distribution based method for zero event studies. The other analysis was a random effects Poisson model.15
Each of the methods involves certain assumptions. In our context, the DerSimonian and Laird (D&L) method assumes that the observed adverse event rate in each study can be partitioned into two additive components, a true rate for studyi denotedθi, and sampling error. The studies are assumed to be a sample from a hypothetical population of studies, so that , where μ is the population mean and δi is the deviation of the ith study’s rate from the population mean. The pooled estimate of μ is obtained by taking a weighted average of the observed rates across the different studies, where the weights depend on the sampling error for each study plus a second parameter that represents the between-study variation in the . An added complication arises when estimating the sampling error for studies in which no adverse events occur, and for this we used Jeffrey’s beta distribution-based method as noted above.
In the Poisson modelling (Poi) approach, the number of adverse events observed in study i is assumed to arise from a Poisson distribution with mean μi, where the μi, in turn, are assumed to have been drawn from a distribution of values across a hypothetical population of similar studies. This model directly accommodates studies in which no event occurs, but makes the further assumption that the random, study-specific deviations are normally distributed. These different modelling assumptions and the computational techniques that go with them can lead to different pooled estimates and confidence intervals. As neither method has been proven superior but handle zero events, heterogeneity and between-study variability differently, we decided to present the estimates from both models, although in the Abstract we present only the generally higher, Poi-based estimates. Data are presented as incidence rate per 1,000 patients and per 1,000 ECT treatments. For each investigated outcome, Forest plots were produced using GraphPad Prism (version 6.07; La Jolla, CA). Microsoft Access, Microsoft Excel (Microsoft, Redmond, WA) and Stata (version 14.1; College Station, TX) were used for data management and statistical analyses.
Results
Of 2,641 screened publications, 284 were assessed in full-text, of which data of 82 studies (32 interventional studies; 46 observational studies; 4 surveys) were extracted (total n=106,569 patients; n=786,995 ECT treatments; Figure 1). Most studies reported only a subset of major adverse cardiac events and/or deaths. Incidence rates of major adverse cardiac events after ECT could be extracted from 54/82 studies, and mortality data from 43/82 (see supplemental digital content, S4. List of studies included in the meta-analysis). Sample sizes for extracted individual major adverse cardiac events (denominators) ranged from n=375 patients (acute heart failure) to n=51,291 patients (cardiac arrest), or n=1,457 ECT treatments (pulmonary embolism) to n=297,624 ECT treatments (cardiac arrest). Sample sizes for mortality were n=75,587 patients and n=688,525 ECT treatments. Considerable heterogeneity (I2 > 50 %) was observed in the incidence rates of arrhythmia (I2 = 81.2 % - 88.8 %), cardiac arrest (I2 = 74.8 % - 75.8 %), and all-cause mortality (sensitivity analysis) (I2 = 71.6% - 79.3%).
Figure 1.
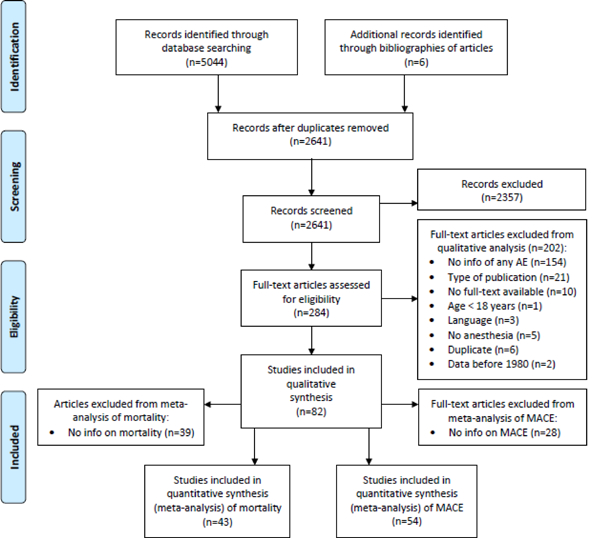
PRISMA flowchart Process from identification to inclusion of reports. MACE = major adverse cardiac events
The most commonly reported major adverse cardiac event was acute arrhythmia (n=39 studies) with an estimated incidence rate of 14.82 [8.63 – 21.02] using the DerSimonian and Laird model and 25.83 [14.83 – 45.00] per 1,000 patients using the Poisson model or 0.87 [0.38 – 1.37] and 4.66 [2.15 – 10.09] per 1,000 ECT treatments (Table 1). Acute heart failure was reported in a smaller number of studies (n=3), but had a higher incidence rate: 19.98 [5.85 – 34.11] (DerSimonian and Laird model) and 24 [12.48 – 46.13] (Poisson model) per 1,000 patients or 2.08 [0.61 – 3.55] (DerSimonian and Laird model) and 2.44 [1.27 – 4.69] (Poisson model) per 1,000 ECT treatments. Acute pulmonary edema (n=4 studies), which could be of cardiac or non-cardiac origin, had an incidence rate of 7.59 [0.00 – 20.09] (DerSimonian and Laird model) and 4.92 [0.85 – 28.60] (Poisson model) per 1,000 patients or 1.22 [0.22 – 2.23] (DerSimonian and Laird model) and 1.50 [0.71 – 3.14] (Poisson model) per 1,000 ECT treatments. All-cause mortality (n=41 studies) was 0.13 [0.00 – 0.27] (DerSimonian and Laird model) and 0.42 [0.11 – 1.52] (Poisson model) per 1,000 patients or 0.05 [0.01 – 0.08] (DerSimonian and Laird model) and 0.06 [0.02 – 0.23] (Poisson model) per 1,000 ECT treatments (Table 2). In a sensitivity analysis, where we excluded studies (n=13 studies) that reported simply that no adverse events occurred, but without giving any details, the estimated all-cause mortality rate was 0.33 [0.01 – 0.64] (DerSimonian and Laird model) and 0.75 [0.17 – 3.24] (Poisson model) per 1,000 patients or 0.06 [0.02 – 0.11] (DerSimonian and Laird model) and 0.10 [0.02 – 0.42] (Poisson model) per 1,000 ECT treatments. Cardiac death accounted for 29% (23 of 79 deaths) of deaths.
Table 1.
Incidence of major adverse cardiac events after ECT
| Patients | ECT treatments | |||||||
|---|---|---|---|---|---|---|---|---|
| Adverse events | Studies (n) | Events / Patients | Model | Incidence [95% CI] | Studies (n) | Events / ECTs | Model | Incidence [95% CI] |
| per 1,000 patients | per 1,000 ECTs | |||||||
| Myocardial infarction | 9 | 12 / 3,827 | D&L | 1.11 [0.00 – 2.58] | 9 | 12 / 25,529 | D&L | 0.77 [0.00 – 1.58] |
| Poi | 6.10 [2.06 – 18.08] | Poi | 0.97 [0.34 – 2.75] | |||||
| Life-threatening arrhythmia | 39 | 146 / 7,754 | D&L | 14.82 [8.63 – 21.02] | 41 | 252 / 132,138 | D&L | 0.87 [0.38 – 1.37] |
| Poi | 25.83 [14.83 – 45.00] | Poi | 4.66 [2.15 – 10.09] | |||||
| Acute pulmonary edema | 4 | 7 / 1,783 | D&L | 7.59 [0.00 – 20.09] | 4 | 7 / 4,675 | D&L | 1.22 [0.22 – 2.23] |
| Poi | 4.92 [0.85 – 28.60] | Poi | 1.50 [0.71 – 3.14] | |||||
| Pulmonary embolism | 2 | 1 / 1,447 | D&L | 0.70 [0.00 – 2.06] | 2 | 1 / 1,457 | D&L | 0.70 [0.00 – 2.06] |
| Poi | 0.69 [0.10 – 4.91] | Poi | 0.69 [0.10 – 4.87] | |||||
| Acute heart failure | 3 | 9 / 375 | D&L | 19.98 [5.85 – 34.11] | 3 | 9 / 3,687 | D&L | 2.08 [0.61 – 3.55] |
| Poi | 24 [12.48 – 46.13] | Poi | 2.44 [1.27 – 4.69] | |||||
| Cardiac arrest | 8 | 56 / 51,291 | D&L | 0.95 [0.00 – 1.89] | 8 | 56 / 297,624 | D&L | 0.15 [0.01 – 0.28] |
| Poi | 4.23 [0.69 – 25.84] | Poi | 0.56 [0.10 – 3.23] | |||||
Incidence [95% CI] was determined per 1,000 patients and per 1,000 ECT treatments using two random effects models. D&L = DerSimonian and Laird model, Poi = poisson model, ECT = Electroconvulsive therapy, n = count, CI = confidence interval.
Table 2.
Incidence of mortality after ECT
| Patients | ECT treatments | |||||||
|---|---|---|---|---|---|---|---|---|
| Mortality | Studies (n) | Events / Patients | Model | Incidence [95% CI] | Studies (n) | Events / ECTs | Model | Incidence [95% CI] |
| per 1,000 patients | per 1,000 ECTs | |||||||
| Studies reporting no AE included | ||||||||
| All-cause Mortality | 41 | 49/ 75,587 | D&L | 0.13 [0.00 – 0.27] | 43 | 79 / 688,525 | D&L | 0.05 [0.01 – 0.08] |
| Poi | 0.42 [0.11 – 1.52] | Poi | 0.06 [0.02 – 0.23] | |||||
| Cardiac Deaths | 37 | 15 / 45,568 | D&L | 0.04 [0.00 – 0.15] | 39 | 23 / 525,419 | D&L | 0.01 [0.00 – 0.03] |
| Poi | 0.12 [0.01 – 1.15] | Poi | 0.02 [0.00 – 0.12] | |||||
| Studies reporting no AE excluded (sensitivity analysis) | ||||||||
| All-cause Mortality | 13 | 49 / 74,128 | D&L | 0.33 [0.01 – 0.64] | 15 | 79 / 680,802 | D&L | 0.06 [0.02 – 0.11] |
| Poi | 0.75 [0.17 – 3.24] | Poi | 0.10 [0.02 – 0.42] | |||||
| Cardiac Deaths | 9 | 15 / 44,109 | D&L | 0.18 [0.00 – 0.46] | 11 | 23 / 517,696 | D&L | 0.02 [0.00 – 0.05] |
| Poi | 0.19 [0.02 – 2.4] | Poi | 0.02 [0.00 – 0.17 | |||||
Incidence [95% CI] was determined per 1,000 patients and per 1,000 ECT treatments using two random effects models. Studies reporting no AE stated that no adverse event occurred. D&L = DerSimonian and Laird model, Poi = poisson model, AE = Adverse Events, ECT = Electroconvulsive therapy, n = count, CI = confidence interval.
To determine whether the risk of cardiac events after ECT may be higher in patients with pre-existing cardiovascular disease, we performed several subgroup analyses that were restricted to patients with (or without) known cardiovascular disease (Tables 3 and 4).
Table 3.
Incidence of MACE associated with ECT in patients with pre-existing cardiovascular disease
| Patients | ECT treatments | ||||||||||
|---|---|---|---|---|---|---|---|---|---|---|---|
| Adverse events | Population | Studies (n) | Events / Patients | Incidence [95% CI] | I2 | Incidence [95% CI] | Studies (n) | Events / ECTs | Incidence [95% CI] | I2 | Incidence [95% CI] |
| D&L model | Poisson model | D&L model | Poisson model | ||||||||
| Myocardial infarction | No cardiac disease | 0 | - | - | - | - | 0 | - | - | - | - |
| General population | 6 | 12 / 3699 | 1.23 [0.00–3.10] | 29.7 % | 5.21 [1.35–20.05] | 6 | 10 / 24458 | 0.86 [0.00–1.84] | 40.5 % | 0.84 [0.25–2.86] | |
| Cardiac disease | 3 | 2 / 128 | 17.77 [0.00–44.56] | 0.0 % | 15.63 [3.91–62.48] | 3 | 2 / 1071 | 1.46 [0.00–4.62] | 0.0 % | 1.87 [0.47–7.5] | |
| Life-threatening arrhythmia | No cardiac disease | 6 | 7 / 169 | 30.79 [4.90–56.69] | 0.0 % | 41.42 [19.75–86.88] | 6 | 12 / 597 | 11.98 [2.66–21.30] | 9.9 % | 17.22 [7.57–39.17] |
| General population | 26 | 129 / 7342 | 12.44 [5.87–19.01] | 86.5 % | 21.87 [9.93–48.12] | 28 | 229 / 28754 | 0.73 [0.23–1.24] | 91.9 % | 3.92 [1.33–11.58] | |
| Cardiac disease | 7 | 10 / 243 | 29.83 [8.14–51.52] | 0.0 % | 41.15 [22.14–76.48] | 7 | 11 / 2787 | 1.93 [0.17–3.70] | 4.6 % | 4.13 [1.71–9.97] | |
| Acute pulmonary edema | No cardiac disease | 0 | - | - | - | - | 0 | - | - | - | - |
| General population | 3 | 7 / 1773 | 8.37 [0.00–22.64] | 64.2 % | 5.27 [0.85–32.79] | 3 | 7 / 4655 | 1.22 [0.22–2.23] | 0.0 % | 1.50 [0.72–3.15] | |
| Cardiac disease | 1 | 0 / 10 | 0.00 [0.00–212.9] | - | - | 1 | 0 / 20 | 0.00 [0.00–114.3] | - | ||
| Pulmonary embolism | No cardiac disease | 0 | - | - | - | - | 0 | - | - | - | - |
| General population | 1 | 1 / 1437 | 0.70 [0.00–2.06] | - | - | 1 | 1 / 1437 | 0.70 [0.00–2.06] | - | - | |
| Cardiac disease | 1 | 0 / 10 | 0.00 [0.00 � 212.9] | - | - | 1 | 0 / 20 | 0.00 [0.00–114.3] | - | - | |
| Acute heart failure | No cardiac disease | 0 | - | - | - | - | 0 | - | - | - | - |
| General population | 2 | 7 / 335 | 18.60 [4.15–33.05] | 0.0 % | 20.90 [9.96–43.83] | 2 | 7 / 3235 | 1.94 [0.42–3.45] | 0.0 % | 2.16 [1.03–4.54] | |
| Cardiac disease | 1 | 2 / 40 | 50.00 [0.00–117.5] | - | - | 1 | 2 / 452 | 4.42 [0.00–10.54] | - | - | |
| Cardiac arrest | No cardiac disease | 1 | 4 / 13 | 307.7 [56.80–558.6] | - | - | 1 | 4 / 110 | 36.36 [1.38–71.35] | - | - |
| General population | 6 | 52 / 51268 | 0.94 [0.06–1.81] | 78.4 % | 2.18 [0.45–10.67] | 6 | 52 / 297494 | 0.15 [0.02–0.27] | 78.9 % | 0.28 [0.07–1.17] | |
| Cardiac disease | 1 | 0 / 10 | 0.00 [0.00–212.9] | - | - | 1 | 0 / 20 | 0.00 [0.00–114.3] | - | - | |
Incidence [95% CI] was determined per 1,000 patients and per 1,000 ECT treatments. CI = confidence interval, D&L = DerSimonian and Laird, ECT= Electroconvulsive therapy, n = count.
Table 4.
Incidence of mortality after ECT in patients with pre-existing cardiovascular disease
| Patients | ECT treatments | ||||||||||
|---|---|---|---|---|---|---|---|---|---|---|---|
| Adverse events | Population | Studies (n) | Events / Patients | Incidence [95% CI] | I2 | Incidence [95% CI] | Studies (n) | Events / ECTs | Incidence [95% CI] | I2 | Incidence [95% CI] |
| D&L model | Poisson model | D&L model | Poisson model | ||||||||
| Studies reporting no AE included | |||||||||||
| All-cause Mortality | No cardiac disease | 13 | 0 / 889 | 0.00 [0.00–4.60] | 0.0% | - | 13 | 0 / 4926 | 0.00 [0.00–0.66} | 0.0% | - |
| General population | 26 | 49 / 74653 | 0.25 [0.00–0.50] | 40.9% | 0.54 [0.14–2.03] | 28 | 79 / 683066 | 0.06 [0.02–0.10] | 60.1% | 0.08 [0.02–0.30] | |
| Cardiac disease | 2 | 0 / 45 | 0.00 [0.00–64.26] | 0.0% | - | 2 | 0 / 533 | 0.00 [0.00–4.78] | 0.0% | - | |
| Cardiac Deaths | No cardiac disease | 13 | 0 / 889 | 0.00 [0.00–4.60] | 0.0% | - | 13 | 0 / 4926 | 0.00 [0.00–0.66] | 0.0% | - |
| General population | 22 | 15 / 44624 | 0.04 [0.00–0.15] | 0.0% | 0.15 [0.01–1.49] | 24 | 23 / 519960 | 0.01 [0.00–0.03] | 0.0% | 0.02 [0.00–0.14] | |
| Cardiac disease | 2 | 0 / 45 | 0.00 [0.00–64.26] | 0.0% | - | 2 | 0 / 533 | 0.00 [0.00–4.78] | 0.0% | - | |
| Studies reporting no AE excluded (sensitivity analysis) | |||||||||||
| All-cause Mortality | No cardiac disease | 0 | - | - | - | 0 | - | - | - | - | |
| General population | 11 | 49 / 74083 | 0.34 [0.02–0.66] | 76.4% | 0.80 [0.18–3.59] | 13 | 79 / 680269 | 0.07 [0.02–0.11] | 82.3% | 0.11 [0.02–0.47] | |
| Cardiac disease | 2 | 0 / 45 | 0.00 [0.00–64.26] | 0.0% | - | 2 | 0 / 533 | 0.00 [0.00–4.78] | 0.0% | - | |
| Cardiac Deaths | No cardiac disease | 0 | - | - | - | - | 0 | - | - | - | - |
| General population | 7 | 7 / 44064 | 0.20 [0.00–0.52] | 59.0% | 0.21 [0.02–2.78] | 9 | 23 / 517163 | 0.02 [0.00–0.05] | 59.6% | 0.02 [0.00–0.19] | |
| Cardiac disease | 2 | 0 / 45 | 0.00 [0.00–64.26] | 0.0% | - | 2 | 0 / 533 | 0.00 [0.00–4.78] | 0.0% | - | |
Incidence [95% CI] was determined per 1,000 patients and per 1,000 ECT treatments. Studies reporting no AE stated that no adverse event occurred. AE = Adverse Events, CI = confidence interval, D&L = DerSimonian and Laird, ECT = Electroconvulsive therapy, n = count.
Discussion
Results of this systematic review and meta-analysis show that an estimated 25.83 [14.83 – 45.00] per 1,000 patients (approximately 1 in 50 patients) develop major adverse cardiac events after ECT (2%). The risk based per ECT treatment is 4.66 [2.15 – 10.09] per 1,000 ECTs (approximately 1 MACE in 200 ECT treatments). These estimates are based on the Poisson model, which yield higher values in this case and wider confidence intervals. The reason why the risk per patient is proportionally higher than per ECT treatment is that most patients undergo a series of ECT treatments, and the procedure is likely terminated once a serious adverse event occurs.
The primary goal of this study was to capture all available published data reporting on cardiac events after ECT. We scanned the published literature from 1980 to the end of 2016 and retrieved 82 studies of varying degrees of quality and bias risk. Studies ranged from surveys that were sent out to practitioners to rigorous prospective cohort studies. We decided a priori to exclude studies that did not mention adverse events at all (neither absence nor presence). If studies mentioned that no adverse events occurred, they were included in the meta-analysis for mortality – since we assessed the risk of having missed a death to be low –, but not in the meta-analysis for individual major adverse cardiac events, since we deemed the risk too high. The sensitivity analysis was restricted to studies that definitively reported individual major adverse cardiac events and excluded 13 studies that mentioned only that no adverse events occurred. The mortality rate per patient in the sensitivity analysis increased 3-fold but was similar when analyzed per ECT treatment.
Our analysis obtained robust sample sizes that ranged from several hundred patients to more than 50,000 and from a few 1,000 to nearly 300,000 ECT treatments for individual major adverse cardiac events. For mortality estimates, pooled sample sizes included more than 75,000 patients and more than 680,000 treatments. Sample size of that magnitude provide robust estimates that approximate population-level incidence rates. Indeed, a recent population based study11 determined an all-cause mortality rate of 0.04 and 0.24 per 1,000 ECTs within 1 and 7 days of an ECT treatment similar to our finding of 0.04 – 0.10 per 1,000 ECTs. Also, they determined an event rate of about 0.05 for arrhythmia and 0.1 for myocardial infarction per 1,000 ECTs corresponding to the 0.87 and 0.77 we found in the D&L models.
Clinical implications
Despite the low frequency of major cardiac events after ECT, the question should be addressed if these events may be preventable or not. In two prospective cohort studies, Duma and colleagues and Martinez and colleagues showed that in about 5 – 10% of ECT treatments, patients develop cardiac troponin elevation, which indicates myocardial cell damage.16,17 Cardiovascular stress during ECT is of short duration and may be prevented by administration of short-acting drugs, such as beta-blockers.3,18–23
Limitations
Systematic reviews can only pool available evidence and strongly relies on the quality of the underlying data. In our study, the quality of data was mixed. Several studies were prospectively designed with rigorous outcomes assessment; other studies were either surveys or retrospective database analyses with a significant risk of missed events. Considerable heterogeneity was found in the meta-analysis of several outcomes. Possible explanations for the heterogeneity may include the differences in design and duration of follow-up as well as uncaptured differences in patient characteristics and periprocedural management. The majority of studies were not restricted to patients with cardiac disease, so it was difficult assess a potential risk increase in patients with pre-existing cardiovascular disease. Therefore, the results of this study may over- or underestimate the true incidence rate of cardiac events after ECT. Second, deaths may occur after ECT due to many other factors and may only be temporally observed but not causally related to the ECT treatment. Third, risk of selection bias due to the exclusion of publications other than English or German exists. The excluded Japanese, Spanish, Polish, Persian, and Chinese literature reported a total of 620 patients and 2850 ECT treatments. This was 0.6% (620/106,569 patients) and 0.4% (2850/786,995 ECT treatments) of our analyzed population and therefore bears a low risk of selection bias. Finally, the per ECT treatment analyses effectively assume that repeated measurements (trials) on the same subject are independent. That may or may not be true, and since we did not have patient-level data, we cannot evaluate that assumption.
In conclusion, this systematic review and meta-analysis show that major adverse cardiac events after ECT are infrequent and occur in about one in 50 patients and after about one in 200 – 500 ECT treatments.
Supplementary Material
Acknowledgments:
not applicable
Funding Statement: This study was conducted with departmental funds only. Dr. Nagele is currently supported by NIH/NHLBI (R01HL126892), NIH/NIMH (1R21MH108901, both Bethesda, Maryland), the American Foundation for the Prevention of Suicide (New York, NY), the Brain and Behavior Foundation (NARSAD, New York, NY), and the Stanley Medical Research Institute (Kensington, MD).
Footnotes
Conflicts of Interest: PN reports receiving research grants and other research support from Roche Diagnostics (Indianapolis, IN); and research grants and other research support from Abbott Diagnostics (Abbott Park, IL). All other authors declare no competing interests.
Clinical trial number and registry URL: not applicable
Prior Presentations: Part of this work was presented on October 21, 2017 at the American Society of Anesthesiologists Annual Meeting in Boston (Anesthesiology 2017: A1093).
Summary Statement: Major adverse cardiac events and death after ECT are infrequent and occur in about one in 50 patients and after about one in 200 – 500 ECT treatments
References
- 1.Greenberg RM, Kellner CH: Electroconvulsive therapy: a selected review. Am J Geriatr Psychiatry 2005; 13: 268–81 [DOI] [PubMed] [Google Scholar]
- 2.Tess AV, Smetana GW: Medical evaluation of patients undergoing electroconvulsive therapy. N Engl J Med 2009; 360: 1437–44 [DOI] [PubMed] [Google Scholar]
- 3.O’Flaherty D, Husain MM, Moore M, Wolff TR, Sills S, Giesecke AH: Circulatory responses during electroconvulsive therapy. The comparative effects of placebo, esmolol and nitroglycerin. Anaesthesia 1992; 47: 563–7 [DOI] [PubMed] [Google Scholar]
- 4.Messina AG, Paranicas M, Katz B, Markowitz J, Yao FS, Devereux RB: Effect of electroconvulsive therapy on the electrocardiogram and echocardiogram. Anesth Analg 1992; 75: 511–4 [DOI] [PubMed] [Google Scholar]
- 5.Zhu WX, Olson DE, Karon BL, Tajik AJ: Myocardial stunning after electroconvulsive therapy. Ann Intern Med 1992; 117: 914–5 [DOI] [PubMed] [Google Scholar]
- 6.Beach SR, Wichman CL, Canterbury RJ: Takotsubo cardiomyopathy after electroconvulsive therapy. Psychosomatics 2010; 51: 432–6 [DOI] [PubMed] [Google Scholar]
- 7.McCall WV: Asystole in electroconvulsive therapy: Report of four cases. J Clin Psychiatry 1996; 57: 199–203 [PubMed] [Google Scholar]
- 8.Watts BV, Groft A, Bagian JP, Mills PD: An examination of mortality and other adverse events related to electroconvulsive therapy using a national adverse event report system. J ECT 2011; 27: 105–8 [DOI] [PubMed] [Google Scholar]
- 9.Dennis NM, Dennis PA, Shafer A, Weiner RD, Husain MM: Electroconvulsive Therapy and All-Cause Mortality in Texas, 1998–2013. J ECT 2017; 33: 22–25 [DOI] [PubMed] [Google Scholar]
- 10.Nuttall GA, Bowersox MR, Douglass SB, McDonald J, Rasmussen LJ, Decker PA, Oliver WC Jr., Rasmussen KG: Morbidity and mortality in the use of electroconvulsive therapy. J ECT 2004; 20: 237–41 [DOI] [PubMed] [Google Scholar]
- 11.Blumberger DM, Seitz DP, Herrmann N, Kirkham JG, Ng R, Reimer C, Kurdyak P, Gruneir A, Rapoport MJ, Daskalakis ZJ, Mulsant BH, Vigod SN: Low medical morbidity and mortality after acute courses of electroconvulsive therapy in a population-based sample. Acta Psychiatr Scand 2017; 136: 583–593 [DOI] [PubMed] [Google Scholar]
- 12.Torring N, Sanghani SN, Petrides G, Kellner CH, Ostergaard SD: The mortality rate of electroconvulsive therapy: a systematic review and pooled analysis. Acta Psychiatr Scand 2017; 135: 388–397 [DOI] [PubMed] [Google Scholar]
- 13.Chou R, Aronson N, Atkins D, Ismaila AS, Santaguida P, Smith DH, Whitlock E, Wilt TJ, Moher D: AHRQ series paper 4: assessing harms when comparing medical interventions: AHRQ and the effective health-care program. J Clin Epidemiol 2010; 63: 502–12 [DOI] [PubMed] [Google Scholar]
- 14.Brown LD, Cai TT, DasGupta A: Interval Estimation for a Binomial Proportion. Statist. Sci. 2001; 16: 101–133 [Google Scholar]
- 15.Spittal MJ, Pirkis J, Gurrin LC: Meta-analysis of incidence rate data in the presence of zero events. BMC Med Res Methodol 2015; 15: 42. [DOI] [PMC free article] [PubMed] [Google Scholar]
- 16.Duma A, Pal S, Johnston J, Helwani MA, Bhat A, Gill B, Rosenkvist J, Cartmill C, Brown F, Miller JP, Scott MG, Sanchez-Conde F, Jarvis M, Farber NB, Zorumski CF, Conway C, Nagele P: High-sensitivity Cardiac Troponin Elevation after Electroconvulsive Therapy: A Prospective, Observational Cohort Study. Anesthesiology 2017; 126: 643–652 [DOI] [PMC free article] [PubMed] [Google Scholar]
- 17.Martinez MW, Rasmussen KG, Mueller PS, Jaffe AS: Troponin elevations after electroconvulsive therapy: the need for caution. Am J Med 2011; 124: 229–34 [DOI] [PubMed] [Google Scholar]
- 18.Boere E, Birkenhager TK, Groenland TH, van den Broek WW: Beta-blocking agents during electroconvulsive therapy: a review. Br J Anaesth 2014; 113: 43–51 [DOI] [PubMed] [Google Scholar]
- 19.Castelli I, Steiner LA, Kaufmann MA, Alfille PH, Schouten R, Welch CA, Drop LJ: Comparative effects of esmolol and labetalol to attenuate hyperdynamic states after electroconvulsive therapy. Anesth Analg 1995; 80: 557–61 [DOI] [PubMed] [Google Scholar]
- 20.Howie MB, Black HA, Zvara D, McSweeney TD, Martin DJ, Coffman JA: Esmolol reduces autonomic hypersensitivity and length of seizures induced by electroconvulsive therapy. Anesth Analg 1990; 71: 384–8 [DOI] [PubMed] [Google Scholar]
- 21.Zhang Y, White PF, Thornton L, Perdue L, Downing M: The use of nicardipine for electroconvulsive therapy: a dose-ranging study. Anesth Analg 2005; 100: 378–81 [DOI] [PubMed] [Google Scholar]
- 22.Zvara DA, Brooker RF, McCall WV, Foreman AS, Hewitt C, Murphy BA, Royster RL: The effect of esmolol on ST-segment depression and arrhythmias after electroconvulsive therapy. Convuls Ther 1997; 13: 165–74 [PubMed] [Google Scholar]
- 23.Aydogan MS, Yucel A, Begec Z, Colak YZ, Durmus M: The hemodynamic effects of dexmedetomidine and esmolol in electroconvulsive therapy: a retrospective comparison. J ECT 2013; 29: 308–11 [DOI] [PubMed] [Google Scholar]
Associated Data
This section collects any data citations, data availability statements, or supplementary materials included in this article.