Abstract
Purpose
Indirect‐detection CMOS flat‐panel detectors (FPDs) offer fine pixel pitch, fast readout, and low electronic noise in comparison to current a‐Si:H FPDs. This work investigates the extent to which these potential advantages affect imaging performance in mobile C‐arm fluoroscopy and cone‐beam CT (CBCT).
Methods
FPDs based on CMOS (Xineos 3030HS, 0.151 mm pixel pitch) or a‐Si:H (PaxScan 3030X, 0.194 mm pixel pitch) sensors were outfitted on equivalent mobile C‐arms for fluoroscopy and CBCT. Technical assessment of 2D and 3D imaging performance included measurement of electronic noise, gain, lag, modulation transfer function (MTF), noise‐power spectrum (NPS), detective quantum efficiency (DQE), and noise‐equivalent quanta (NEQ) in fluoroscopy (with entrance air kerma ranging 5–800 nGy per frame) and cone‐beam CT (with weighted CT dose index, CTDI w, ranging 0.08–1 mGy). Image quality was evaluated by clinicians in vascular, orthopaedic, and neurological surgery in realistic interventional scenarios with cadaver subjects emulating a variety of 2D and 3D imaging tasks.
Results
The CMOS FPD exhibited ~2–3× lower electronic noise and ~7× lower image lag than the a‐Si:H FPD. The 2D (projection) DQE was superior for CMOS at ≤50 nGy per frame, especially at high spatial frequencies (~2% improvement at 0.5 mm−1 and ≥50% improvement at 2.3 mm−1) and was somewhat inferior at moderate‐high doses (up to 18% lower DQE for CMOS at 0.5 mm−1). For smooth CBCT reconstructions (low‐frequency imaging tasks), CMOS exhibited ~10%–20% higher NEQ (at 0.1–0.5 mm−1) at the lowest dose levels (CTDI w ≤0.1 mGy), while the a‐Si:H system yielded slightly (~5%) improved NEQ (at 0.1–0.5 lp/mm) at higher dose levels (CTDI w ≥0.6 mGy). For sharp CBCT reconstructions (high‐frequency imaging tasks), NEQ was ~32% higher above 1 mm−1 for the CMOS system at mid‐high‐dose levels and ≥75% higher at the lowest dose levels (CTDI w ≤0.1 mGy). Observer assessment of 2D and 3D cadaver images corroborated the objective metrics with respect to a variety of pertinent interventional imaging tasks.
Conclusion
Measurements of image noise, spatial resolution, DQE, and NEQ indicate improved low‐dose performance for the CMOS‐based system, particularly at lower doses and higher spatial frequencies. Assessment in realistic imaging scenarios confirmed improved visibility of fine details in low‐dose fluoroscopy and CBCT. The results quantitate the extent to which CMOS detectors improve mobile C‐arm imaging performance, especially in 2D and 3D imaging scenarios involving high‐resolution tasks and low‐dose conditions.
Keywords: amorphous silicon, C‐arm, CMOS, cone‐beam CT , DQE, flat‐panel detector, fluoroscopy, image‐guided procedures, NEQ, NPS, spatial resolution, technical assessment
1. Introduction
Over the past two decades, hydrogenated amorphous silicon (a‐Si:H) flat‐panel detectors (FPDs) based on active matrix thin‐film transistor (TFT) arrays have emerged as a base technology for digital x ray imaging. For general radiography, fluoroscopy, and cone‐beam CT (CBCT), indirect‐detection a‐Si:H FPDs with a structured cesium iodide (CsI:Tl) scintillator have become prevalent in clinical use. A variety of challenges persist, however, including performance at very low‐dose levels1, 2 and applications requiring high spatial resolution.3
One notable limitation of the current generation of a‐Si:H FPDs is the relatively high level of electronic noise that becomes an important factor at low exposure levels — for example, <0.01 mR per frame (<90 nGy per frame),1, 2, 4 in the transition from quantum‐limited to electronic noise‐limited performance. Methods to improve the low‐dose performance of a‐Si:H FPDs have been proposed, including reduction in additive electronic noise and/or increase in system gain.2 One such method incorporates on‐pixel gain (e.g., active pixel architecture) to amplify the signal from incident x rays prior to the addition of readout line, amplifier, and digitization noise.2 Ongoing research with such active pixel architectures seeks to overcome challenges in spatial resolution, fill factor, dark current, lag, large‐area fabrication, and yield.5, 6
Recently, complementary metal oxide semiconductor (CMOS) sensors have emerged with FOV suitable to clinical applications7, 8, 9 requiring a large‐area detector. As with indirect‐detection a‐Si:H FPDs, CMOS‐based FPDs use a CsI:Tl scintillator to convert incident x rays into visible photons and a photodiode to convert visible photons into electrons for subsequent readout. CMOS technology offers a variety of potential advantages in material characteristics over a‐Si:H, including lower dark current (reduced electronic noise), higher charge mobility (lower image lag and higher frame rate), and fabrication with finer pixel pitch compared to current a‐Si:H active matrix FPDs.10 These improvements present an opportunity to overcome many of the limitations in imaging performance mentioned above for the current generation of a‐Si:H detectors.
Previous work has reported performance advantages of CMOS technology in breast imaging, such as breast CBCT and digital breast tomosynthesis (DBT). In breast CBCT, Shen et al.11 showed a 45% improvement in visibility of small microcalcifications and enhanced visibility of large microcalcifications at low exposure levels compared to conventional a‐Si:H FPDs. Patel et al.9 demonstrated quantum‐limited behavior in a CMOS FPD at low‐dose levels, thereby allowing improved angular sampling in DBT by lowering the dose per frame. A study by Zhao et al.7 demonstrated that a CMOS‐based DBT system was capable of distinguishing small microcalcifications (0.165 mm) at a mean glandular dose 27% lower than in DBT using an a‐Si:H FPD.
Such performance advantages observed in breast imaging may translate to other applications and imaging tasks. The work reported below aims to evaluate the performance of CMOS detectors in interventional imaging on mobile C‐arms, assessing both 2D and 3D imaging characteristics with an emphasis on scenarios of low‐dose imaging and/or tasks requiring high spatial resolution. Two identical mobile C‐arms were outfitted with an a‐Si:H and a CMOS detector, respectively, and imaging performance was investigated in head‐to‐head characterization of each system. The experiments extend from objective technical assessment of spatial resolution and noise to performance evaluation in cadaver studies emulating orthopaedic trauma surgery, neurosurgery, and vascular surgery/interventional radiology.
2. Materials and methods
2.A. Mobile C‐Arms for 2D and 3D Imaging
2.A.1. Indirect‐detection a‐Si:H and CMOS FPDs
Detector characteristics, imaging techniques, and reconstruction parameters are summarized in Tables 1, 2, 3. A PaxScan 3030X (Varex, Salt Lake City, UT, USA) a‐Si:H based FPD and a Xineos 3030HS (Teledyne Dalsa, Waterloo, ON, Canada) CMOS based FPD were used. In studies reported below, the former is referred to as the “a‐Si:H” detector, and the latter as the “CMOS” detector. Both the a‐Si:H and CMOS detector incorporated a 600 μm thick CsI:Tl scintillator. For the a‐Si:H FPD, the scintillator was directly deposited on the sensor array, whereas for the CMOS FPD, coupling of the CsI:Tl to the sensor array was achieved via a fiber optic plate (FOP), providing both optical coupling to the sensor and limiting radiation damage to the CMOS electronics (by absorption in the FOP).
Table 1.
Summary of detector characteristics
| Detector characteristics | a‐Si:H | CMOS |
|---|---|---|
| Model | PaxScan 3030X | Xineos 3030HS |
| Manufacturer | Varex | Dalsa |
| Scintillator | 600 μm CsI:Tl | |
| Pixel pitch (Native) | 0.194 mm | 0.151 mm |
| Pixel pitch (2 × 2 Binning) | 0.388 mm | 0.302 mm |
| Active area | 298 × 298 mm2 | 295 × 295 mm2 |
| Gain modes |
LG: Low Gain HG: High Gain |
LG: High FWC HG: Low FWC |
| A/D bit depth | 16 | |
| Max frame rate (1 × 1) | 15 fps | 14 fps |
| Max frame rate (2 × 2) | 30 fps | 57 fps |
| Electronic noise (LG) | ~2410 e‐ rms | ~1000 e‐ rms |
| Electronic noise (HG) | ~1310 e‐ rms | ~430 e‐ rms |
| Sensitivity (LG or HG) | 20 × 106 e−/mAs/pixel | 11 × 106 e−/mAs/pixel |
Table 2.
Summary of 2D and 3D imaging techniques
| Image acquisition parameters | 2D Imaging | 3D Imaging |
|---|---|---|
| Tube voltage (Nominal) | 100 kV + 0.1 mm Cu + 3 mm Al | |
| Additional attenuation | 4.5 mm Cu | 1.7 mm Cu + 16 cm Acrylic Cylinder |
| HVL | 6.1 mm Al | |
| Fluence/Kerma (Φ/KA) | 2.89 × 10⁵ x rays/μGy/mm2 | |
| X ray tube output | 0.015–0.235 mAs | |
| Frame rate (Nominal) | 15 fps | |
| SDD | 110 cm | |
| Tube output (@SDD) | 0.34 µGy/mAs | 0.25 µGy/mAs/view |
| Projections/Arc | – | 280–560 proj/360° |
| CTDIw (16 cm acrylic) | – | 0.01–0.02 mGy/mAs |
Table 3.
Summary of 3D reconstruction parameters
| 3D Image Recon | a‐Si:H | CMOS |
|---|---|---|
| Smooth Recona: a vox | 0.5 mm isotropic | |
| Smooth Recona: fcutoff | 0.59 mm−1 | |
| Sharp Recon: a vpx | 0.23 mm isotropic | 0.18 mm isotropic |
| Sharp Recon: fcutoff | 1.28 mm−1 | 1.67 mm−1 |
Adjusted to match spatial resolution between the two systems.
Both detectors provided two readout modes with different sensitivity, denoted as low gain (LG) or high gain (HG). In the a‐Si:H FPD, the sensitivity is controlled by adjusting the analog gain of the integrating amplifier prior to quantization.2, 12 Sensitivity of the CMOS detector is controlled by switchable in‐pixel capacitance — that is, high full‐well capacitance (FWC) and low FWC for LG and HG, respectively. The HG modes combine lower signal capacitance with lower readout noise than the LG modes; therefore, HG modes are better suited to low‐dose imaging scenarios and/or in thick/dense anatomy. The higher capacitance of LG modes is advantageous when a wide dynamic range is needed — for example, when both deep tissues and the periphery/skin line must both be resolved without sensor saturation.
Each panel covered an active area of ~30 × 30 cm2. The native pixel pitch was 0.194 mm for a‐Si:H and 0.151 mm for CMOS. Both panels supported 2 × 2 pixel binning. Fluoroscopic imaging performance was assessed for both 1 × 1 and 2 × 2 binning modes. Projection data for CBCT image reconstruction were collected only in the 2 × 2 binning mode. Nominal frame rate in 1 × 1 mode was 14 and 15 fps for the CMOS and a‐Si:H detectors, respectively, and 57 and 30 fps in 2 × 2 mode. For the studies reported below, readout rate was matched and held fixed for the two systems (30 fps for 2D fluoroscopy and 15 fps for 3D CBCT).
2.A.2. Mobile C‐arms
Two mobile C‐arm prototypes (Cios Alpha, Siemens Healthineers, Forcheim, Germany), shown in Fig. 1, served as the basis for detector performance evaluation. Each system has an identical x ray tube, generator, and motorized gantry. Key characteristics of the C‐arms include: 25 kW generator, rotating anode x ray tube, nominal focal spot size of 0.5 FS, and source‐detector distance (SDD) of 110 cm. While the Cios Alpha systems are not capable of CBCT in their commercially available, clinical embodiment, each was modified to perform CBCT through angular rotation (Fig. 1) under computer control. CBCT imaging involved pulsed x ray exposures and continuous gantry motion.
Figure 1.
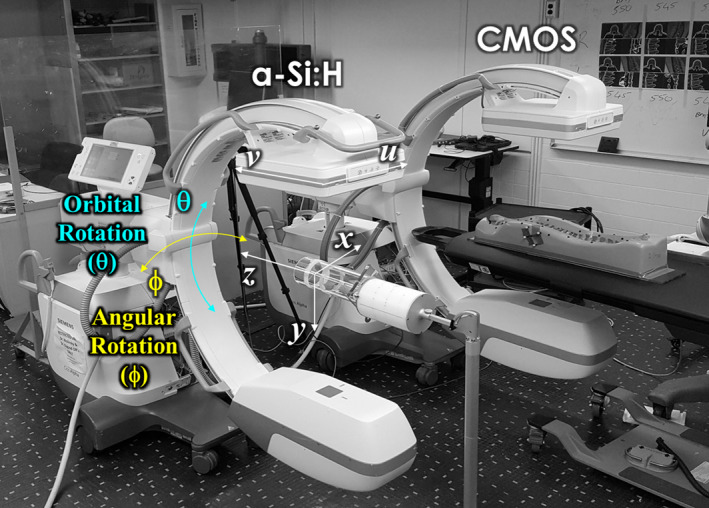
Experimental setup. Mobile C‐arms for 2D and 3D imaging. The systems were identical except for the detector type – that is, a‐Si:H or CMOS FPDs. [Color figure can be viewed at wileyonlinelibrary.com]
2.B. Image acquisition and processing
2.B.1. X ray beam quality and dose
All dose and beam quality measurements reported below were performed with the Accu‐Pro 9096 dosimeter (RadCal Corp., Monrovia, CA, USA). For 2D imaging, radiation dose was characterized in terms of air kerma measured at the entrance of the detector surface (EAK) with a 60 cc ionization chamber (RadCal 10 × 6–60). The EAK reported here is therefore the dose at the detector (which is pertinent to studies of image noise, etc.), but is distinct from commonly reported “reference point” EAK (which is measured at 15 cm from isocenter and relates to EAK at the entrance to the patient). For CBCT, dose was evaluated in terms of weighted CTDI (CTDIw) in a 16 cm diameter PMMA CTDI phantom. CTDIw was calculated as the weighted sum of the (1/3 ×) central and (2/3 ×) peripheral air kerma measured with a 0.6 cc Farmer ionization chamber (RadCal 10 × 6–0.6).13
Imaging studies were performed at 100 kV and 5 ms pulse width, with tube current ranging 3–47 mA. Neither system used a bowtie filter or antiscatter grid. Added filtration was varied between experiments to achieve dose levels corresponding to various 2D and 3D imaging conditions, summarized below.
Noise and detective quantum efficiency (DQE) in 2D imaging were measured with added filtration of 4.5 mm Cu. The resulting EAK ranged from 5 to 80 nGy/frame, emulating the low‐dose fluoroscopy range, EAK ~10–70 nGy.14 (Note that Mahesh et al.14 report Entrance Skin Dose [ESD], and detector EAK values were estimated from ESD assuming a standard abdomen at isocenter.)
For 2D imaging/fluoroscopy, measurements of detector gain, modulation transfer function (MTF), and lag were performed with an RQA815 beam (half value layer [HVL] = 10.1 mm Al), which was achieved using added filtration of 0.75 mm Cu.
For CBCT, measurements of noise and NEQ were obtained with 1.7 mm Cu added filtration, yielding a range in CTDIw of ~0.1–0.6 mGy. Cadaver imaging was performed without added filtration with a range in CTDIw of ~1–4 mGy, corresponding to the low‐dose regime (CTDIw ≤2 mGy) for C‐arm based CBCT as reported in Daly et al.13 and Schafer et al.16
2.B.2. 2D image pre‐processing
Fluoroscopic images (and 2D projection views acquired for CBCT scans) were pre‐processed using standard dark and flat‐field correction to remove fixed pattern noise. Pixels identified as defective (based on aberrant mean or standard deviation in offset signal value or gain) were median‐filtered based on nearest neighbors.
2.B.3. 3D image reconstruction
CBCT involved collection of 250 or 500 projections over a 333° arc with reconstruction using the Feldkamp‐Davis‐Kress (FDK) algorithm for 3D filtered backprojection.17 Bare beam (I0) normalization was based on the mean signal in an unattenuated region of the detector. At dose levels for which detector nonlinearity or saturation effects appear, I0 was estimated by linearly extrapolating from pre‐calibrated bare beam values within the linear operating range of the detector. For low exposure conditions, pixel values measuring less than or equal to zero were replaced with a small positive value prior to log correction. To eliminate systematic differences in Hounsfield Unit (HU) output between the systems, a two‐point HU normalization (air and water) was computed.
CBCT image reconstruction used “Smooth” or “Sharp” protocols differing in voxel size and cutoff frequency of the apodization filter. The “Smooth” protocol matched the spatial resolution characteristics of the two systems to provide a fair comparison of noise in imaging of low‐contrast structures. “Smooth” reconstruction was performed at 0.5 mm isotropic voxel size using a filter with the same cutoff frequency for both systems (0.59 mm−1, corresponding to the Nyquist frequency of the voxel grid for system magnification of 1.7). The filter was implemented as a ramp apodized by a Hann window applied along the rows of the projection data, with the same Hann window applied along the columns of the projection data to provide isotropic 2D apodization.
“Sharp” reconstruction emphasized the high‐contrast spatial resolution characteristics of each system. Reconstructions were performed at a voxel size equal to the de‐magnified pixel size to better depict the spatial resolution capabilities of each system, yielding voxel size (a vox ) of 0.23 mm for the a‐Si:H system and 0.18 mm for the CMOS system. The cutoff frequencies were set to the Nyquist frequency of each detector (1.28 mm−1 for a‐Si:H and 1.67 mm−1 for CMOS) using a Hann apodization filter (along both columns and rows). A summary of reconstruction parameters is in Table 3.
2.C. 2D imaging performance: Radiography/fluoroscopy
2.C.1. Readout noise
Readout noise was measured by analyzing the standard deviation in repeated readout of individual pixels in a series of 100 dark images. The readout noise was measured for each gain mode as a function of frame rate (ranging 0.5–30 fps) to examine the impact of dark current shot noise in each system. The measured pixel dark noise was converted from analog‐to‐digital units (ADU) to root mean square (rms) electrons using the system gain (e−/ADU and ADU/incident x ray) as described below.
2.C.2. Gain
The system gain (alternatively, sensitivity) was measured for each gain mode (LG and HG) by averaging 100 offset‐corrected flat‐field images about a central ROI over a range of dose levels (RQA8 beam) and calculating the slope of the signal response over the linear region. The units of are [ADU/KA/pixel], where is air kerma. The digital conversion ratio (ADU/e‐) was determined from a linear cascaded systems model:1
| (1) |
where is the fluence per unit air kerma, is the photosensitive area per pixel (mm2), and is the quantum gain (e−/incident x ray). The Spektr v3.0 x ray beam simulation software18 based on the TASMICS algorithm19 was used to compute . Spektr was tuned based on the measured RQA8 beam described in Section 2.B.1. The quantum gain () was obtained from a cascaded systems model of three gain stages: quantum detection efficiency (QDE) of the scintillator, scintillator light yield, and coupling efficiency as described in Cao et al.20 The model was calibrated for both systems using the input x ray spectrum of the RQA8 beam and system geometry described above to estimate each gain stage for a 600 μm thick CsI:Tl scintillator. As reported previously for CMOS detectors employing a FOP,7, 20 the model assumed a lower coupling efficiency for the CMOS system (~0.55) compared to the a‐Si:H system (~0.80). Using Eq. (1) and the measured yielded the digital conversion ratio, which was used to convert signal output from arbitrary units (ADU) to units of electrons, thereby allowing comparison of readout noise in the same units.
2.C.3. Image lag
Image lag was measured from the falling‐edge temporal response of the detector, whereby ~50 flat field images (RQA8 beam) were collected followed by 100 dark images. The lag for the nth frame after the falling edge was computed as:
| (2) |
where , , and represent the pixel signal at frame n (n > 0 for the falling‐edge response), the mean pixel signal in flat‐field irradiation (n <= 0), and the mean pixel value at equilibrium in the absence of x ray irradiation ( ≫ 0), respectively. The image lag was measured as the average over ≥5 × 105 pixels as a function of mAs and frame rate.
2.C.4. Pre‐sampling MTF
Pre‐sampling MTF (pMTF) was obtained from an edge‐spread function (ESF) measured using a 0.5 cm thick tungsten plate with a precision‐machined straight edge placed at a slight angle on the surface of the detector at the center of the FOV. An oversampled ESF was obtained by aligning 1D edge‐spread profiles along the length of the edge and resampling to a fixed bin size of 0.05 mm. Low‐frequency effects were detrended by subtracting a linear fit of the ESF tails. The oversampled line‐spread function (LSF) was then obtained by taking the discrete derivative of the oversampled ESF, and the pMTF was estimated as the modulus of the Fourier transform of the LSF. The pMTF was normalized by its zero frequency value and corrected for the interpolation filter applied during resampling to give the final pMTF. In this study, the pMTF was found to be the same (within experimental error) along rows and columns of each detector and were therefore reported as the average of the two. Measurements were performed at an exposure corresponding to ~50% sensor saturation (and assumed independent of exposure).
2.C.5. Normalized NPS
A series of 100 flat‐field frames were acquired, corrected to remove gain‐offset fixed pattern variations, and detrended to zero mean by subtraction of a 2D polynomial surface fit. By sweeping a 256 × 256 region of interest (ROI) in each image, an ensemble (>1000) of 256 pixel × 256 pixel ROIs (denoted ) was generated for noise‐power spectrum (NPS) estimation. The NPS is defined21 as:
| (3) |
where and are spatial frequencies corresponding to and directions, respectively, and are the pixel pitch in and directions, and are the ROI size in pixels in and , and is the ensemble size. Normalized NPS (NNPS) was obtained by dividing the NPS by the square of the mean signal. 1D NNPS profiles along the row and column directions were averaged to yield the final 1D NNPS.4, 21 For both systems, the NNPS was measured as a function of EAK for each gain mode and binning mode.
2.C.6. Detective quantum efficiency
The DQE is defined as:
| (4) |
where the is the same as used in the NNPS measurement. The DQE was evaluated as a function of over a range of dose levels for which the system was limited by quantum noise or electronic noise. Furthermore, the DQE was measured for each gain mode for both systems in both the 1 × 1 and 2 × 2 binning modes.
2.D. 3D imaging performance: Cone‐Beam CT
Characterization of 3D imaging performance in CBCT focused on aspects of spatial resolution and noise, particularly spatial‐frequency dependent characteristics. Other measures, such as uniformity and HU linearity, were evaluated, found to be similar, and are not shown for brevity.
2.D.1. MTF in CBCT
The MTF was characterized in the axial plane of CBCT reconstructions of a thin (0.13 mm diameter) tungsten wire suspended in air at a slight angle to the longitudinal () axis.22 Images were acquired at nominal technique (100 kV, 75 mAs, 500 projections) and reconstructed using both the “Smooth” and “Sharp” protocols on each system (Tables 2 and 3). Radon transforms in the or directions were obtained for a series of contiguous slices to generate a series of LSF profiles. Each LSF profile was fit with a Gaussian and shifted to a common centroid to generate an oversampled LSF. The LSF was resampled to a uniformly spaced grid with spacing or (typically 0.05 mm with linear interpolation), and the spread function was detrended using a second‐order polynomial fit to the background to reduce non‐uniformity. The pMTF was then computed as the modulus of the FFT of the LSF, normalized to 1 at zero frequency, and corrected by (divided by) the interpolation filter applied during resampling.
2.D.2. Contrast‐to‐noise ratio
The contrast, noise, and contrast‐to‐noise ratio (CNR) were assessed in CBCT images as a function of dose using a head phantom containing a selection of 1.3 cm diameter inserts of varying electron density. Measurements focused on low‐contrast (~100 HU) inserts and “Smooth” reconstruction protocols for each system. The CNR of a particular insert was:
| (5) |
where is the average voxel value of an ROI within the insert, is the average voxel value of an ROI within the adjacent background, is the standard deviation of the insert ROI, and is the standard deviation of the background ROI. The denominator of Eq. (5) reflects the pertinent noise term associated with aggregate of two random distributions under the assumption of small signal difference (i.e., low contrast) between the insert and background. The ROIs were selected to be approximately the same size and at the same distance from the center of reconstruction to reduce the influence of (radially symmetric) background shading.
2.D.3. 3D NPS
The 3D NPS was measured using a 16 cm diameter acrylic cylinder reconstructed using “Smooth” and “Sharp” protocols. Two scans were obtained at each dose level and subtracted to ield a noise‐only volume (denoted Δμ). The 3D NPS was calculated21 from an ensemble formed from ≥75 ROIs (64 × 64 × 64 voxels) selected at fixed distance from the center of reconstruction and at fixed distance from the z axis. The 3D NPS is:
| (6) |
where are spatial frequencies corresponding to , and directions, respectively, and are the voxel lengths in, and , and are the ROI size in voxels in , and , and is the number of ROIs in the ensemble. The factor of 2 accounts for the doubling of variance from the image subtraction step. For purposes of display, the 3D NPS was radially averaged to yield a 1D representation of the axial NPS. Similarly, a 1D representation of NPS() was taken as the circumferential average on a cylindrical shell parallel to the axis at radius given by the frequency at which the axial NPS peaks.23
2.D.4. 3D NEQ
The 3D NEQ was computed from the MTF and NPS as:
| (7) |
where is the magnitude of the spatial‐frequency vector , the 3D MTF was taken as the axial plane MTF (Section 2.D.1.) with an assumption of isotropic 3D radial symmetry, and the 3D NPS is that from Section 2.D.3. 1D representations of NPS() and NPS() were obtained by radial and circumferential average, respectively, as in Section 2.D.3. The NEQ was analyzed for images acquired in both gain modes over the same dose range as the 3D NPS and for both reconstruction protocols (Tables 1, 2, 3).
2.E. Cadaver studies
Pre‐clinical evaluation of 2D and 3D image quality was performed using three fresh cadavers (each male of medium body habitus) imaged with respect to a variety of simulated clinical tasks. Fluoroscopic images were acquired in HG mode at 100 kV, 3–6 mA tube current, and 30 fps (2 × 2 binning). Radiographs (distinguished from fluoroscopy as a single frame at higher mAs) were retrospectively processed by frame averaging a given fluoroscopic series to an equivalent of 0.5–1.0 mAs. CBCT images were acquired in HG mode at 100 kV, 3–47 mA tube current, and reconstructed with either the “Smooth” or “Sharp” protocols as relevant to a particular imaging task or structure of interest. A variety of anatomical sites were imaged with and without interventional devices, emulating procedures in orthopaedic surgery, neurosurgery, and vascular interventions. The images were qualitatively evaluated by a fellowship‐trained radiologist with respect to pertinent imaging tasks in visualization of anatomy and/or interventional devices. The current cadaver studies aim to illustrate how differences in the MTF, NPS, DQE, and/or NEQ as characterized above translate qualitatively to visual image quality. Future work will involve a more quantitative multi‐reader study assessing task performance.
Cadaver studies simulating C‐arm imaging in orthopaedic/trauma surgery included fluoroscopy and CBCT guidance/verification of device placement and fracture reduction. Interventional tools included Kirschner wires (K‐wires) and surgical screws. Anatomical sites included the acromioclavicular (AC) shoulder joint, femoral neck, sacroiliac joint, and joints of the ankle. For each site, fluoroscopic series were collected during K‐wire/screw deployment by a fellowship‐trained orthopaedic surgeon. CBCT images were reconstructed using the “Sharp” protocols to assess device placement in bone.
Cadaver studies simulating cranial neurosurgery focused on fluoroscopic guidance of electro‐encephalogram (EEG) and deep brain stimulation (DBS) electrodes and CBCT visualization of low‐contrast lesions. Reconstructions were performed with “Smooth” protocols to assess low‐contrast visibility as a function of dose as in Section 2.D.2.
Cadaver studies simulating vascular surgery involved fluoroscopic guidance and CBCT verification of intravascular tools deployed in a variety of anatomical sites by an interventional radiologist. Interventional tools included: biliary stent (E‐Luminexx, Bard); endoprosthesis (Viabahn, Gore Medical); snare catheter (Goose Neck, Amplatz), and a pushable helical coil (Boston Scientific). CBCT scans were reconstructed with “Smooth” or “Sharp” protocols depending on the imaging task (visualization of soft tissue or interventional device, respectively).
3. Results
3.A. 2D imaging performance
3.A.1. Electronic readout noise
Figure 2(a) summarizes measurements of pixel dark noise for the CMOS and a‐Si:H detectors in HG and LG modes. In HG mode, the CMOS detector exhibited a 3× reduction in electronic noise (~430 e− rms for CMOS compared to ~1300 e− rms for a‐Si:H). Similarly in LG mode, the CMOS detector exhibited a ~2.4× reduction in electronic noise (1000 e− rms compared to ~2410 e− rms). For both detectors, the readout noise was found to be independent of frame rate (within measurement error) for both LG and HG modes, suggesting that dark current shot noise is a small component of the total electronic noise, which is more likely dominated by capacitive line noise and amplifier readout noise for both systems.
Figure 2.
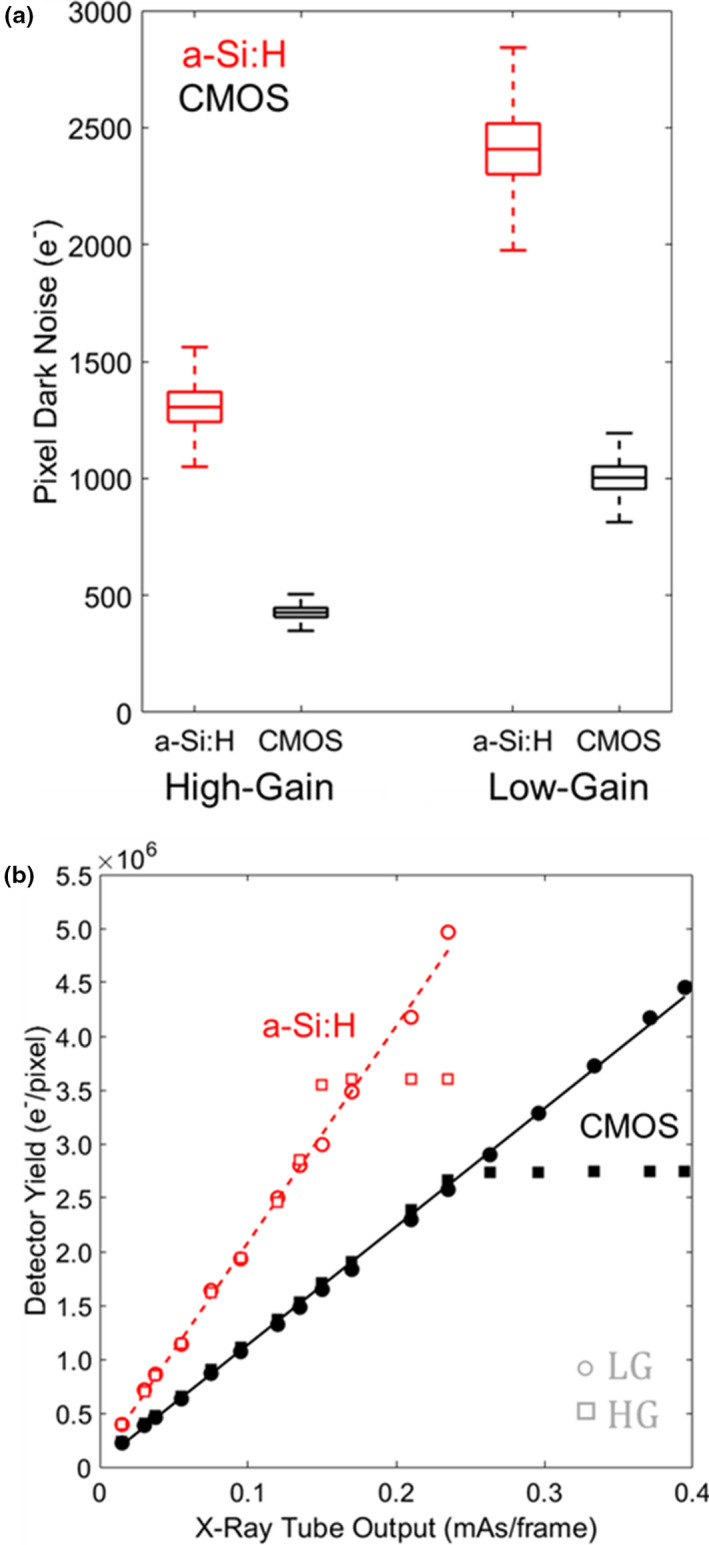
(a) Pixel dark noise for CMOS and a‐Si:H detector in HG and LG modes. (b) Gain and linearity of detector response. [Color figure can be viewed at wileyonlinelibrary.com]
3.A.2. Gain
Figure 2(b) shows the signal response for each detector for HG and LG modes, with both showing a linear response with exposure (r2 ≥ 0.9) and a nonlinear shoulder near saturation. Detector signal was converted from ADU to electrons as described in Section 2.C.2 and Eq. (1). For the CMOS detector, the conversion factor was 199 e−/ADU (LG) and 43 e−/ADU (HG). For the a‐Si:H detector, the factor was ~228 e−/ADU (LG) and ~59 e−/ADU (HG). The signal response of the CMOS and a‐Si:H detectors was estimated at 11 × 106 and 20.1 × 10⁶ e−/mAs/pixel, respectively, for both gain modes, with the lower value for CMOS attributed to smaller pixel size and light losses in the FOP.7, 20, 24
3.A.3. Image lag
As illustrated in Fig. 3, image lag was ~7× higher for the a‐Si:H detector than for CMOS — for example, at 30 fps, first‐frame lag was ~2.4% for a‐Si:H compared to 0.35% for CMOS. Image lag exhibited little or no mAs dependence over the range investigated. The falling‐edge response curve for both systems is shown in Fig. 3(a) at 30 fps. Figure 3(b) shows the dependence on frame rate for each detector: for the a‐Si:H detector, a linear increase in lag was observed with frame rate, whereas for the CMOS detector, the effect was less than measurement error for second‐frame lag and higher.
Figure 3.
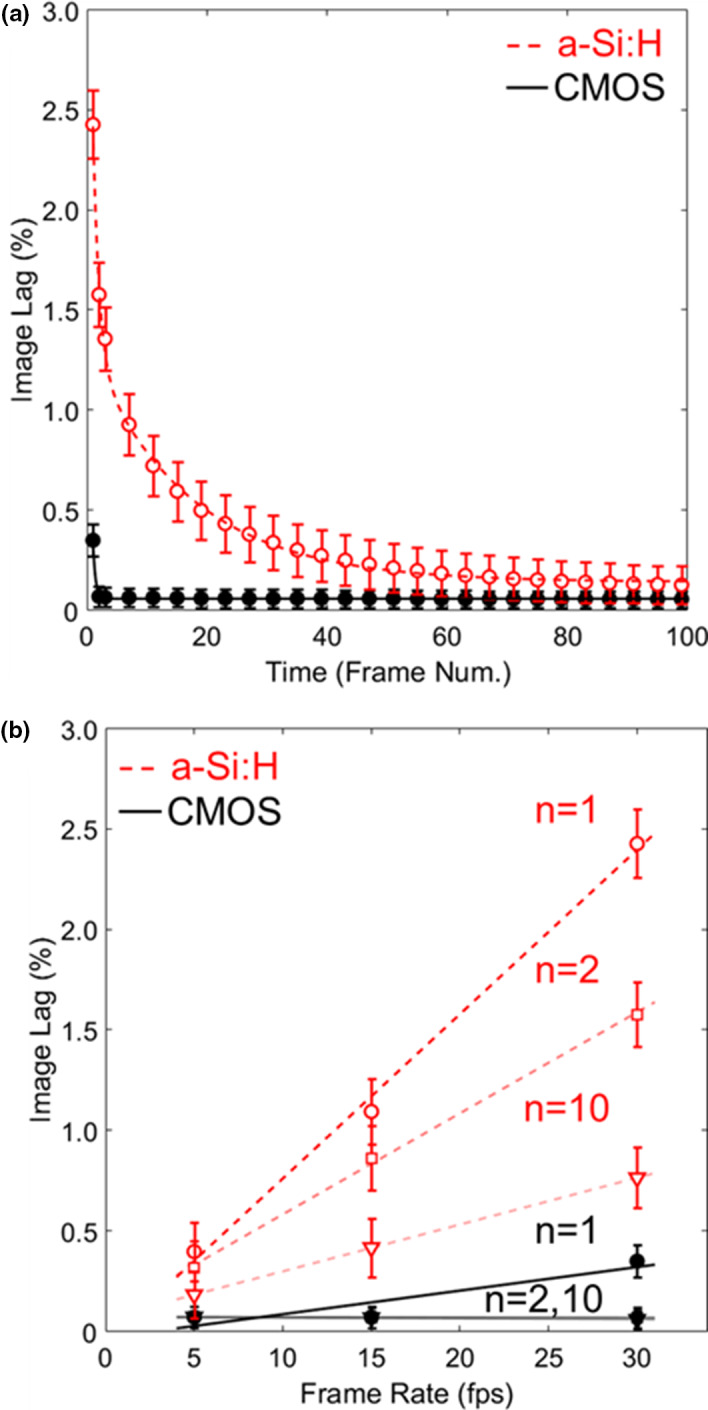
Image lag. (a) Falling‐edge response for CMOS and a‐Si:H detectors at 30 fps. (b) The nth‐frame image lag for each detector at various frame rates. [Color figure can be viewed at wileyonlinelibrary.com]
3.A.4. Pre‐sampling MTF
The pMTF is shown in Fig. 4 for both detectors and binning modes. In 1 × 1 mode, each system exhibits similar performance, with f50 (the spatial frequency at which the MTF reduces to 0.50) ~1.20 mm−1 for CMOS and ~1.13 mm−1 for a‐Si:H. This indicates that the CsI:Tl scintillator is the main factor determining spatial resolution. In the 2 × 2 case, the CMOS system exhibits a slightly higher pMTF, with f50 ~1.02 mm−1 compared to ~0.88 mm−1 for a‐Si:H, showing the slight advantage of finer pixel size (although still dominated by scintillator MTF). Each system is thus fairly bandlimited with respect to aliased noise, with pMTF falling below ~0.29 at the Nyquist frequency for 2 × 2 binning and below ~0.16 at the Nyquist frequency for 1 × 1 binning.
Figure 4.
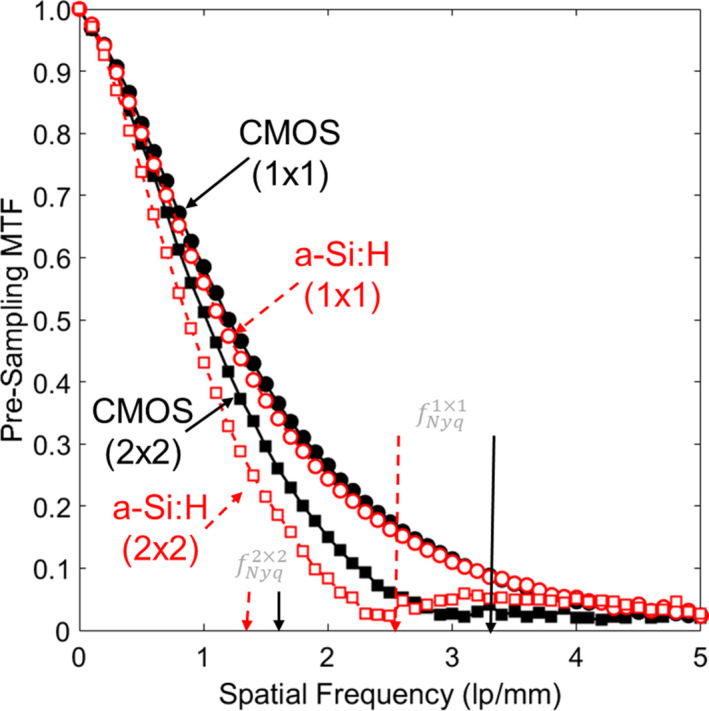
Pre‐sampling MTF in 2D projections for the 1 × 1 and 2 × 2 binning modes of each detector. [Color figure can be viewed at wileyonlinelibrary.com]
3.A.5. Normalized NPS
The projection image NNPS is shown in Fig. 5 for various EAK levels in HG mode. Similar trends were observed for LG mode and are not shown for brevity. The NNPS were similar for the two systems up to EAK ~20 nGy, below which the a‐Si:H system shows ~28% higher NNPS at low frequencies (<0.5 mm−1) and ~125% higher NNPS at high frequencies (2 mm−1) in 1 × 1 mode [Fig. 5(a)], suggesting an increased contribution of electronic noise for the a‐Si:H system at low dose. Similarly for 2 × 2 mode [Fig. 5(b)], the NNPS is ~30% higher at low frequencies (<0.5 mm−1) and ~40% higher at high frequencies (1 mm−1) for the a‐Si:H system.
Figure 5.
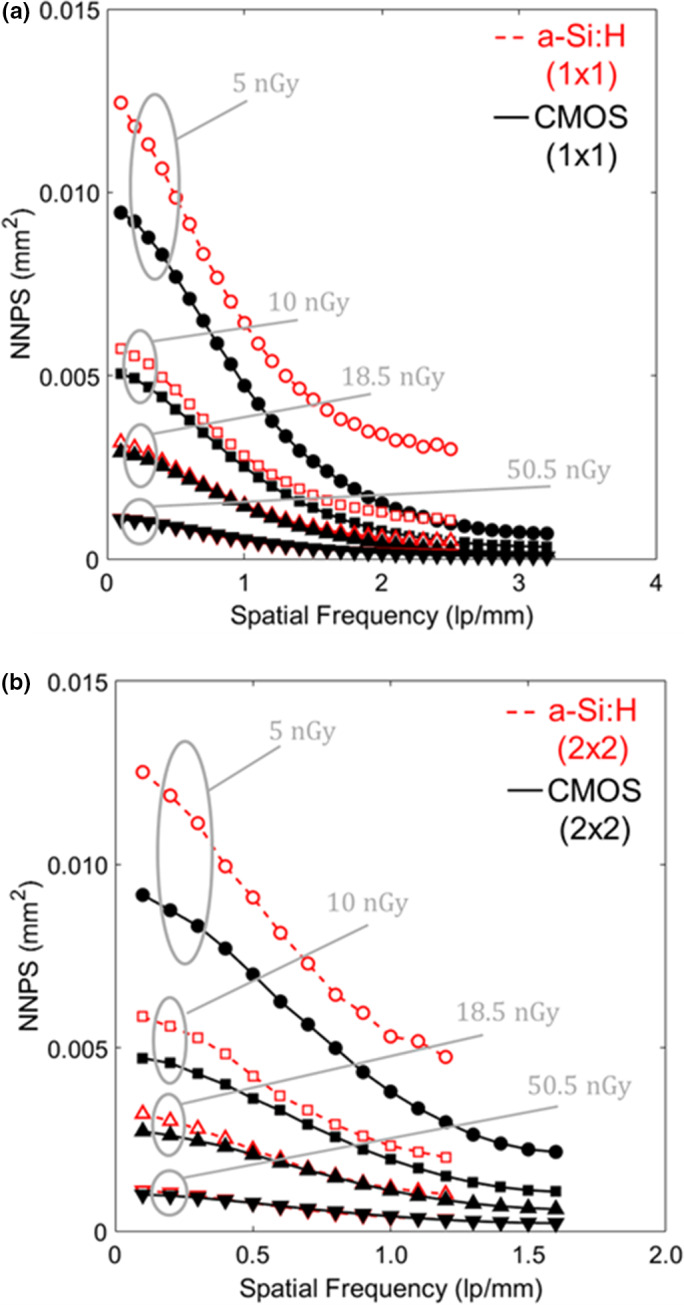
Projection image NNPS in HG for the (a) 1 × 1 and (b) 2 × 2 binning modes at low‐dose levels for which electronic noise contributes substantially to the total noise. [Color figure can be viewed at wileyonlinelibrary.com]
3.A.6. Detective quantum efficiency
The DQE is shown in Fig. 6 for both systems in both binning modes. As shown in Fig. 6(a) for 1 × 1 binning, the CMOS system showed minimal variation in DQE over the low‐dose range, whereas the a‐Si:H system showed a stronger dose dependence, suggesting increased influence of electronic readout noise. Similar trends were found in the 2 × 2 case [Fig. 6(b)]. Figure 7 summarizes DQE over a broad range of dose at low frequency (0.5 mm−1 and 0.1 mm−1 for 1 × 1 and 2 × 2 modes, respectively) and higher frequency (2.3 mm−1 and 1.1 mm−1 for 1 × 1 and 2 × 2 modes, respectively). At the higher dose levels, where the systems are input‐quantum‐limited, the a‐Si:H system demonstrates higher DQE at low frequencies (e.g., ~18% higher than CMOS in 1 × 1 mode), likely due to light losses in the FOP for the CMOS system. At lower dose levels, the CMOS system exhibits higher DQE at low and high frequencies as in Fig. 6. Similar observations were found in LG mode (not shown for brevity).
Figure 6.
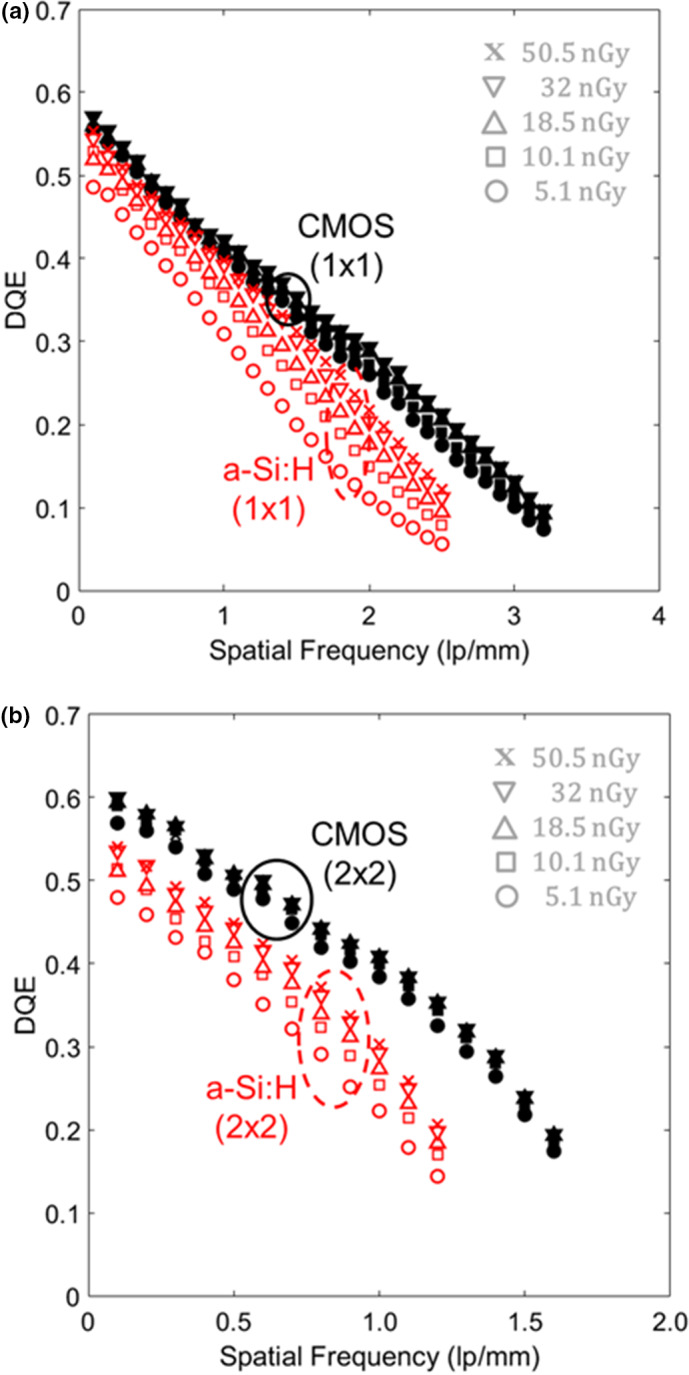
DQE for the two detectors in HG mode for (a) 1 × 1 and (b) 2 × 2 binning. The dose range plotted here corresponds to very low‐dose levels at which electronic readout noise is a significant factor in DQE. [Color figure can be viewed at wileyonlinelibrary.com]
Figure 7.
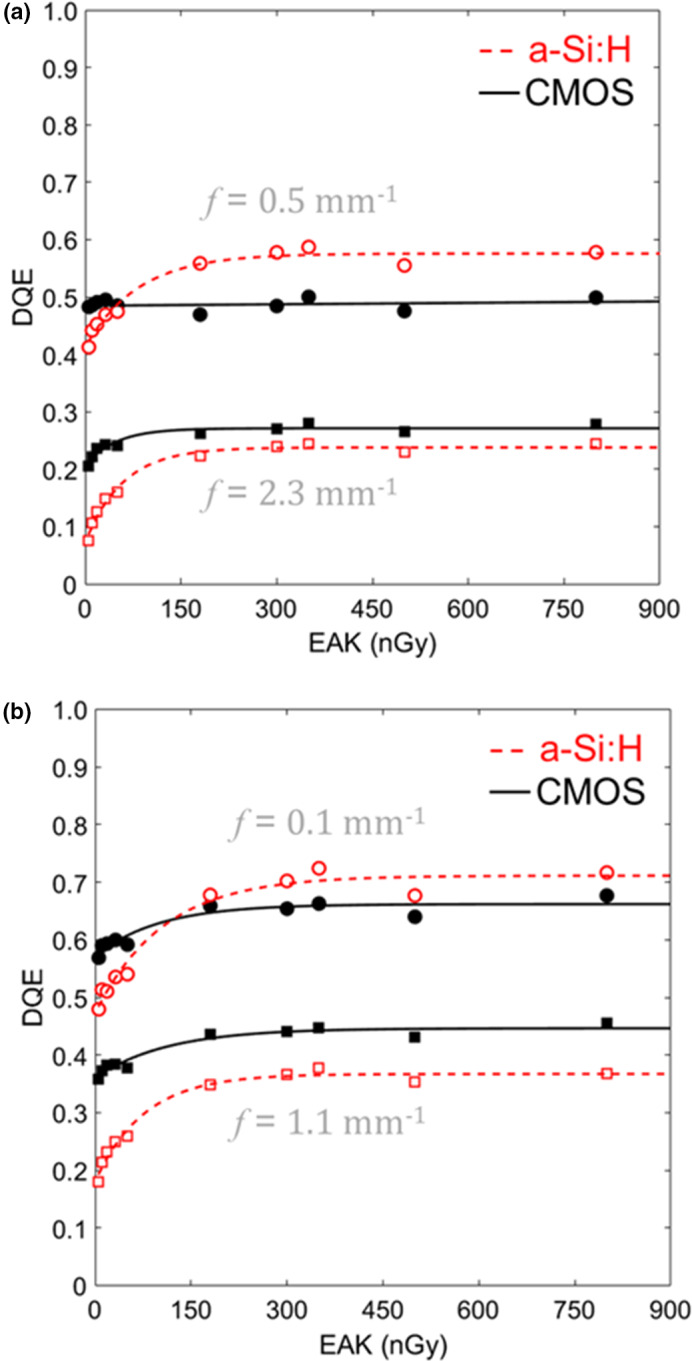
DQE at low and high‐frequency measured as a function of EAK for each system in HG mode with (a) 1 × 1 and (b) 2 × 2 binning. Numerous tradeoffs are evident, including the impact of electronic noise at low doses (higher DQE for CMOS) and the impact of reduced optical coupling at higher dose (higher DQE for a‐Si:H). [Color figure can be viewed at wileyonlinelibrary.com]
3.A.7. Cadaver studies: fluoroscopy
Fluoroscopic and radiographic images from the cadaver studies are shown in Fig. 8. Three exemplary cases illustrate qualitative visual features associated with the differences in MTF, NPS, and DQE detailed above. In each case, window and level were set separately to display the feature of interest in the zoomed region. In Fig. 8(a), fluoroscopic images of a snare catheter (100 kV, 0.015 mAs, EAK ~11 nGy) suggest slightly improved delineation of the edge of the snare loop for the CMOS system. In Fig. 8(b), fluoroscopy of a helical coil (100 kV, 0.015 mAs, EAK ~11 nGy) exhibited notable differences in image noise between the two systems, with the CMOS system allowing slightly improved resolution of the coil. In Fig. 8(c), radiographic visualization of a stent (100 kV, 0.5 mAs equivalent, EAK ~0.4 μGy) appears slightly better in the CMOS system. For tasks, pertinent to orthopaedic surgery — that is, visualization of K‐wires and screws relative to various joint space — there was no perceived advantage to either system. Similarly in guidance of EEG and DBS electrode placement, there was no notable difference in task performance.
Figure 8.
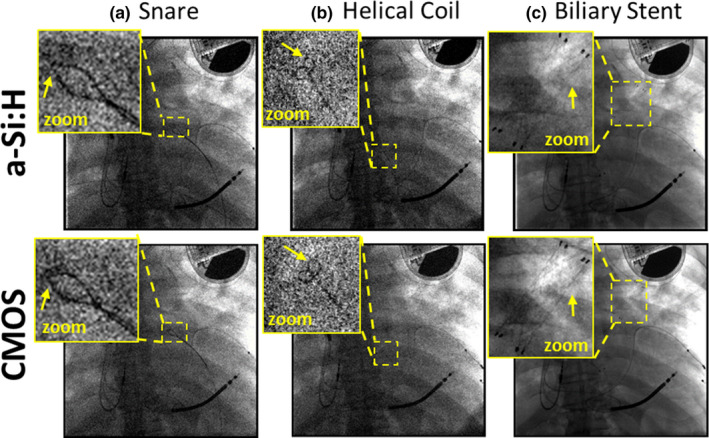
Projection images of a cadaver and interventional devices. Images in (a) and (b) show a single frame (100 kV, 0.015 mAs, EAK ~11 nGy) from a fluoroscopic series during deployment of (a) a snare and (b) a helical coil. (c) Radiographic visualization of a stent (100 kV, 0.5 mAs equivalent, EAK ~0.4 μGy). [Color figure can be viewed at wileyonlinelibrary.com]
The relationship between these qualitative visual differences and the objective performance characterized above is interesting and in some instances, surprising. With respect to electronic readout noise and NPS, the potential advantages of CMOS (stemming primarily from ~3x lower electronic noise) are primarily evident at very low‐dose levels — for example, the improved visualization of the snare and coil at ~11 nGy in Figs. 8(a) and 8(b) consistent with the differences in NNPS and DQE evident at the lowest dose levels in Figs. 5, 6, 7. Interestingly, although the systems differed strongly in image lag characteristics (i.e., ~7x lower lag for CMOS) there was no perceived benefit reported by the observer in fluoroscopic series regarding temporal response. This suggests that while the a‐Si:H system exhibits ~7x higher lag, the magnitude of lag was still sufficiently low as to not diminish task performance in fluoroscopy. The potential advantage of spatial resolution was somewhat evident under higher dose, quantum‐limited imaging conditions as in the radiograph of Fig. 8(c), where the struts of the stent were somewhat better delineated for the CMOS detector.
3.B. 3D imaging performance
3.B.1. Low‐contrast soft‐tissue visualization (“Smooth”) protocol
The 3D imaging performance for the “Smooth” protocol is summarized in Figs. 9, 10, focusing on performance at lower dose levels (CTDIw <1 mGy). Figure 9(a) shows the MTF to be equivalent between the two systems — as expected, given reconstruction at equivalent voxel size (0.5 mm isotropic) with an apodization filter that was matched in cutoff frequency. The axial NPS in Fig. 9(b) exhibits trends analogous to those in Fig. 5, with the CMOS system exhibiting reduced NPS at the lowest dose levels (CTDIw <0.1 mGy), particularly at middle and higher frequencies, owing to reduced electronic noise. Figures 9(c) and 9(d) show the combined effect in axial NEQ: above ~0.1 mGy CTDIw, the NEQ is approximately the same (within ~5% at 0.5 mm−1), with a slight advantage for the a‐Si:H system at low frequencies and higher dose (CTDIw ~0.6 mGy). At lower dose (CTDIw <0.1 mGy), the CMOS system exhibits ~20% increase in NEQ at all frequencies, stemming from the results observed in the 2D DQE of Figs. 6, 7.
Figure 9.
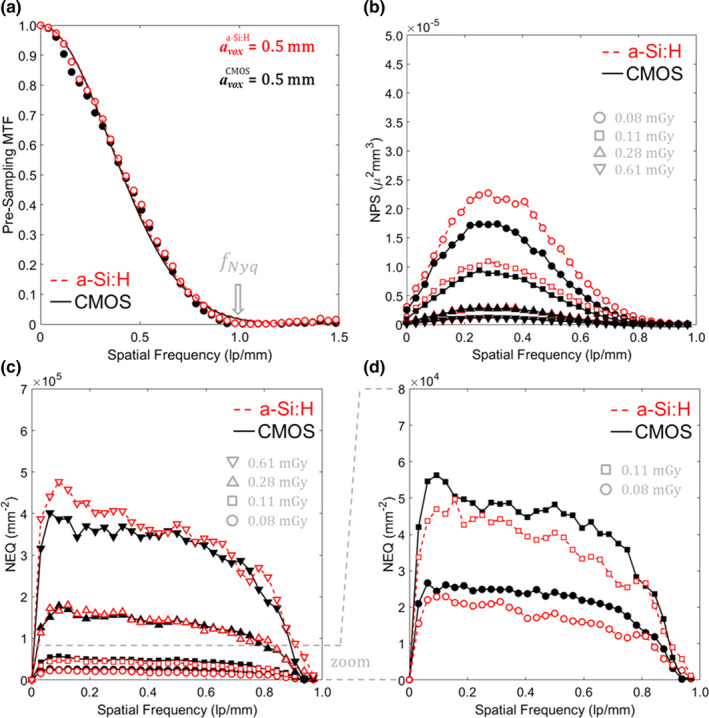
3D MTF, NPS, and NEQ for each system with the “Smooth” 3D reconstruction protocol. (a) MTF, (b) NPS, (c) NEQ, and (d) zoom‐in of NEQ at the lowest dose levels. [Color figure can be viewed at wileyonlinelibrary.com]
Figure 10.
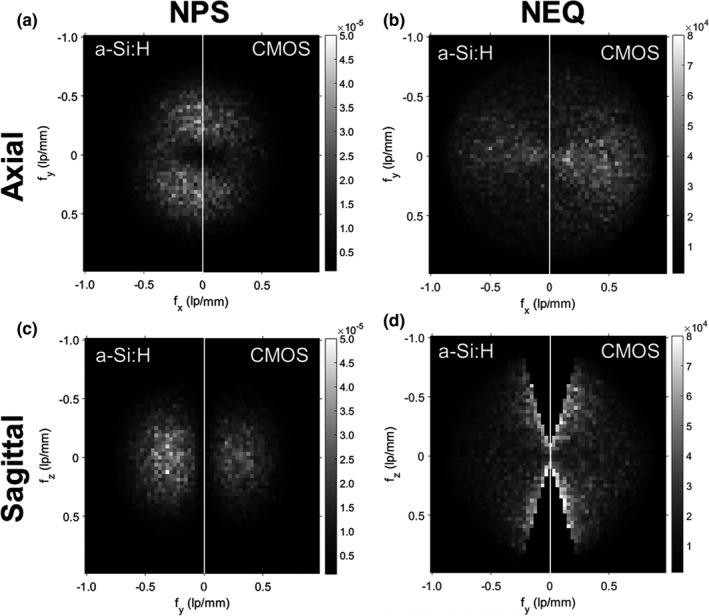
3D NPS and NEQ for the “Smooth” reconstruction protocol. Illustrations taken at lowest dose level (0.08 mGy CTDI w) for: (a) Central axial NPS, (b) Central axial NEQ, (c) Central sagittal NPS and (d) Central sagittal NEQ
Analysis of noise and CNR for each system as a function of dose (not shown for brevity) demonstrated the expected trends: the CMOS system showed reduced noise (by ≥36%) and improved CNR (by ≥56%) in “Smooth” reconstructions at CTDIw <0.2 mGy; and at higher dose levels (CTDIw >0.5 mGy), the noise and CNR was comparable for the two systems.
Figure 10 shows the 3D NPS and NEQ (CTDIw ~ 0.08 mGy) for the “Smooth” reconstruction protocol in (a–b) axial and (c–d) sagittal slices of the 3D Fourier domain. In each case, the higher NPS is evident for the a‐Si:H system, resulting in higher NEQ for the CMOS system under conditions of matched spatial resolution. A slight asymmetry in the axial NPS (reduced NPS along the direction) is due to the partial orbit (~333°) and is evident for both systems.
Cadaver images illustrated in Fig. 11 are illustrative of the effects of reduced NPS on soft‐tissue image quality for low‐dose (100 kVp, 3.75 mAs, CTDIw ~0.3 mGy) and high‐dose protocols (100 kV, 37.5 mAs, CTDIw~1.9 mGy). Visualization of soft‐tissue and bone anatomy are comparable between the two systems at high dose; however, at lower dose, the a‐Si:H system exhibited photon starvation effects in lateral views, evident as increased correlated noise in L‐R directions of the axial slice. Specifically, the a‐Si:H system exhibited a ~20%–40% increase in coefficient of variation at the low‐dose technique.
Figure 11.
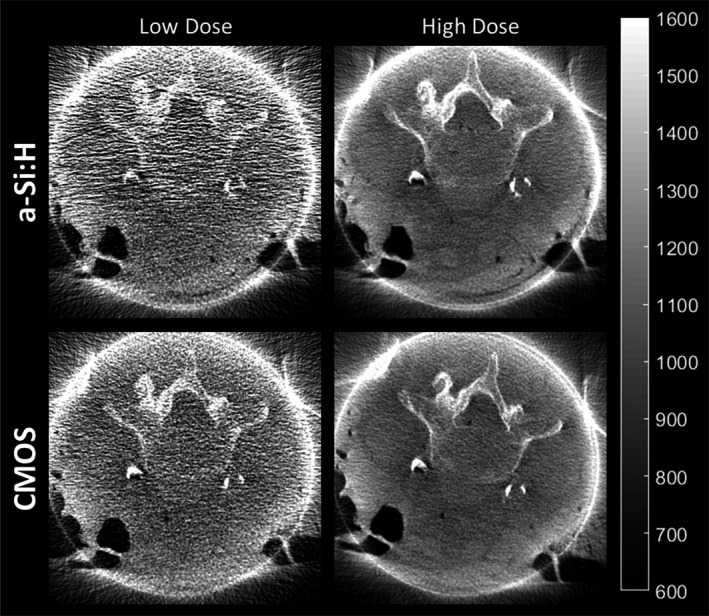
CBCT images of a cadaver reconstructed with the “Smooth” protocol for soft‐tissue visualization. Example images are shown at low (~0.3 mGy CTDI w) and high (~1.9 mGy CTDI w) dose.
3.B.2. High‐contrast spatial resolution (“Sharp”) protocol
3D imaging performance for the “Sharp” reconstruction protocol is summarized in Figs. 12 and 13, focusing again on low‐dose techniques (CTDIw <1 mGy). Figure 12(a) shows measurable improvement in MTF for the CMOS system, resulting from superior 2D MTF in 2 × 2 binning mode (as in Fig. 4) and finer voxel size. The f50 was 0.86 mm−1 for the CMOS system, compared to 0.69 mm−1 for the a‐Si:H system. Although Fig. 9(b) showed improvement in NPS at all frequencies for CMOS (since the reconstruction protocol was resolution‐matched for the Smooth protocols), the NPS in Fig. 12(b) exhibits a tradeoff between spatial resolution and noise for the Sharp reconstructions. Specifically, the higher resolution CMOS system accordingly carries increased NPS at frequencies above ~0.5 mm−1. The implications of such tradeoff are resolved well in terms of the NEQ as shown in Figs. 12(c) and 12(d): at higher dose (CTDIw >0.1 mGy), the CMOS system exhibited ~30% improvement in NEQ at all spatial frequencies; and at lower dose (CTDIw <0.1 mGy) the improvement was even stronger, with ≥40% higher NEQ at 0.5 mm−1 and ≥75% better NEQ at 1 mm−1 for the CMOS system.
Figure 12.
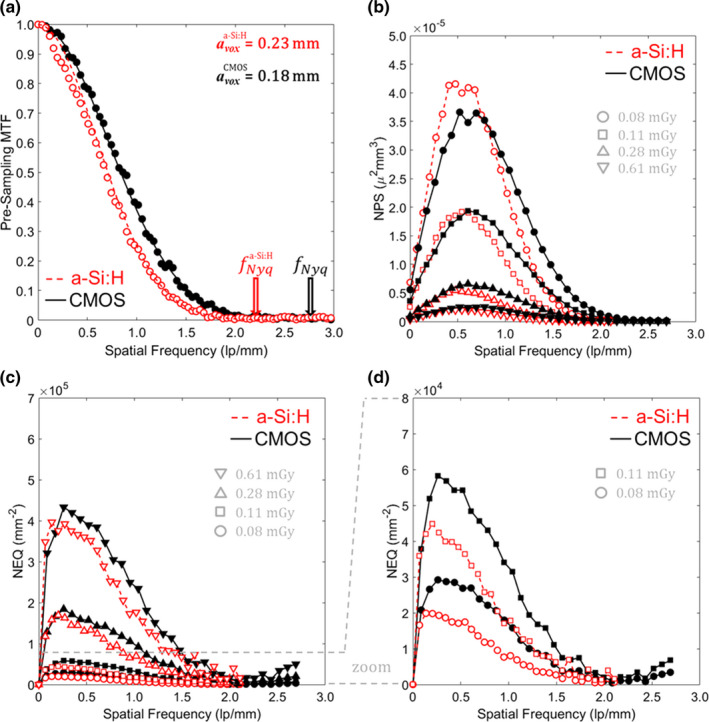
3D MTF, NPS, and NEQ for each system with the “Sharp” 3D reconstruction protocol: (a) MTF, (b) NPS, (c) NEQ, and (d) zoom‐in of NEQ at lowest dose levels. [Color figure can be viewed at wileyonlinelibrary.com]
Figure 13.
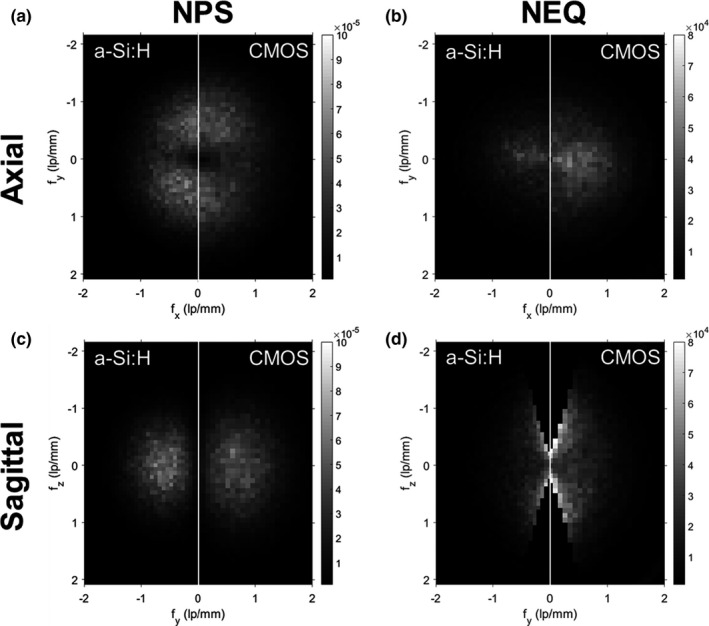
3D NPS and NEQ for the “Sharp” reconstruction protocol at low‐dose (CTDI w = 0.08 mGy). (a) Central axial NPS. (b) Central axial NEQ. (c) Central sagittal NPS. (d) Central sagittal NEQ.
Axial and sagittal slices of the 3D NPS and 3D NEQ for each system are shown in Fig. 13 for the lowest dose level (CTDIw = 0.08 mGy). The results are similar to those in Fig. 10, but close inspection (noting in particular the range of the frequency domain and higher Nyquist frequency for the Sharp reconstruction protocol) highlights the even stronger improvement in NPS and NEQ for the CMOS system at higher spatial frequencies.
Cadaver images in Figs. 14 and 15 reconstructed using the “Sharp” protocol illustrate how differences in 3D MTF, NPS, and NEQ translate to visual image quality in fine anatomical details and performance with respect to high‐frequency tasks. Figure 14 focuses on visualization of an implanted stent, where the task relates to visualization of individual struts. At higher dose [Fig. 14(b)], the higher spatial resolution of the CMOS detector is evident, and at lower dose [Fig. 14(a)], the a‐Si:H system is seen to suffer photon starvation effects (~15% increase in noise compared to the CMOS image) that diminishes visualization of the stent. Figure 15 shows CBCT images in the region of the temporal bone (visualization of mastoid air cells), an implanted stent (visualization of individual struts), and anatomical detail in the chest (visualization of distal bronchi) for the higher dose protocols (CTDIw ~3–4 mGy). Visualization of fine details was judged to be noticeably better in the CMOS system. Similar observations (images not shown for brevity) were made with respect to K‐wires and screws delivered in the ankle joint.
Figure 14.
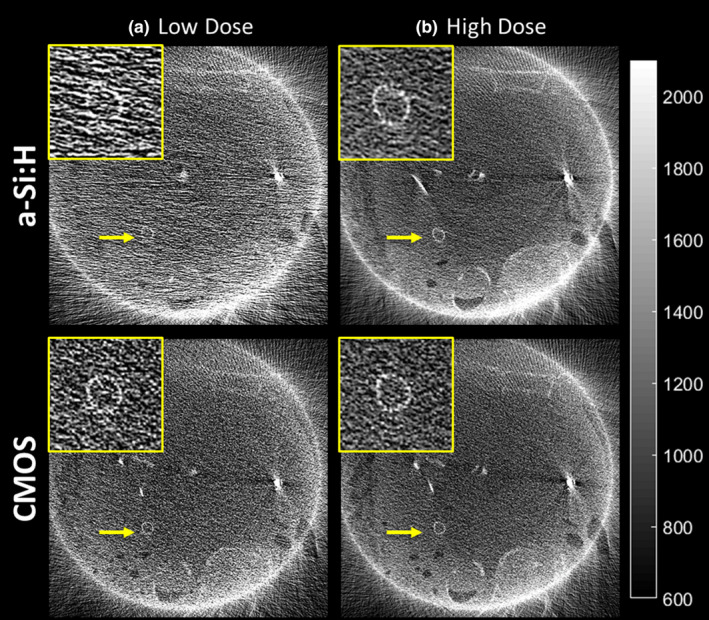
CBCT images (Sharp reconstruction protocol) of a stent implanted in the thoracic cavity of a cadaver at (a) low‐dose (CTDI w ~0.8 mGy) and (b) high dose (CTDI w ~1.9 mGy). [Color figure can be viewed at wileyonlinelibrary.com]
Figure 15.
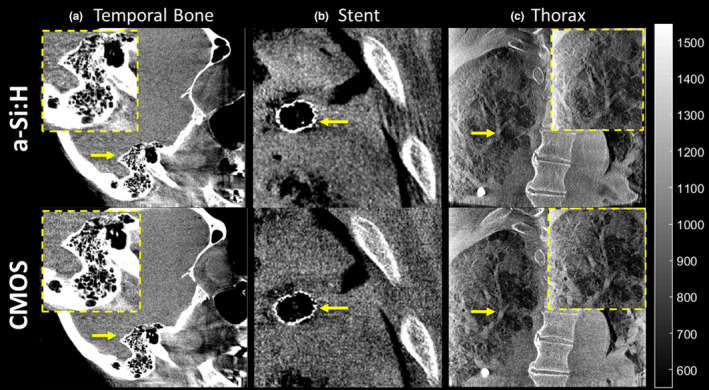
CBCT images (100 kVp, 500 images/333° arc, ~3–4 mGy CTDI w) of (a) temporal bone, (b) stent implant, and (c) thoracic cavity reconstructed with the “Sharp” protocol for visualization of high contrast, fine details. [Color figure can be viewed at wileyonlinelibrary.com]
4. Discussion/Conclusion
The studies reported in this work characterized the extent to which improvements in FPD design (viz., finer pixel size and reduced electronic readout noise) translate to objective measures of 2D and 3D imaging performance — illustrated also in terms of 2D and 3D visual image quality in cadaver studies presenting a variety of interventional imaging tasks.
2D imaging performance characterization included assessment of electronic readout noise (~3x lower for the CMOS system), image lag (~7x lower for the CMOS system), spatial resolution, image noise, and DQE. Spatial resolution was similar for the two systems in 1 × 1 readout mode (limited primarily by the CsI:Tl scintillator), with a slight improvement in MTF evident for the CMOS system in 2 × 2 mode. At high exposure (EAK >300 nGy) for which both systems were input‐quantum‐limited, the NNPS was approximately the same; however, at low exposure (EAK <10 nGy), an increase in NNPS (which is indicative of higher electronic noise) was observed for the a‐Si:H system. Similarly, in terms of DQE: the CMOS system exhibited little or no dose dependence (indicating low electronic noise) and ~18% higher DQE at the lowest exposure levels; however, at high exposure (EAK >150 nGy), the a‐Si:H system exhibited superior DQE, attributed to light losses and/or reduced Swank factor for the CMOS system.
Studies examining the relationship of such 2D imaging performance to 3D imaging performance highlighted differences related to the binning mode and noise characteristics at low dose. For the “Soft” reconstruction protocol, the spatial resolution of the two systems was purposely matched. As a result, the NPS was higher for the a‐Si:H system at the lowest dose levels (CTDIw <0.1 mGy), and NEQ was ~20% higher for the CMOS system at all frequencies. Improvements in low‐contrast CNR were also observed at the low‐dose levels mentioned; however, in some scenarios, an increase in CNR (e.g., ≥56% at CTDIw ≤ 0.2 mGy) may not correspond to improved visualization — for example, if the dose is so low that the imaging task is confounded by x ray quantum noise. For the “Sharp” reconstruction protocol, the CMOS system exhibited higher MTF, and the resulting tradeoff between resolution and noise was described well in terms of the 3D NEQ, which was ≥40% higher for the CMOS system for CTDIw <0.1 mGy.
The quantitative assessment was corroborated in cadaver studies simulating application of the C‐arms in the vascular, neurosurgical, and trauma setting, illustrating how improvements in technical performance may (or may not) translate to perceptual improvement. Fluoroscopic images exhibited improved visualization of fine details (e.g., snare, helical coil, and stent) for the CMOS system at low‐dose levels. However, the lower levels of image lag for the CMOS system were not judged to provide noticeable improvement in tasks of device placement in fluoroscopic series. For the smooth CBCT reconstruction protocols, soft‐tissue visibility was comparable for the two systems at higher dose (CTDIw = 1.9 mGy), but the a‐Si:H system exhibited stronger photon starvation effects at reduced dose (CTDIw <0.3 mGy). For the sharp CBCT reconstruction protocols, the CMOS system exhibited improved visualization of fine instrumentation (e.g., stent struts) and anatomical details (e.g., mastoid air cells).
While this study investigated differences in imaging performance owing primarily to FPD characteristics of spatial resolution and electronic noise, it did not investigate factors associated with differences in readout rate. As summarized in Table 1, the CMOS system provides faster readout in 2 × 2 binning mode, offering potential advantages that were not directly studied in the current work, such as: improved fluoroscopic visualization of dynamic contrast injection/perfusion series; increased number of projections (reduced view aliasing) in CBCT scans; and/or faster CBCT scan speed (reduced patient motion artifacts).
An additional limitation in the current work is that the cadaver studies involved a limited number of specimens, each of the same sex and body habitus, and qualitative evaluation of image quality with respect to a variety of imaging tasks. Such studies illustrate how rigorous, quantitative evaluation of 2D and 3D technical performance (e.g., MTF and NPS) translate to qualitative perceptual differences. The observer assessment corroborated the quantitative evaluation, provided some unexpected insight (e.g., that the strong difference in image lag was not perceptually evident), and illustrated how such technical factors can manifest in clinically realistic images (e.g., correlated noise/photon starvation associated with lateral projections in CBCT). Future work will more quantifiably assess the differences in task‐based observer performance in a study comprising more observers and quantitation of task performance.
The results of this study are indicative of the advantages in imaging performance and dose to be gained through the incorporation of CMOS FPDs in C‐arm fluoroscopy and CBCT. The advantages related primarily to lower dose imaging protocols and imaging tasks requiring high spatial resolution, although the latter was only evident in 2 × 2 binning mode, and spatial resolution was primarily limited by the CsI:Tl scintillator for each system. It is important to note, however, that performance was not universally to the advantage of CMOS. In particular, at higher exposure levels, the CMOS system exhibited lower DQE than the a‐Si:H system, attributed to light loss in the FOP and/or reduced Swank factor. Other potential limitations of CMOS detectors include cost, challenges in manufacturing large‐area arrays >30 × 30 cm2 (with or without tiling of smaller arrays), and improving resistance to radiation damage (without light losses in the FOP).
The current work focused on objective, observer‐independent performance variables, such as CNR, MTF, NPS, DQE, and NEQ, which are well suited to technical evaluation of the two detector technologies. While the work did not include an assessment of task‐based image quality, the objective measures reported in this paper provide basic insight on some aspects of task‐based performance within important assumptions of linearity and stationarity. For example, a simple metric like CNR may be considered within the limits of low contrast (small signal difference), large‐area (low spatial frequency) tasks. More generally, measures such as MTF, NPS, and NEQ are related to spatial‐frequency‐dependent models of task‐based imaging performance under a variety of ideal observer models and may serve as a basis for evaluation of detectability index.
Last, it is worth noting that while the reduced electronic noise for CMOS detectors does support lower dose imaging protocols (both 2D and 3D), the imaging system will ultimately be limited by the input quantum noise. At some point, the dose is so low that x ray quantum noise (even in the absence of electronic noise) will confound visualization of low‐contrast imaging tasks, and incremental gains in CNR owing to further reduction in electronic noise would not improve detectability. Such lower dose protocols (e.g., CTDIw < 0.1 mGy) require investigation as to suitability for visualization and performance of a given imaging task.
Conflicts of interest
The research was supported by academic‐industry partnership with Siemens Healthineers (Forcheim, Germany). GK, SV, SS, and JB are employees of Siemens Healthineers.
Acknowledgments
The research was supported by NIH R01‐EB‐017226 and academic‐industry collaboration with Siemens Healthineers (Forcheim, Germany).
References
- 1. Siewerdsen JH, Antonuk LE, El‐Mohri Y, et al. Empirical and theoretical investigation of the noise performance of indirect detection, active matrix flat‐panel imagers (AMFPIs) for diagnostic radiology. Med Phys. 1997;24:71–89. [DOI] [PubMed] [Google Scholar]
- 2. Antonuk LE, Jee K‐W, El‐Mohri Y, et al. Strategies to improve the signal and noise performance of active matrix, flat‐panel imagers for diagnostic x‐ray applications. Med Phys. 2000;27:289–306. [DOI] [PubMed] [Google Scholar]
- 3. Jain A, Bednarek DR, Rudin S. Experimental and theoretical performance analysis for a CMOS‐based high resolution image detector. Proc SPIE–The Int Soc Opt Eng. 2014;9033:90333P. [DOI] [PMC free article] [PubMed] [Google Scholar]
- 4. Konstantinidis AC, Szafraniec MB, Speller RD, Olivo A. The Dexela 2923 CMOS X‐ray detector: a flat panel detector based on CMOS active pixel sensors for medical imaging applications. Nucl Instrum Methods Phys Res A. 2012;689:12–21. [Google Scholar]
- 5. Karim KS, Nathan A, Rowlands JA. Amorphous silicon active pixel sensor readout circuit for digital imaging. IEEE Trans Electron Devices. 2003;50:200–208. [Google Scholar]
- 6. El‐Mohri Y, Antonuk LE, Koniczek M, et al. Active pixel imagers incorporating pixel‐level amplifiers based on polycrystalline‐silicon thin‐film transistors. Med Phys. 2009;36:3340–3355. [DOI] [PMC free article] [PubMed] [Google Scholar]
- 7. Zhao C, Kanicki J, Konstantinidis AC, Patel T. Large area CMOS active pixel sensor x‐ray imager for digital breast tomosynthesis: analysis, modeling, and characterization. Med Phys. 2015;42:6294–6308. [DOI] [PubMed] [Google Scholar]
- 8. Zhao C, Konstantinidis AC, Zheng Y, Anaxagoras T, Speller RD, Kanicki J. 50 μm pixel pitch wafer‐scale CMOS active pixel sensor x‐ray detector for digital breast tomosynthesis. Phys Med Biol. 2015;60:8977–9001. [DOI] [PubMed] [Google Scholar]
- 9. Patel T, Klanian K, Gong Z, Williams MB. Detective quantum efficiency of a CsI‐CMOS X‐ray detector for breast tomosynthesis operating in high dynamic range and high sensitivity modes. In: Breast Imaging Conference: International Workshop on Digital Mammography. Berlin, Heidelberg: Springer; 2012:80–87. [DOI] [PMC free article] [PubMed] [Google Scholar]
- 10. Zentai G. Comparison of CMOS and a‐Si flat panel imagers for X‐ray imaging. In: 2011 IEEE International Conference on Imaging Systems and Techniques. IEEE; 2011:194–200.
- 11. Shen Y, Zhong Y, Lai C‐J, Wang T, Shaw CC. Cone beam breast CT with a high pitch (75 μm), thick (500 μm) scintillator CMOS flat panel detector: visibility of simulated microcalcifications. Med Phys. 2013;40:101915. [DOI] [PMC free article] [PubMed] [Google Scholar]
- 12. Roos PG, Colbeth RE, Mollov I, et al. Multiple‐gain‐ranging readout method to extend the dynamic range of amorphous silicon flat‐panel imagers. Proc. SPIE. 2004;5368:139–149. [Google Scholar]
- 13. Daly MJ, Siewerdsen JH, Moseley DJ, Jaffray DA, Irish JC. Intraoperative cone‐beam CT for guidance of head and neck surgery: assessment of dose and image quality using a C‐arm prototype. Med Phys. 2006;33:3767–3780. [DOI] [PubMed] [Google Scholar]
- 14. Mahesh M. Fluoroscopy: patient radiation exposure issues. Radiographics. 2001;21:1033–1045. [DOI] [PubMed] [Google Scholar]
- 15. McLean ID, Meghzifene A (Ahmed), Pernicka F (Frantisek), International atomic energy agency. Implementation of the International Code of Practice on Dosimetry in Diagnostic Radiology (Technical Report Series No. 457) : Review of Testing Results. International Atomic Energy Agency; 2011.
- 16. Schafer S, Stayman JW, Zbijewski W, Schmidgunst C, Kleinszig G, Siewerdsen JH. Antiscatter grids in mobile C‐arm cone‐beam CT: effect on image quality and dose. Med Phys. 2012;39:153–159. [DOI] [PMC free article] [PubMed] [Google Scholar]
- 17. Feldkamp LA, Davis LC, Kress JW. Practical cone‐beam algorithm. J Opt Soc Am A. 1984;1:612. [Google Scholar]
- 18. Punnoose J, Xu J, Sisniega A, Zbijewski W, Siewerdsen JH. Technical Note: spektr 3.0‐A computational tool for x‐ray spectrum modeling and analysis. Med Phys. 2016;43:4711–4717. [DOI] [PMC free article] [PubMed] [Google Scholar]
- 19. Hernandez AM, Boone JM. Tungsten anode spectral model using interpolating cubic splines: unfiltered x‐ray spectra from 20 kV to 640 kV. Med Phys. 2014;41:042101. [DOI] [PMC free article] [PubMed] [Google Scholar]
- 20. Cao Q, Sisniega A, Brehler M, et al. Modeling and evaluation of a high‐resolution CMOS detector for cone‐beam CT of the extremities. Med Phys. 2018;45:114–130. [DOI] [PMC free article] [PubMed] [Google Scholar]
- 21. Siewerdsen JH, Cunningham IA, Jaffray DA. A framework for noise‐power spectrum analysis of multidimensional images. Med Phys. 2002;29:2655–2671. [DOI] [PubMed] [Google Scholar]
- 22. Watanabe H, Honda E, Kurabayashi T. Modulation transfer function evaluation of cone beam computed tomography for dental use with the oversampling method. Dentomaxillofac Radiol. 2010;39:28–32. [DOI] [PMC free article] [PubMed] [Google Scholar]
- 23. Tward DJ, Siewerdsen JH. Cascaded systems analysis of the 3D noise transfer characteristics of flat‐panel cone‐beam CT. Med Phys. 2008;35:5510–5529. [DOI] [PMC free article] [PubMed] [Google Scholar]
- 24. Hejazi S, Trauernicht DP. System considerations in CCD‐based x‐ray imaging for digital chest radiography and digital mammography. Med Phys. 1997;24:287–297. [DOI] [PubMed] [Google Scholar]


