

Abstract
Small clinical studies suggest depression is associated with alterations in adiponectin and leptin, adipocyte-derived secretory proteins involved in metabolic regulation; however, longitudinal data on these association are lacking. This study examined cross-sectional and longitudinal associations of depressive symptoms and major depressive disorder (MDD) with adiponectin and leptin in healthy middle-aged women (mean (SD) age, 45.6 (2.5) years). Cross-sectional analyses included 575 women with baseline adipokine data; longitudinal analyses included 262 women with 2–4 adipokine measurements over 5 years. The 20-item Center for Epidemiologic Studies Depression scale (CES-D) was used to assess depressive symptoms; history of MDD was determined by the Structured Clinical Interview for DSM-IV. Adipokines were assayed from stored serum specimens; values were log-transformed for analyses. Linear and repeated measure random effects regression models evaluated associations of baseline CES-D scores with baseline adipokine concentrations and changes over time, respectively. Secondary analyses evaluated the relation of MDD history with adipokine concentrations. Mean (SD) baseline concentrations of adiponectin and leptin were 9.90 (4.92) μg/mL and 27.02 (20.06) ng/mL; both increased over time (p<.0001). CES-D scores were associated with lower adiponectin at baseline (per 1-SD: estimate=−0.04, SE=.02, p=.03) and over time (per 1-SD: estimate=−0.055, SE=.024, p=.02). Associations were unchanged in risk factor-adjusted models. Women with elevated CES-D scores (≥16) had 6.9% (95% CI: −1.1%, 14.3%; p=.089) lower median adiponectin at baseline and 11.5% (95% CI: 1.5%, 20.4%, p=.025) lower median adiponectin over time in adjusted models, compared to women with CES-D<16. Rate of change in adipokines did not vary by baseline depressive symptoms or MDD history. Depressive symptoms and MDD history were unrelated to leptin.
In women at midlife, depressive symptoms are associated with lower adiponectin, a critical anti-inflammatory biomarker involved in metabolic and cardiovascular conditions.
Keywords: Adiponectin, Depression, Inflammation, Leptin, Women, Middle-Aged
1. INTRODUCTION
Major depressive disorder (MDD) and depressive symptoms have been linked to obesity, metabolic syndrome, insulin resistance, and diabetes (Everson et al., 2002; Everson-Rose et al., 2004; Golden et al., 2004), all of which are metabolic risk factors that increase risk for cardiovascular disease (CVD). A potential pathophysiologic pathway by which depression influences metabolic dysregulation is inflammation (Stewart et al., 2009; Rethorst et al., 2014). Clear associations have been reported between depression and C-reactive protein (CRP), interleukin 6 (IL-6), fibrinogen, and tumor necrosis factor alpha (TNF-a) (Maes, 1999; Miller et al., 2002; Matthews et al., 2007). Negative studies exist (Steptoe et al., 2003), but on balance, data accumulating over the last two decades support this association (Raison et al., 2006; Messay et al., 2012). Nonetheless, few studies specifically have examined associations of depression with adipokines, secretory proteins derived from adipocytes (fat cells) that may be pro- or anti-inflammatory, and which are importantly involved in metabolic dysregulation and atherogenesis in humans (Mattu & Randeva, 2013). As described below, adiponectin and leptin are two particular adipokines of interest that may relate to both depression and CVD risk.
Adiponectin, an abundant bioactive protein secreted primarily by adipocytes, has documented anti-thrombotic, anti-inflammatory, insulin-sensitizing, and anti-atherogenic effects (Lihn et al., 2005; Mattu & Randeva, 2013). Adiponectin concentrations are inversely related to obesity, diabetes, insulin resistance, and impaired fasting glucose in cross-sectional and longitudinal studies (Yamamoto et al., 2004; Snijder et al., 2006). Lower concentrations of adiponectin are associated with greater coronary and carotid atherosclerosis (Hasan-Ali et al., 2011; Shanker et al., 2012), and increased risk of adverse cardiovascular events (Persson et al., 2010; Li et al., 2012). However, several studies have reported a seemingly paradoxical association of high adiponectin with poorer outcomes (Beatty et al., 2012; Sook Lee et al., 2013) particularly in persons with existing cardiovascular disease.
Leptin, secreted by adipocytes proportionately to body fat stores, is pro-inflammatory, pro-thrombotic, and intimately involved in metabolic regulation, energy balance, and autonomic nervous system functioning (Mattu & Randeva, 2013). Elevated leptin concentrations are related to increased carotid artery intimal-medial thickening (Ciccone et al., 2001), greater coronary calcification and incident ischemic heart disease in patients with type 2 diabetes (Vavruch et al., 2015). Leptin is associated with more adverse cardiovascular (CV) risk profiles (Shanker et al., 2012) and increased risk of CV events in cardiac patients (Wolk et al., 2004), though conflicting findings have been reported (Ku et al., 2011; Martin et al., 2015).
The relationship of these adipokines to depression has not been well studied, despite what is known about the interrelationships of inflammatory processes, depression, and cardiometabolic function and the biologic plausibility of the association (Taylor & Macqueen, 2010). Available evidence is suggestive, though not consistent (Hu et al., 2015). For example, lower adiponectin concentrations were reported in patients with major depressive disorder (MDD) or other depressive disorder compared with controls (Cizza et al., 2010; Diniz et al., 2012). In contrast, adiponectin was not associated with depression subtypes in a case-control study of young men (Su et al., 2011) and was positively related to subsyndromal depression in men but not women in a small study of elderly adults (Jeong et al., 2012). Some studies have reported higher leptin concentrations among depressed patients relative to healthy controls (Antonijevic et al., 1998; Gecici et al., 2005), but others have reported no difference (Deuschle et al., 1996; Atmaca et al., 2002). One study reported lower leptin concentrations in female patients with either major depressive disorder or schizophrenia, compared with healthy controls (Kraus et al., 2001). Common to nearly all of these studies is a focus on patient samples of limited size, which might account for some of the variation in findings. Moreover, longitudinal data on the relation of these important adipokines and depression are lacking.
These gaps in the literature are addressed by the study reported herein. We used five years of data from a community-based sample of middle-aged African-American and Caucasian women to examine cross-sectional and longitudinal associations of depressive symptoms and MDD with adiponectin and leptin. We hypothesized that women who reported more depressive symptoms and women with a lifetime history of MDD would have lower concentrations of adiponectin and higher concentrations of leptin at baseline and would experience greater changes in these adipokines over time, compared to women with fewer depressive symptoms and women without a history of MDD.
2. METHODS AND MATERIALS
2.1. Sample
This study uses data from the Study of Women’s Health Across the Nation (SWAN), an ongoing community-based longitudinal study of the menopausal transition conducted at 7 clinical sites in the U.S. (Chicago, IL; Pittsburgh, PA; Boston, MA; Detroit, MI; Newark, NJ; Oakland, CA; Los Angeles, CA). SWAN enrolled 3,302 women in 1996–97 with follow-up visits, scheduled at approximately 12- to 18-month intervals, ongoing. Eligibility criteria for SWAN included: aged 42–52 years, intact uterus, at least 1 ovary, reported menstrual bleeding and no use of reproductive hormones that affect ovarian or pituitary function within the past 3 months, not currently pregnant or breast-feeding, and self-identification as 1 of 5 pre-specified racial/ethnic groups depending on site: non-Hispanic Caucasian (all sites), African-American (Chicago, Pittsburgh, Boston, Detroit); Hispanic (Newark); hinese or Chinese-American (Oakland); and Japanese or Japanese-American (Los Angeles). Recruitment and study design details have been reported (Sowers et al., 2000). This study also uses data on the participant’s psychiatric history that was collected through an ancillary study (SWAN Mental Health Study), that was conducted within 2–9 months of the parent SWAN baseline at 3 SWAN clinical sites (Pittsburgh, PA; Chicago, IL; Newark, NJ). All women eligible for theparentSWANstudyatthesesiteswereeligiblefortheentalHealthStudy.AllparticipantsintheparentSWAN study and ancillary SWAN Mental Health Study provided written, informed consent at each study visit. The Institutional Review Board (IRB) at each site approved the study protocols; the IRB at the University of Minnesota approved the present study.
Due to early retention problems at the Newark, NJ site, the sample for this study is limited to the participants from the Pittsburgh and hicago sites, excluding 6 women with no available adipokine data (N=575). Due to limited resources for the adipokine assays, we opted to design the longitudinal portion of our study to include only women without a history of CVD, diabetes or metabolic syndrome at baseline. From this healthy subset, we included all women who had a lifetime history of major depressive disorder (MDD; n=133), determined by the Structured Clinical Interview for DSM-III-R (SCID) from the SWAN Mental Health baseline study, and an equal number of race- and age-matched (within a 5-year window) women without a history of MDD; 4 women without available adipokine data were excluded, leaving an analytic sample of 262 for longitudinal analyses.
2.2. Measures
Depression.
Depressive symptoms were measured in the parent SWAN study at baseline with the 20-item Center for Epidemiological Studies Depression Scale (CES-D) (Radloff, 1977), a well-validated measure with established reliability in racially/ethnically diverse samples (Roberts, 1980) and widely used in epidemiologic studies. Lifetime history of MDD was assessed by the Structured Clinical Interview for DSM-IV (SCID), which was administered as part of the SWAN Mental Health study baseline visit.
Adipokines.
Leptin and adiponectin were assessed in serum specimens obtained as part of the SWAN assessments at baseline for our baseline cohort, and additionally at three follow-up visits (years 01, 03 and 05) for our longitudinal cohort. Fasting morning (before 10 a.m.) blood draws were obtained for all SWAN participants. Blood draws were targeted to the early follicular phase of the menstrual cycle (days 2–5) among cycling women; among non-cycling women, blood draws are obtained within 90 days of the anniversary of their baseline SWAN study visit. Cycle day of blood draw was recorded as within or outside the targeted early follicular phase for cycling women and as outside this window for non-cycling women. Samples were maintained at 4°C until separated and then frozen at −80°C and shipped on dry ice to a central laboratory (Medical Research Laboratories, Lexington, KY); aliquots obtained for the SWAN Repository were shipped on dry ice to the University of Michigan’s SWAN Repository. Leptin and adiponectin assays were done in duplicate, using commercially available colorimetric enzyme immunoassay kits according to the manufacturer’s instructions (Millipore, St. Charles, MO).
The limit of detection for adiponectin and leptin using these kits were 0.78 ng/ml and 0.5 ng/mL, respectively. Based on our experience (>12,000 human serum samples) with these EIA kits, we have found that the coefficient of variability percent was 4.65 +/− 0.34 for adiponectin and 3.9 +/− 0.86 for leptin.
Covariates
Age at baseline was based on self-reported date of birth. Race/ethnicity was based on self-identification; only African-American and Caucasian women participated at the Pittsburgh and Chicago sites. Physical activity at baseline was measured in the parent SWAN study using an adapted questionnaire (Baecke et al., 1982) assessing the frequency of sports, non-sports leisure time, and household/childcare activities. Total caloric intake at baseline was recorded using a modified Block Food Frequency questionnaire (Block et al., 1986). Body mass index (BMI) at baseline was calculated as weight in kilograms divided by height in meters squared. Weight and height were measured annually via standardized protocols (Sowers et al., 2000). Sex hormone-binding globulin (SHBG) was assayed from fasting blood specimens collected at the SWAN baseline visit. Covariates were selected based on their known relation to depressive symptoms and preliminary analyses that showed these demographic, behavioral and hormonal factors were associated with adiponectin or leptin.
2.3. Data Analysis
Descriptive statistics were estimated for all covariates, depressive symptoms, adiponectin and leptin, with t-tests or chi-squared tests used, as appropriate, to compare women with high (≥16) versus low (<16) CES-D scores at baseline on sample characteristics and study variables. Scatterplots of the adiponectin and leptin distributions in relation to CES-D scores at baseline were evaluated to assess potential non-linearity in these relationships of interest, but none was observed. To examine the cross-sectional association of depressive symptoms with adipokines at baseline, separate linear regression models were estimated for adiponectin and leptin. Model 1 included covariates for age, race, study site, and SHBG. Model 2 further adjusted for daily caloric intake and physical activity, and Model 3 added BMI as a covariate. he first set of models included CES-D scores modeled continuously; subsequently, the models were repeated with CES-D scores modeled dichotomously, with CES-D ≥16 (indicative of potentially clinically significant symptomatology) versus scores <16 as the referent category. To examine longitudinal associations of depressive symptoms with concentrations of adiponectin and leptin over time, we used repeated measures random effects regression models. For the longitudinal models, the same modeling strategy for continuous and dichotomous CES-scores described above was employed, with the additional inclusion of a variable representing time in each model, as well as a CES-D*time interaction term to examine whether the rate of change in either adiponectin or leptin varied as a function of depressive symptoms. In secondary analyses, we repeated the models described above, using SCID-assessed history of MDD instead of CES-D scores to estimate associations of clinically diagnosed depression history with adiponectin and leptin concentrations. Further supplemental analyses evaluated baseline associations of depressive symptoms with adiponectin and leptin in a subset of participants without metabolic syndrome at the SWAN baseline visit.
3. RESULTS
Baseline characteristics of the study sample are presented in Table 1 for all participants and by CES-D scores <16 and ≥16). Data are shown for the full sample included in the cross-sectional analyses (N=575) and for women included in the longitudinal analyses (N=262). Women in the full sample were, on average, approximately 46 years old and overweight, and predominantly white and non-smokers at the baseline assessment. The mean baseline CES-D score of the full sample was 10.7, 25.3% had an elevated CES-D score of 16 or higher and 33.6% had a SCID-assessed positive history of MDD. Participants with elevated CES-D scores at baseline were slightly younger, had greater daily calorie intake and higher prevalence of smoking, and had lower adiponectin concentrations at baseline compared to participants with CES-D scores <16. They also were more likely to report a lifetime history of MDD. Leptin concentrations did not vary by depressive symptoms. Similar distributions of baseline characteristics were seen among the 262 women included in the longitudinal analyses (bottom half of Table 1).
Table 1.
Baseline Characteristics of Sample: Study of Women’s Health Across the Nation (SWAN)
| CROSS-SECTIONAL SAMPLE | All participants N=575 |
CES-D score <16 N=429 |
CES-D score ≥16 N=146 |
P-value |
|---|---|---|---|---|
| Age, mean (SD) | 45.6 (2.5) | 45.7 (2.6) | 45.3 (2.3) | 0.037 |
| Race, N (%) | 0.60 | |||
| White | 353 (61.4%) | 266 (62%) | 87 (59.6%) | |
| Black | 222 (38.6%) | 163 (38%) | 59 (40.4%) | |
| SHBG, mean (SD) | 42.97 (23.55) | 42.71 (23.41) | 43.76 (24.03) | 0.65 |
| Daily calorie intake, mean (SD) | 1,883.58 (730.08) | 1843.17 (729.02) | 2003.14 (722.55) | 0.022 |
| Physical activity, mean (SD) | 7.97(1.70) | 8.03 (1.67) | 7.77 (1.78) | 0.12 |
| Smoking, N (%) | 0.074 | |||
| Smoker | 108 (19.0%) | 73 (17.3%) | 35 (24.0%) | |
| Non-Smoker | 461 (81.0%) | 350 (82.7%) | 111 (76.0%) | |
| Alcohol Consumption, N (%) | 0.35 | |||
| None | 423 (73.6%) | 309 (72.0%) | 114 (78.1%) | |
| 1 drink per week | 103 (17.9%) | 82 (19.1%) | 21 (14.4%) | |
| ≥2 drinks per week | 49 (8.5%) | 38 (8.9%) | 11 (7.5%) | |
| BMI, mean (SD) | 28.97 (6.52) | 28.67 (6.02) | 29.84 (7.77) | 0.10 |
| Adiponectin (µg/mL) | ||||
| Raw, median (IQR) | 8.92 (6.31–12.38) | 9.13 (6.48–12.58) | 8.19 (5.64–10.69) | |
| Raw, mean (SD) | 9.90 (4.92) | 10.17 (5.06) | 9.09 (4.41) | 0.015 |
| Log transformed, mean (SD) | 2.18 (0.49) | 2.20 (0.49) | 2.10 (0.47) | 0.021 |
| Leptin (ng/mL) | ||||
| Raw, median (IQR) | 21.46 (12.75–36.59) | 20.73 (12.6–36.36) | 23.03 (13.09–36.71) | |
| Raw, mean (SD) | 27.02 (20.06) | 26.70 (19.95) | 27.97 (20.40) | 0.51 |
| Log transformed, mean (SD) | 3.01 (0.82) | 3.01 (0.79) | 3.02 (0.89) | 0.91 |
| CES-D score | 10.68 (9.29) | 6.22 (4.43) | 23.80 (7.18) | <.0001 |
| SCID-assessed history of MDD | 192 (33.6%) | 117 (27.4%) | 75 (51.7%) | <.0001 |
| LONGITUDINAL SAMPLE | All participants N=262 |
CES-D score <16 N=192 |
CES-D score ≥16 N=70 |
P-value |
| Age, mean (SD) | 45.3 (2.43) | 45.52 (2.49) | 44.71 (2.15) | 0.012 |
| Race, N (%) | 0.40 | |||
| White | 179 (68.3%) | 134 (69.8%) | 45 (64.3%) | |
| Black | 83 (31.7%) | 58 (30.2%) | 25 (35.7%) | |
| SHBG, mean (SD) | 46.15 (25.04) | 45.71 (25.03) | 47.35 (25.2) | 0.64 |
| Daily calorie intake, mean (SD) | 1,828.38 (707.44) | 1756.60 (695.58) | 2028.13 (706.77) | 0.007 |
| Physical activity, mean (SD) | 8.09 (1.72) | 8.15 (1.68) | 7.93 (1.85) | 0.39 |
| Smoking, N (%) | 0.32 | |||
| Smoker | 49 (18.9%) | 33 (17.4%) | 16 (22.9%) | |
| Non-Smoker | 211 (81.1%) | 157 (82.6%) | 54 (77.1%) | |
| Alcohol Consumption, N (%) | 0.44 | |||
| None | 185 (70.6%) | 136 (70.8%) | 49 (70.0%) | |
| 1 drink per week | 54 (20.6%) | 37 (19.3%) | 17 (24.3%) | |
| ≥2 drinks per week | 23 (8.8%) | 19 (9.9%) | 4 (5.7%) | |
| BMI, mean (SD) | 27.1 (5.8) | 26.9 (5.3) | 27.8 (7.0) | 0.29 |
| Adiponectin (µg/mL) | ||||
| Raw, median (IQR) | 9.81 (7.31–13.63) | 10.03 (7.59–14.26) | 9.29 (7.04–12.38) | |
| Raw, mean (SD) | 11.01 (5.28) | 11.49 (5.33) | 9.71 (4.10) | 0.005 |
| Log transformed, mean (SD) | 2.30 (0.46) | 2.34 (0.45) | 2.18 (0.45) | 0.012 |
| Leptin (ng/mL) | ||||
| Raw, median (IQR) | 17.20 (9.99–13.41) | 16.67 (9.89–29.61) | 17.53 (11.83–31.85) | |
| Raw, mean (SD) | 22.77 (18.55) | 22.86 (19.27) | 22.52 (16.51) | 0.89 |
| Log transformed, mean (SD) | 2.84 (0.78) | 2.84 (0.77) | 2.84 (0.82) | 0.99 |
| CES-D score | 11.37 (9.58) | 6.61 (4.43) | 24.41 (7.56) | <.0001 |
| SCID-assessed history of MDD | 131 (50%) | 83 (43.2%) | 48 (68.6%) | 0.0003 |
In the full cross-sectional sample, Ns varied from 570 to 575 on individual variables due to missing data. In the longitudinal sample, the N varied for the CES-D<16 group was 192; and the N for the CES-D≥16 group ranged from 69–70 due to missing data on individual variables. P-values are from t-tests or Chi-square tests comparing women with CES-D scores <16 versus ≥16.
SHBG: Sex hormone binding globulin
BMI: Body mass index
CES-D: Center for Epidemiologic Studies Depression scale
SCID: Structured Clinical Interview for DSM-III-R
MDD: Major Depressive Disorder
3.1. Cross-sectional Findings
3.1.1. Adiponectin Results
Table 2 presents the results from our regression models estimating the association of baseline CES-D scores with baseline concentrations of adiponectin. For ease of interpretation, estimates for a 1-SD difference in CES-D scores are presented; because the outcome variable was log-transformed, the table also presents each regression coefficient exponentiated to show percent differences in median adiponectin concentrations. After controlling for age, race, study site and SHBG, higher depressive symptoms were significantly related to lower adiponectin concentrations (Model 1). This association was little changed and remained statistically significant with adjustment for total caloric intake and physical activity (Model 2) as well as BMI (Model 3). As shown in the right-hand column of Table 2, each 1-SD higher CES-D score was related to an approximately 4% lower median adiponectin concentration at baseline across each of the three models shown.
Table 2.
Cross-Sectional Association of Depressive Symptoms With Baseline Levels of Adiponectin: Study of Women’s Health Across the Nation (N=575*).
| Estimate per 1-SD CES-D score |
Standard Error |
P-value | % Lower (95% CI) median adiponectin values per 1-SD CES-D score |
|
|---|---|---|---|---|
| Model 1 (R2 = .168) |
−0.040 | 0.019 | 0.033 | 3.9% (0.3% to 7.4%) |
| Model 2 (R2 = .185) |
−0.037 | 0.019 | <0.05 | 3.7% (0.02% to 7.1%) |
| Model 3 (R2 = .228) |
−0.039 | 0.018 | <0.05 | 3.8% (0.01% to 7.0%) |
Note: N = 575. Model 1 adjusted for age, race, sex hormone binding globulin, and study site. Model 2 included Model 1 covariates + total caloric intake and physical activity. Model 3 further adjusted for body mass index. Ns in Model 2 and 3 were 569 and 568, respectively, due to missing data on some covariates. CES-D: Center for Epidemiologic Studies Depression scale
Comparing women with and without elevated CES-D scores showed that women with high scores (≥16) had 9.1% (95% CI, 1.2% to 16.5%; p=.026) lower median adiponectin concentrations than their peers with scores <16. This difference was slightly changed (difference, 8.5%; 95% CI, 0.5% to 15.9%; p=.039) after adjusting for total caloric intake and physical activity but with BMI added to the model, the difference between women with high versus low CES-D scores was reduced to 6.9% (95% CI, −1.1% to 14.3%; p=.089).
Secondary analyses with SCID-assessed MDD history showed a similar pattern of associations, although none was statistically significant. Modeling either lifetime history of MDD (yes/no) or current MDD episode (yes/no) as dichotomous variables in separate regression models showed that women who had experienced a major depressive episode had lower baseline levels of adiponectin than women without a history of depression (lifetime history of MDD model: estimate = −0.048 (95% CI, −0.126 to 0.031); p=0.23; 2=0.16; current MDD model: estimate = −0.073 (95% CI, −0.195 to 0.048); p=0.24; R2=0.16; each model adjusted for age, race, SHBG and study site). Subsequent risk factor adjustments had minimal impacts on these associations (data not shown). Looking at the average baseline values of adiponectin showed that women with a current MDD episode had lower baseline adiponectin (mean (SD)=8.9 (4.3) µg/ml) than either women with a history of but no current MDD diagnosis (10.1 (4.8) µg/ml) or women with no MDD history(10.0(5.1) µg/ml).
3.1.2. Leptin Results
CES-scores were not consistently related to baseline leptin concentrations. In minimally adjusted models, the observed associations were negative with CES-D modeled continuously (per 1-SD higher CES-D score: estimate = −0.027 (95% CI, −0.09 to 0.035); p=0.39; R2=0.15), but positive with CES-D scores modeled dichotomously (CES-D≥16: estimate = 0.024 (95% CI, −0.12 to 0.17); p=.79; R2=0.18). Neither association was statistically significant. Results were similar with additional adjustments for behavioral risk factors. Adding BMI as a covariate altered these associations, which remained non-significant [per 1-SD higher CES-D: estimate = −0.038 (95% CI, −0.082 to 0.006); p=0.09; R2=0.59; with CES-D scores modeled dichotomously, CES-D≥16: estimate = −0.086 (95% CI, −0.19 to 0.014); p=0.09; R2=0.59]. However, due to the high correlation between BMI and leptin (r = .75), adding BMI as a covariate introduced collinearity into the model, thereby limiting the interpretation of individual predictors. The secondary analyses with SCID-assessed history of MDD and leptin showed no associations between lifetime history of MDD (yes/no) and baseline leptin concentration (all ps>.6; data not shown).
3.1.3. Supplemental Analyses
Pre-existing metabolic or cardiovascular conditions were not exclusionary criteria for SWAN; however, as noted in the Methods section, limited resources for conducting adipokine assays prompted us to restrict our sample for longitudinal analyses to the healthiest subset of SWAN participants. We also repeated our baseline, cross-sectional analyses of depressive symptoms and adiponectin and leptin on the healthiest subset of women at baseline, i.e., excluding 130 women who met criteria for metabolic syndrome at baseline. Results of these analyses, with a sample size of 445, were essentially the same as the analyses with the full baseline sample. Depressive symptoms were consistently and significantly related to baseline adiponectin levels in each of 3 risk factor-adjusted models but not related to leptin (see supplemental tables).
3.2. Longitudinal Findings
Figure 1 shows the unadjusted means for adiponectin and leptin at each study visit by high (≥16) and low (<16) CES-scores for the 262 women in the longitudinal analysis. Concentrations of both adipokines increased across study visits.
Figure 1.
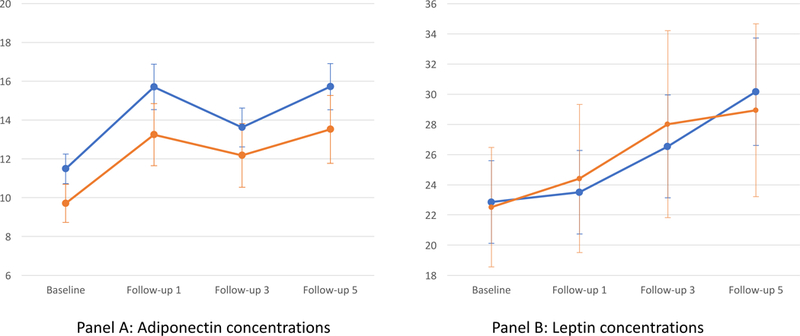
Means (95% CI) For Adiponectin (µg/ml) And Leptin (ng/ml) Over Time By CES-D Score (Low/High)
The figure graphs unadjusted mean concentrations of adiponectin (panel A) and leptin (panel B) at baseline and 3 follow-up visits for the longitudinal sample of women. Blue lines depict means for women with CES-D scores <16 (N = 192) and orange lines depict means for women with CES-D scores≥16(N = 70).
3.2.1. Adiponectin Results
The random effects regression models evaluating the relation of baseline depressive symptoms with (log-transformed) adiponectin over time showed no interactions between baseline CES-D scores and time (CES-D*time interaction ps>0.3), indicating that the rate of change in adiponectin over time did not vary as a function of depressive symptoms at baseline. However, we did observe consistent and robust main effects of depressive symptoms on adiponectin concentrations, which are shown in Table 3. With CES-D scores modeled continuously, increasing depressive symptoms at baseline were significantly related to lower adiponectin across study visits in all models, with only slight attenuation of the association in the fully adjusted model (Model 3). The main effect of depressive symptoms translated to approximately 5% lower median adiponectin over time for each 1-SD higher CES-D score at baseline, as shown in the right-hand column of Table 3.
Table 3.
Longitudinal Associations of Depressive Symptoms With Levels of Adiponectin Over Time: Study of Women’s Health Across the Nation
| Estimate per 1-SD CES-D Score |
Standard Error |
P-value | % Lower (95% CI) median adiponectin values per 1-SD CES-D score |
|
|---|---|---|---|---|
| Model 1 (Model R2 = .17) |
−0.055 | 0.024 | 0.022 | 5.4% (0.8% to 9.8%) |
| Model 2 (Model R2 = .19) |
−0.054 | 0.024 | 0.039 | 5.3% (0.7% to 9.7%) |
| Model 3 (Model R2 = .20) |
−0.049 | 0.024 | 0.04 | 4.8% (0.3% to 9.2%) |
Note: N = 262. Model 1 adjusted for time, age, race, sex hormone binding globulin, and study site. Model 2 included Model 1 covariates + total caloric intake and physical activity at baseline. Model 3 further adjusted for baseline body mass index. Ns in Model 2 and 3 were both 261 due to missing data on one covariate. The CES- *time interaction was non-significant; therefore, models presented above did not include the interaction term in the model.
CES-D: Center for Epidemiologic Studies Depression scale
The same pattern of findings was evident comparing women with high versus low CES-D scores. There was no interaction between the dichotomous CES-D variable and time, but a robust main effect was observed. Women with elevated CES-D scores at baseline had 13.1% lower median adiponectin over time (95% CI: 3.4% to 21.8%; p=.01) adjusting for age, race, SHBG, study site, and time. This difference was 12.2% (95% CI: 2.4% to 21.1%; p=.017) after further adjusting for total caloric intake and physical activity, and in the fully adjusted model that included BMI as a covariate, this difference was reduced to 11.5% (95% CI: 1.5% to 20.4%) but remained statistically significant (p=.025).
In contrast to the primary analyses, the secondary analyses with SCID-assessed history of MDD showed no associations with adiponectin over time (ps>0.8; data not shown).
3.2.2. Leptin Results
The random effects regression models showed no evidence of a longitudinal relationship between CES-D scores at baseline and changes in leptin over time (C S-D*time interaction ps>0.45). There also were no main effects of baseline depressive symptoms on leptin concentrations across study visits, with CES-D scores modeled either continuously (per 1-SD higher CES-score: estimate = −0.015 (95% CI, −0.096 to 0.066); p=0.71; R2=0.22) or dichotomously (CES-D≥16: estimate = 0.006 (95% CI, −0.18 to 0.19); p=.95; R2=0.20), adjusting for age, race, SHBG and study site. There was little change in coefficients after adding behavioral risk factors, and associations remained non-significant (ps>0.14) with BMI also added to the model. SCID-assessed lifetime history of MDD was unrelated to leptin in longitudinal models (ps>0.33; data not shown).
4. DISCUSSION
In this study of community dwelling Caucasian and African-American women at mid-life, higher levels of depressive symptoms were consistently associated with lower concentrations of adiponectin, an important anti-inflammatory, insulin-sensitizing and anti-atherogenic hormone. At baseline, we observed an inverse relation between adiponectin and depressive symptoms, such that women with higher CES-D scores had significantly lower adiponectin than their counterparts with low CES-D scores. Baseline CES-D scores also were significantly associated with lower median adiponectin concentrations across study visits. However, we did not observe differences in the rate of change in adiponectin over follow-up by CES-D scores. Together, these findings suggest that depressive symptoms have an overall dampening effect on adiponectin, but do not accelerate declines in adiponectin over time. Leptin, which has pro-inflammatory properties, was unrelated to depressive symptoms in this study, either cross-sectionally or longitudinally. Lifetime history of MDD showed a weaker though consistent inverse association with adiponectin but only in the baseline analyses, and no consistent relation to leptin concentrations.
Among our study sample, adiponectin concentrations tended to increase over time though not in a completely linear fashion as evident in Figure 1. A review of the literature shows that serum adiponectin tends to be higher at older ages for both women and men (Marques-Vidal et al., 2010; Schautz et al., 2012). The literature is not consistent, however, and most studies rely on cross-sectional data. In our study, after controlling for BMI, age was significantly, positively related to adiponectin in our cross-sectional analyses, and study visit, our measure of time in the longitudinal analyses, was significantly, positively related to adiponectin as well. Interestingly, Schautz and colleagues (Schautz et al., 2012) reported that the higher adiponectin values observed at older ages in their sample were independent of age-related increases in visceral adiposity as well as total fat mass. Notably, in the current analyses, depressive symptoms remained inversely related to adiponectin after taking into consideration age, adiposity and behavioral risk factors. Our findings demonstrate a relatively robust association of depressive symptoms with this anti-inflammatory biomarker and point to the need for future work to elucidate the mechanism(s) that underlie the relation of depression with adiponectin. One possibility relates to the hypothalamic-pituitary-adrenal (HPA) axis, which plays a regulatory role with adiponectin and whose function may be altered with depression (Taylor and MacQueen, 2010). However, our study was not designed to evaluate such mechanisms.
Among women, the years surrounding the menopausal transition are a time of increasing cardiometabolic risk (Janssen et al., 2008; de Kat et al., 2017). We know that for many women, this period in mid-life also is characterized by increases in depressive symptoms (Bromberger et al., 2007). It stands to reason then that increasing depressive symptoms could contribute to the greater cardiometabolic risk experienced by women as they age. An important question to address is, by what mechanisms or pathways might these phenomena be linked? Whether adipokines mediate the impact of depression on cardiometabolic risk is largely unknown. Because adiponectin has anti-inflammatory, anti-thrombotic and anti-atherogenic effects (Lihn et al., 2005; Mattu & andeva, 2013), we suspect that reduced concentrations of adiponectin could contribute to worsening cardiometabolic risk in women at midlife. A prior analysis of our baseline data showed that both CES-D scores and adiponectin levels were related to prevalent metabolic syndrome and higher Framingham Risk scores (Clark et al., 2012); moreover, the association of depression with these indicators of cardiometabolic risk was diminished after controlling for adiponectin. Due to the design of the present study, the longitudinal data on adipokines were limited to women without CVD, diabetes, or metabolic syndrome at baseline and only 33 women (12.5%) developed metabolic syndrome at some point during the 5 years of follow-up. Therefore, the longitudinal sample had low cardiometabolic risk overall and insufficient data to evaluate whether the reduced adiponectin concentration observed in relation to baseline CES-D scores and maintained over time contributes to worsening cardiometabolic risk during the follow-up period. Investigating these inter-relationships will be a task for future studies.
Our findings add to the limited prior available studies that have examined the relation of depression with adiponectin. ase-control studies have shown that patients with MDD have lower adiponectin levels than controls (Cizza et al., 2010; Diniz et al., 2012) though other studies have not shown this association (Su et al., 2011; Jeong et al., 2012). Few epidemiologic studies addressing this relation have been reported. A 2010 study found that among post-menopausal women, negative mood, though unrelated cross-sectionally to adiponectin, was associated with lower adiponectin 1 year later (Adam et al., 2010). In that study, having a depressive disorder also was related to lower adiponectin. The data in the present study show that CES-D scores had a relatively constant effect on adiponectin but did not contribute to accelerated declines in adiponectin over the follow-up period in our sample of midlife women. Moreover, we did not observe a relation of history of MDD with adiponectin, which is somewhat surprising given the prior studies. Women who met SCID criteria at baseline for a current depressive episode had lower adiponectin concentrations than those who did not meet these criteria, though the difference was not significant. Further research is needed to evaluate these linkages of depression with adiponectin to gain a better understanding of how depressive symptoms as well as clinically manifest depressive disorder influence this important biomarker.
The lack of relationship between depressive symptoms and leptin in our data is surprising. Leptin is thought to regulate mood and emotion. Low levels of leptin in rodents and humans are associated with depression and leptin has shown antidepressant-like activity in animal models of depression (Lu et al., 2006). In contrast, elevated levels of leptin are associated with depression in human epidemiologic and clinical studies (Antonijevic et al., 1998; Gecici et al., 2005). One explanation for this disparity could be the lack of leptin receptor signaling in the brain. The leptin receptor is expressed in the hippocampus and amygdala and leptin-mediated intracellular signaling events have been observed in neurons in these regions of the brain (Burguera et al., 2000). When leptin levels are low or too high, leptin receptor signaling is insufficient to prevent depressive symptoms. Elevated leptin levels are associated with leptin resistance where leptin does not cross the blood brain barrier or leptin receptor signaling is diminished due to chronic elevation of serum leptin (Lu, 2007). In this study, depressive symptoms, as assessed by the CES-D, were not consistently associated with leptin and we did not find evidence of a non-linear relationship between depressive symptoms and leptin; moreover, few of our women met SCID criteria for a current depressive episode. It is possible that the biologic actions of leptin could play a more important role in acute episodes of major depressive disorder than in subsyndromal depressive symptoms. Further research is needed to explore these associations.
4.1. Strengths & Limitations
This study from SWAN has several strengths to note. Our sample of midlife women included over 500 community-dwelling Caucasian and African American women. We were able to evaluate both depressive symptoms and history of MDD in relation to two important adipokines cross-sectionally and longitudinally over 5 years in a sizable subset of participants. The comprehensive assessments that are conducted as part of the SWAN visits allowed us to control for adiposity, behavioral risk factors and sex hormones, all of which are potentially important confounders. Limitations include an inability to assess long-term effects of lowered adiponectin on subsequent cardiometabolic risk in our sample due to the study design. Further, our results may not be generalizable to younger or older women, to men, or to other racial/ethnic groups.
4.2. Conclusions
This study shows a robust relation of depressive symptoms with lowered concentrations of adiponectin but not leptin in middle-aged women over 5 years of follow-up. The association with adiponectin is independent of age, behavioral risk factors and adiposity. Additional research is needed to further explore whether lowered adiponectin is a critical physiologic pathway by which depressive symptoms contribute to metabolic dysregulation and increasing cardiometabolic risk in an aging population.
Supplementary Material
Highlights.
In women at mid-life, depressive symptoms are inversely associated with concentrations of adiponectin, an adipocyte-derived secretory protein that is anti-inflammatory and anti-atherogenic.
Women with significantly elevated depressive symptoms had nearly 7% lower levels of adiponectin at baseline and more than 11% lower levels over 5 years of follow-up, compared to women without high levels of depressive symptoms.
Findings show an overall dampening effect of depressive symptoms on adiponectin levels, rather than a differential effect on rate of change in adiponectin over time.
Depressive symptoms and leptin were not related to each other.
Acknowledgments:
We thank the study staff at each site and all the women who participated in the Study of Women’s Health Across the Nation (SWAN). The authors also thank Alexandra Wolfe, B.S., for assistance with manuscript preparation.
Funding: The Study of Women’s Health Across the Nation (SWAN) has grant support from the National Institutes of Health (NIH), DHHS, through the National Institute on Aging (NIA), the National Institute of Nursing Research (NINR) and the NIH Office of Research on Women’s Health (ORWH) (Grants U01NR004061; U01AG012505, U01AG012535, U01AG012531, U01AG012539, U01AG012546, U01AG012553, U01AG012554, U01AG012495). The Chicago site of SWAN also is supported by the Charles J. and Margaret Roberts Trust. The SWAN Mental Health Study was supported by the National Institute of Mental Health (NIMH) (grants R01MH59689 and R01MH59770). The present study used bio-specimens from the SWAN Repository, which is supported by the NIA (Grant U01 G017719). The present study also was supported by the National Heart, Lung, and Blood Institute (Grant R21HL091290) and by the Program in Health Disparities Research and the Applied Clinical Research Program at the University of Minnesota. The content of this manuscript is solely the responsibility of the authors and does not necessarily represent the official views of the NIA, NINR, NIMH, NHLBI, ORWH or the NIH.
SWAN
Clinical Centers: University of Michigan, Ann Arbor – Siobán Harlow, PI 2011 – present, MaryFran Sowers, PI 1994–2011; Massachusetts General Hospital, Boston, MA – Joel Finkelstein, PI 1999 – present; Robert Neer, PI 1994 – 1999; Rush University, Rush University Medical Center, Chicago, IL – Howard Kravitz, PI 2009 – present; Lynda Powell, PI 1994 – 2009; University of California, Davis/Kaiser – Ellen Gold, PI; University of California, Los Angeles – Gail Greendale, PI; Albert Einstein College of Medicine, Bronx, NY – Carol Derby, PI 2011 – present, Rachel Wildman, PI 2010 – 2011; Nanette Santoro, PI 2004 – 2010; University of Medicine and Dentistry – New Jersey Medical School, Newark – Gerson Weiss, PI 1994 – 2004; and the University of Pittsburgh, Pittsburgh, PA – Karen Matthews, PI.
NIH Program Office: National Institute on Aging, Bethesda, MD – Chhanda Dutta 2016-present; Winifred Rossi 2012–2016; Sherry Sherman 1994 – 2012; Marcia Ory 1994 – 2001; National Institute of Nursing Research, Bethesda, MD – Program Officers.
Central Laboratory: University of Michigan, Ann Arbor – Daniel McConnell (Central Ligand Assay Satellite Services).
SWAN Repository: University of Michigan, Ann Arbor – Siobán Harlow 2013 - Present; Dan McConnell 2011 – 2013; MaryFran Sowers 2000 – 2011.
Coordinating Center: University of Pittsburgh, Pittsburgh, PA – Maria Mori Brooks, PI 2012 - present; Kim Sutton-Tyrrell, PI 2001 – 2012; New England Research Institutes, Watertown, MA - Sonja McKinlay, PI 1995 – 2001.
Steering Committee: Susan Johnson, Current Chair; Chris Gallagher, Former Chair
Findings from this study were presented in part at the annual meetings of the Society for Epidemiology Research and the American Psychosomatic Society, with published abstracts only:
-
a)
Everson-Rose SA, Clark CJ, Wang Q, Guo H, Mancuso P, Goldberg J, Kravitz H, Bromberger JT, Sowers MF. Depressive symptoms are associated with adiponectin levels in middle-aged women. American Journal of Epidemiology 2010;171(Suppl):S39 (abstract #157).
-
b)
Everson-Rose SA, Clark CJ, Guo H, Wang Q, Goldberg J, Mancuso P, Bromberger JT, Kravitz HM, Sowers MF. Depressive symptoms predict adiponectin levels over five years in women. Psychosomatic Medicine 2011; 73:A-102 (abstract 1171).
Footnotes
Publisher's Disclaimer: This is a PDF file of an unedited manuscript that has been accepted for publication. As a service to our customers we are providing this early version of the manuscript. The manuscript will undergo copyediting, typesetting, and review of the resulting proof before it is published in its final citable form. Please note that during the production process errors may be discovered which could affect the content, and all legal disclaimers that apply to the journal pertain.
Conflict of Interest statement
Everson-Rose et al., Depressive Symptoms and Adipokines in Women: Study of Women’s Health Across the Nation
Financial Disclosures/Conflicts: The authors report no financial disclosures or conflicts of interest.
Contributor Information
Susan A. Everson-Rose, Department of Medicine and Program in Health Disparities Research, University of Minnesota Medical School, Minneapolis, MN.
Cari J. Clark, Hubert Department of Global Health, Rollins School of Public Health, Emory University, Atlanta, GA.
Qi Wang, Biostatistical Design & Analysis Center, Clinical and Translational Science Institute, University of Minnesota, Minneapolis, MN.
Hongfei Guo, Division of Biostatistics, School of Public Health, and Clinical and Translational Science Institute, University of Minnesota, Minneapolis, MN.
Peter Mancuso, Department of Nutritional Sciences, University of Michigan School of Public Health, Ann Arbor, MI.
Howard M. Kravitz, Department of Psychiatry and Department of Preventive Medicine, Rush Medical College, Rush University Medical Center, Chicago, IL.
Joyce T. Bromberger, Departments of Epidemiology and Psychiatry, University of Pittsburgh, Pittsburgh, PA.
References
- Adam T, Schamarek I, Springer EA, Havel PJ, Epel EE, 2010. Adiponectin and negative mood in healthy premenopausal and postmenopausal women. Horm Behav 58, 699–704. [DOI] [PubMed] [Google Scholar]
- Antonijevic IA, Murck H, Frieboes RM, Horn R, Brabant G, Steiger A, 1998. Elevated nocturnal profiles of serum leptin in patients with depression. J Psychiatr Res 32, 403–410. [DOI] [PubMed] [Google Scholar]
- Atmaca M, Kuloglu M, Tezcan E, Gecici O, Ustundag B, 2002. Serum cholesterol and leptin levels in patients with borderline personality disorder. Neuropsychobiology 45, 167–171. [DOI] [PubMed] [Google Scholar]
- Baecke JA, Burema J, Frijters JE, 1982. A short questionnaire for the measurement of habitual physical activity in epidemiological studies. Am J Clin Nutr 36, 936–942. [DOI] [PubMed] [Google Scholar]
- Beatty AL, Zhang MH, Ku IA, Na B, Schiller NB, Whooley MA, 2012. Adiponectin is associated with increased mortality and heart failure in patients with stable ischemic heart disease: data from the Heart and Soul Study. Atherosclerosis 220, 587–592. [DOI] [PMC free article] [PubMed] [Google Scholar]
- Block G, Hartman AM, Dresser CM, Carroll MD, Gannon J, Gardner L, 1986. A data-based approach to diet questionnaire design and testing. Am J Epidemiol 124, 453–469. [DOI] [PubMed] [Google Scholar]
- Bromberger JT, Matthews KA, Schott LL, Brockwell S, Avis NE, Kravitz HM, Everson-Rose SA, Gold EB, Sowers M, Randolph JF, 2007. epressive symptoms during the menopausal transition: the Study of Women’s Health Across the Nation (SWAN). J Affect Disord 103, 267–272. [DOI] [PMC free article] [PubMed] [Google Scholar]
- Burguera B, Couce ME, Long J, Lamsam J, Laakso K, Jensen MD, Parisi JE, Lloyd RV, 2000. The long form of the leptin receptor (OB-Rb) is widely expressed in the human brain. Neuroendocrinology 71, 187–195. [DOI] [PubMed] [Google Scholar]
- Ciccone M, Vettor R, Pannacciulli N, Minenna A, Bellacicco M, Rizzon P, Giorgino R, De Pergola G, 2001. Plasma leptin is independently associated with the intima-media thickness of the common carotid artery. Int J Obes Relat Metab Disord 25, 805–810. [DOI] [PubMed] [Google Scholar]
- Cizza G, Nguyen VT, Eskandari F, Duan Z, Wright EC, Reynolds JC, Ahima RS, Blackman MR, Group, P.S., 2010. Low 24-hour adiponectin and high nocturnal leptin concentrations in a case-control study of community-dwelling premenopausal women with major depressive disorder: the Premenopausal, Osteopenia/Osteoporosis, Women, Alendronate, Depression (POWER) study. J Clin Psychiatry 71, 1079–1087. [DOI] [PMC free article] [PubMed] [Google Scholar]
- Clark CJ, Wang Q, Guo H, Bromberger JT, Mancuso P, Kravitz HM, Henderson KM, Everson-Rose SA, 2012. Lower adiponectin levels may underlie association between depressive symptoms and markers of cardiometabolic health. Circ 125, AP082. [Google Scholar]
- de Kat AC, Dam V, Onland-Moret NC, Eijkemans MJ, Broekmans FJ, van der Schouw YT, 2017. Unraveling the associations of age and menopause with cardiovascular risk factors in a large population-based study. BMC Med 15, 2. [DOI] [PMC free article] [PubMed] [Google Scholar]
- Deuschle M, Blum WF, Englaro P, Schweiger U, Weber B, Pflaum CD, Heuser I, 1996. lasma leptin in depressed patients and healthy controls. Horm Metab Res 28, 714–717. [DOI] [PubMed] [Google Scholar]
- Diniz BS, Teixeira AL, Campos AC, Miranda AS, Rocha NP, Talib LL, Gattaz WF, Forlenza OV, 2012. Reduced serum levels of adiponectin in elderly patients with major depression. J Psychiatr Res 46, 1081–1085. [DOI] [PubMed] [Google Scholar]
- Everson SA, Maty SC, Lynch JW, Kaplan GA, 2002. Epidemiologic evidence for the relation between socioeconomic status and depression, obesity, and diabetes. J Psychosom Res 53, 891–895. [DOI] [PubMed] [Google Scholar]
- Everson-Rose SA, Meyer PM, Powell LH, Pandey D, Torréns JI, Kravitz HM, Bromberger JT, Matthews KA, 2004. Depressive symptoms, insulin resistance, and risk of diabetes in women at midlife. Diabetes Care 27, 2856–2862. [DOI] [PubMed] [Google Scholar]
- Gecici O, Kuloglu M, Atmaca M, Tezcan AE, Tunckol H, Emül HM, Ustundag B, 2005. High serum leptin levels in depressive disorders with atypical features. Psychiatry Clin Neurosci 59, 736–738. [DOI] [PubMed] [Google Scholar]
- Golden SH, Williams JE, Ford DE, Yeh HC, Paton Sanford C, Nieto FJ, Brancati FL, Atherosclerosis Risk in Communities Study, 2004. Depressive symptoms and the risk of type 2 diabetes: the Atherosclerosis Risk in Communities study. Diabetes Care 27, 429–435. [DOI] [PubMed] [Google Scholar]
- Hasan-Ali H, Abd El-Mottaleb NA, Hamed HB, Abd-Elsayed A, 2011. Serum adiponectin and leptin as predictors of the presence and degree of coronary atherosclerosis. Coron Artery Dis 22, 264–269. [DOI] [PubMed] [Google Scholar]
- Hu Y, Dong X, Chen J, 2015. Adiponectin and depression: A meta-analysis. Biomed Rep 3, 38–42. [DOI] [PMC free article] [PubMed] [Google Scholar]
- Janssen I, Powell LH, Crawford S, Lasley B, Sutton-Tyrrell K, 2008. Menopause and the metabolic syndrome: the Study of Women’s Health Across the Nation. Arch Intern Med 168, 1568–1575. [DOI] [PMC free article] [PubMed] [Google Scholar]
- Jeong HG, Min BJ, Lim S, Kim TH, Lee JJ, Park JH, Lee SB, Han JW, Choi SH, Park YJ, Jang HC, Kim KW, 2012. Plasma adiponectin elevation in elderly individuals with subsyndromal depression. Psychoneuroendocrinology 37, 948–955. [DOI] [PubMed] [Google Scholar]
- Kraus T, Haack M, Schuld A, Hinze-Selch D, Pollmächer T, 2001. Low leptin levels but normal body mass indices in patients with depression or schizophrenia. Neuroendocrinology 73, 243–247. [DOI] [PubMed] [Google Scholar]
- Ku IA, Farzaneh-Far R, Vittinghoff E, Zhang MH, Na B, Whooley MA, 2011. Association of low leptin with cardiovascular events and mortality in patients with stable coronary artery disease: the Heart and Soul Study. Atherosclerosis 217, 503–508. [DOI] [PMC free article] [PubMed] [Google Scholar]
- Li Q, Lu Y, Sun L, Yan J, Yan X, Fang L, Li M, Fan Z, 2012. Plasma adiponectin levels in relation to prognosis in patients with angiographic coronary artery disease. Metabolism 61, 1803–1808. [DOI] [PubMed] [Google Scholar]
- Lihn AS, Pedersen SB, Richelsen B, 2005. Adiponectin: action, regulation and association to insulin sensitivity. Obes Rev 6, 13–21. [DOI] [PubMed] [Google Scholar]
- Lu XY, 2007. The leptin hypothesis of depression: a potential link between mood disorders and obesity? Curr Opin Pharmacol 7, 648–652. [DOI] [PMC free article] [PubMed] [Google Scholar]
- Lu XY, Kim CS, Frazer A, Zhang W, 2006. Leptin: a potential novel antidepressant. Proc Natl Acad Sci U S A 103, 1593–1598. [DOI] [PMC free article] [PubMed] [Google Scholar]
- Maes M, 1999. Major depression and activation of the inflammatory response system. Adv Exp Med Biol 461, 25–46. [DOI] [PubMed] [Google Scholar]
- Marques-Vidal P, Bochud M, Paccaud F, Mooser V, Waeber G, Vollenweider P, 2010. Distribution of plasma levels of adiponectin and leptin in an adult Caucasian population. Clin Endocrinol (Oxf) 72, 38–46. [DOI] [PubMed] [Google Scholar]
- Martin SS, Blaha MJ, Muse ED, Qasim AN, Reilly MP, Blumenthal RS, Nasir K, Criqui MH, McClelland RL, Hughes-Austin JM, Allison MA, 2015. Leptin and incident cardiovascular disease: the Multi-ethnic Study of Atherosclerosis (MESA). Atherosclerosis 239, 67–72. [DOI] [PMC free article] [PubMed] [Google Scholar]
- Matthews KA, Schott LL, Bromberger J, Cyranowski J, Everson-Rose SA, Sowers MF, 2007. Associations between depressive symptoms and inflammatory/hemostatic markers in women during the menopausal transition. Psychosom Med 69, 124–130. [DOI] [PubMed] [Google Scholar]
- Mattu HS, Randeva HS, 2013. Role of adipokines in cardiovascular disease. J Endocrinol 216, T17–36. [DOI] [PubMed] [Google Scholar]
- Messay B, Lim A, Marsland AL, 2012. Current understanding of the bi-directional relationship of major depression with inflammation. Biol Mood Anxiety Disord 2, 4. [DOI] [PMC free article] [PubMed] [Google Scholar]
- Miller GE, Stetler CA, Carney RM, Freedland KE, Banks WA, 2002. Clinical depression and inflammatory risk markers for coronary heart disease. Am J Cardiol 90, 1279–1283. [DOI] [PubMed] [Google Scholar]
- Persson J, Lindberg K, Gustafsson TP, Eriksson P, Paulsson-Berne G, Lundman P, 2010. Low plasma adiponectin concentration is associated with myocardial infarction in young individuals. J Intern Med, 268, 194–205 [DOI] [PubMed] [Google Scholar]
- Radloff L, 1977. The CES-D Scale: A self-report depression scale for research in the general population. Appl Pscyhol Measure 385–401.
- Raison CL, Capuron L, Miller AH, 2006. Cytokines sing the blues: inflammation and the pathogenesis of depression. Trends Immunol 27, 24–31. [DOI] [PMC free article] [PubMed] [Google Scholar]
- Rethorst CD, Bernstein I, Trivedi MH, 2014. Inflammation, obesity, and metabolic syndrome in depression: analysis of the 2009–2010 National Health and Nutrition Examination Survey (NHANES). J Clin Psychiatry 75, e1428–1432. [DOI] [PMC free article] [PubMed] [Google Scholar]
- Roberts RE, 1980. Reliability of the CES-D Scale in different ethnic contexts. Psychiatry Res 2, 125–134. [DOI] [PubMed] [Google Scholar]
- Schautz B, Later W, Heller M, Peters A, Müller MJ, Bosy-Westphal A, 2012. Impact of age on leptin and Adiponectin independent of adiposity. Br J Nutr 108, 363–370. [DOI] [PubMed] [Google Scholar]
- Shanker J, Rao VS, Ravindran V, Dhanalakshmi B, Hebbagodi S, Kakkar VV, 2012. Relationship of adiponectin and leptin to coronary artery disease, classical cardiovascular risk factors and atherothrombotic biomarkers in the IARS cohort. Thromb Haemost 108, 769–780. [DOI] [PubMed] [Google Scholar]
- Snijder MB, Heine RJ, Seidell JC, Bouter LM, Stehouwer CD, Nijpels G, Funahashi T, Matsuzawa Y, Shimomura I Dekker JM, 2006. Associations of adiponectin levels with incident impaired glucose metabolism and type 2 diabetes in older men and women: the hoorn study. Diabetes Care 29, 2498–2503. [DOI] [PubMed] [Google Scholar]
- Sook Lee E, Park SS, Kim E, Sook Yoon Y, Ahn HY, Park CY, Ho Yun Y, Woo Oh S, 2013. Association between adiponectin levels and coronary heart disease and mortality: a systematic review and meta-analysis. Int J Epidemiol 42, 1029–1039. [DOI] [PubMed] [Google Scholar]
- Sowers M, Crawford S, Sternfeld B, Morganstein D, Gold E, Greendale G, Evans D, Neer R, Matthews K, Sherman S, Lo A, Weiss G, Kelsey J, 2000. SWAN: A Multicenter, Multiethnic, Community-Based Cohort Study of Women and the Menopausal Transition, in: Lobo R, Kelsey J, Marcus R (Eds.), Menopause: Biology and Pathobiology Academic Press, San Diego, pp. 175–188. [Google Scholar]
- Steptoe A, Kunz-Ebrecht SR, Owen N.2003. Lack of association between depressive symptoms and markers of immune and vascular inflammation in middle-aged men and women. Psychol Med 33, 667–674. [DOI] [PubMed] [Google Scholar]
- Stewart JC, Rand KL, Muldoon MF, Kamarck TW, 2009. A prospective evaluation of the directionality of the depression-inflammation relationship. Brain Behav Immun 23, 936–944. [DOI] [PMC free article] [PubMed] [Google Scholar]
- Su SC, Sun MT, Wen MJ, Lin CJ, Chen YC, Hung YJ, 2011. Brain-derived neurotrophic factor, adiponectin, and proinflammatory markers in various subtypes of depression in young men. Int J Psychiatry Med 42, 211–226. [DOI] [PubMed] [Google Scholar]
- Taylor VH, Macqueen GM, 2010. The role of adipokines in understanding the associations between obesity and depression. J Obes 2010, Article ID 748048, 6 pages; 10.1155/2010/748048. [DOI] [PMC free article] [PubMed] [Google Scholar]
- Vavruch C, Länne T, Fredrikson M, Lindström T, Östgren J & Nystrom FH, 2015. Serum leptin levels are independently related to the incidence of ischemic heart disease in a prospective study of patients with type 2 diabetes. Cardiovasc Diabetol, 14, 62. [DOI] [PMC free article] [PubMed] [Google Scholar]
- Wolk R, Berger P, Lennon RJ, Brilakis ES, Johnson BD, Somers VK, 2004. Plasma leptin and prognosis in patients with established coronary atherosclerosis. J Am Coll Cardiol 44, 1819–1824. [DOI] [PubMed] [Google Scholar]
- Yamamoto Y, Hirose H, Saito I, Nishikai K, Saruta T, 2004. Adiponectin, an adipocyte-derived protein, predicts future insulin resistance: two-year follow-up study in Japanese population. J Clin Endocrinol Metab 89, 87–90. [DOI] [PubMed] [Google Scholar]
Associated Data
This section collects any data citations, data availability statements, or supplementary materials included in this article.