

ABSTRACT
The increasing prevalence of antibiotic resistant pathogens poses a serious threat to global health. However, less emphasis has been placed to co-relate the gene expression and metabolism of antibiotic resistant pathogens. This study aims to elucidate gene expression and variations in metabolism of multidrug resistant Klebsiella pneumoniae after exposure to antibiotics. Phenotypic responses of three genotypically distinct carbapenem resistant Klebsiella pneumoniae (CRKP) strains untreated and treated with sub-lethal concentrations of imipenem were investigated via phenotype microarrays (PM). The gene expression and metabolism of the strain harboring blaNDM-1 before and after exposure to sub-lethal concentration of imipenem were further investigated by RNA-sequencing (RNA-Seq) and 1H NMR spectroscopy respectively. Most genes related to cell division, central carbon metabolism and nucleotide metabolism were downregulated after imipenem treatment. Similarly, 1H NMR spectra obtained from treated CRKP showed decrease in levels of bacterial end products (acetate, pyruvate, succinate, formate) and metabolites involved in nucleotide metabolism (uracil, xanthine, hypoxanthine) but elevated levels of glycerophosphocholine. The presence of anserine was also observed for the treated CRKP while FAPγ-adenine and methyladenine were only present in untreated bacterial cells. As a conclusion, the studied CRKP strain exhibited decrease in central carbon metabolism, cell division and nucleotide metabolism after exposure to sub-lethal concentrations of imipenem. The understanding of the complex biological system of this multidrug resistant bacterium may help in the development of novel strategies and potential targets for the management of the infections.
KEYWORDS: Carbapenem resistant Klebsiella pneumoniae, antibiotic resistance, phenotype microarrays, RNA-Seq, 1H NMR
Introduction
The rates of infection cases caused by carbapenem resistant Klebsiella pneumoniae (CRKP) have increased alarmingly in the recent years [1–3]. The presence of various antibiotic resistant genes harbored by K. pneumoniae coupled with its rapid dissemination in many parts of the world poses a serious public health concern. K. pneumoniae carbapenemase (KPC) and New Delhi metallo-beta-lactamase (NDM) are two carbapenemase genes associated with K. pneumoniae [4,5]. The KPC gene is endemic in the United States, Greece and Israel and has spread to other countries via inter-country transfer of patients colonized or infected with strains harboring KPC gene [6]. The widespread distribution of the KPC gene in various Gram-negative pathogens is mediated by a Tn3-based transposon, Tn4401 [7]. Meanwhile, the NDM gene is endemic in India and Pakistan and within the past two years, has been reported in all continents except for Central and South America. Most cases of reported NDM gene have been linked to hospitalization or travel to the Indian subcontinent [8,9]. Plasmids carrying the NDM gene can harbor many resistance determinants such as other carbapenemase genes, cephalosporinase genes, aminoglycoside resistance genes and macrolide resistance genes which serve as a source for multidrug or pandrug resistance [9].
Bacteria are able to protect themselves by undergoing various morphological and physiological changes or adaptations. For instance, bacteria can adapt to fluctuating levels of nutrients, antibiotics or environmental stressors by reorganizing their gene expression or changing the metabolism hubs such as tricarboxylic acid (TCA) cycle and electron transport chain [10,11]. The physiological and morphological plasticity are among the main factors contributing to the development of resistance to antibiotic; however, it is unreassuring as broad-spectrum antibiotics are often given as empiric treatment whilst awaiting laboratory culture results. Furthermore, combination antibiotic therapy is sometimes administered as empiric treatment for patients who are severely ill or in septic shock due to infections such as bacteremia, neutropenic sepsis, pneumonia or surgical site infection [12]. Kumar et al. [13] showed that combination therapy significantly reduced intensive care and hospital mortality while early combination of antibiotic therapy can decrease mortality rates in septic shock patients. Notwithstanding the benefit, careful attention must be given to the usage of antibiotic to prevent the development of antibiotic resistance.
This study aims to investigate the response and adaptation of carbapenem resistant K. pneumoniae under antibiotic selection pressure. The carbon utilization, ionic and pH responses were studied and significantly altered genes and changes in metabolite production after imipenem treatment were also determined. The findings provided substantial insights on how carbapenem resistant K. pneumoniae react to the antibiotic treatment while trying to survive under different circumstances.
Materials and method
Bacterial strains
Three clinical strains of carbapenem resistant K. pneumoniae (CRKP) strains which were previously characterized namely, K/1310–33, K/1309–39 and K/1309–38 were included in this study [14]. These three CRKP strains were resistant to imipenem and harbored carbapenemase genes. The minimal inhibitory concentration (MIC) of these strains were determined using E-test method and the results were interpreted according to Clinical and Laboratory Standards Institute (CLSI) guidelines [15]. K/1310–33 and K/1309–38 harbored blaKPC-2 and blaOXA-48 with different MICtowards imipenem while K/1309–39 harbored blaNDM-1 and blaIMP-8 (Table 1).
Table 1.
Minimal inhibitory concentration (MIC) and carbapenemase genes harbored by the three carbapenem resistant Klebsiella pneumoniae (CRKP) strains in this study.
| Strain | Isolation site | Minimal inhibitory concentration towards imipenem (μg/ml) | Carbapenemase genes harbored |
|---|---|---|---|
| K/1310–33 | Blood | > 32 | blaKPC-2, blaOXA-48 |
| K/1309–39 | Foot Swab | 12 | blaNDM-1, blaIMP-8 |
| K/1309–38 | Urine | 4 | blaKPC-2, blaOXA-48 |
Carbon source utilization, osmolarity and pH response assay
Growth of the three strains in various carbon substrates, pH and osmolarity conditions were observed using the Biolog Phenotype Microarrays (Biolog, Inc., Hayward, CA, USA). The strains were tested with and without sub-lethal imipenem treatment; where the untreated samples were used as controls. The Biolog 96-well PM plates were used to determine the carbon utilization (PM1 and PM2A), osmolarity (PM9) and pH (PM10) of each untreated and imipenem-treated CRKP strain.
Briefly, the strains were grown overnight in Luria Bertani (LB) plates with and without sub- lethal concentrations of imipenem (Gold Biotechnology, USA) (K/1310–33, 32μg/ml; K/1309–39, 12μg/ml; K/1309–38, 4μg/ml). Three to five isolated colonies were carefully picked using sterile cotton swabs and re-suspended into Biolog IF-0 inoculating fluid with 1% Biolog Dye A to achieve 85% transmittance using a turbidimeter. A total of 100µl of the bacterial suspension was added into each well of each PM plate [16]. The PM plates were incubated at 37ºC for 48 hours in an Omnilog incubator reader (Biolog, Inc., Hayward, CA, USA). The respiration rate was measured by the reduction of tetrazolium dye every 15 minutes during the incubation period.
The data was then analyzed using the Kinetic Plot module of the Omnilog Phenotype Microarray software suite (version 16 June 2003, Biolog Inc, Hayward, CA, USA). The experiment was conducted in duplicates and any wells with incomparable results between the duplicates were excluded from further analysis. For carbon source utilization assay (PM1 and PM2), values of the total area under the growth curve which are higher than 10,000 were indicated as ‘growth’ while values less than 10,000 were indicated as ‘no growth’. As for osmolarity and pH response assay (PM9 and PM10), bar plots were constructed using the total area under the growth curve obtained from each well to compare the growth rates of each strain; both untreated and imipenem-treated under different concentrations of osmolytes and pH conditions.
Bacterial cell harvesting for transcriptomics and metabolomics analysis
Strain K/1309–39 harboring blaNDM-1 was further subjected to transcriptomic and metabolomic analysis. There has been a rapid increase in reports of bacteria harboring this gene worldwide but the gene response and metabolism of this virulent gene is not widely studied. Thus, it would be useful to obtain information which may shed some light into its rapid dissemination. Furthermore, this strain displayed growth in an additional of eight carbon sources and has the ability to grow at almost similar rates in both untreated and after imipenem treatment in various osmolarities compared to the other two blaKPC-2 harboring strains in this study.
Two sets of cells were prepared for both transcriptomics and metabolomics analysis. One without addition of antibiotic and another with sub-lethal concentrations of imipenem (Gold Biotechnology, USA). Untreated samples were used as controls. Briefly, overnight culture was diluted 1:100 with fresh LB broth for the untreated set while the set with antibiotic supplementation was prepared by diluting overnight culture with LB broth under sub-lethal concentrations of imipenem (12μg/ml). Both sets were grown at 37ºC with agitation of 200rpm to mid log phase (an optical density of approximately 0.6–0.7 at 600nm wavelength).
RNA extraction
A total of 100μl of both imipenem-treated and untreated bacterial cells were harvested by centrifugation at 12,000 rpm in 4ºC for transcriptomics analysis. An analysis for both sets of bacterial cells was performed in biological triplicates. RNA was extracted from the harvested cell pellets using RNeasy minikit (Qiagen, Netherlands) treated with DNase (Qiagen, Netherlands) to reduce DNA contamination and quantified using Qubit ® RNA High Sensitivity assay (Life Technologies, Thermo Fisher Scientific Inc.) on a Qubit ® 3.0 fluorimeter (Life Technologies, Thermo Fisher Scientific Inc.). The RNA integrity was analyzed using Picochip assay (Agilent Technologies, Santa Clara, CA, USA) on an Agilent 2100 bioanalyzer) (Agilent Technologies, Santa Clara, CA, USA) prior to the start of RNA-Seq library preparation. Samples with an RNA integrity number (RIN) of > 6.5 were used for subsequent RNA-Seq.
RNA-Seq library preparation and RNA-Sequencing
About 3μg of total RNA was used for the preparation of strand specific RNA transcriptome sequencing (RNA-Seq) library. The rRNA was depleted using Ribo-ZeroTM kit (bacteria) (Epicentre, Madison, WI) while cDNA synthesis and RNA-Seq library was developed using ScriptSeqTM v2 RNA-Seq Library Preparation kit (Epicentre, Madison, WI). ScriptSeqTM Index PCR primer (Epicentre, Madison, WI) was added in the PCR mixture to create a unique barcode for each sample. All libraries were validated and quantified using High Sensitivity DNA chip (Agilent Technologies, Santa Clara, CA) using Agilent 2100 bioanalyzer (Agilent Technologies, Santa Clara, CA) and Qubit ® DNA High Sensitivity assay (Life Technologies, Thermo Fisher Scientific Inc.) using Qubit ® 3.0 fluorimeter (Life Technologies, Thermo Fisher Scientific Inc.) prior to sequencing. The RNA-Seq library was sequenced on the MiSeq platform (Illumina, San Diego, California, USA) using a paired-end protocol and read lengths of 75bp.
Data pre-processing and comparative transcriptomics analysis
The FASTQ files obtained were subjected to sequencing adapter trimming and base quality (Q ≥ 20) trimming using BBDuk (BBTools version 36) from the BBMap package (http://sourceforge.net/projects/bbmap/) (trimq = 20, ref = phix.fa, minlen = 35). In addition, trimmed reads of less than 35bp were also discarded with its pair. The good quality reads were mapped to the publicly available reference genome, K. pneumoniae strain 002SK2 Genbank accession number CP025515.1 using HISAT2 (version 2.1.0) [17]. Default settings were used with the exception of – mp = 6.2, – no-spliced-alignment = yes and – fr/–rf/–ff) = fr. K. pneumoniae strain 002SK2 was used as a reference genome because it is of sequence type, ST147 and harbored blaNDM which is similar to the studied strain, K/1309–39.
Expression quantification and profiling was performed for the mapped reads using featureCounts of the Subread package (version 1.4.6) [18] under default settings with the exception of -s = 0, -M: yes, -Q = 20 and -p: yes. The expression profiles were used to generate sample distance clustering matrix and principal component analysis (PCA) plot to assess profile similarity between intergroup and intragroup replicates. CummeRbund (R package version 2.6.1) (http://bioconductor.org/packages/release/bioc/html/cummeRbund.html/) [19] was used to generate these plots for replicates quality assessment. Consistent biological replicates would cluster intragroup samples together while exhibiting a clear separation between intergroup samples in the plots generated. Any non-consistent replicates would be excluded from further analysis.
Pair-wise differential expression and related statistical testing for significance were analyzed using the negative binomial distribution with significant FDR cut-off 0.05 (DESeq2 version 3.2) [20]. Positive log2fold change indicates gene upregulation while negative values denote gene downregulation in the imipenem-treated K. pneumoniae.
NMR sample preparation and 1H NMR spectroscopy
The two sets of bacterial pellets harvested at mid log phase were washed twice with phosphate buffered saline (PBS) before it was homogenized with 1ml of phosphate buffer (90% D2O, 1mM 3-trimethylsilyl-1-[2,2,3,3-2H4] propionate (TSP) and 3mM sodium azide; pH 7.4). The homogenates were sonicated for 30 minutes to lyse the bacterial cells and then centrifuged at 13,000rpm for 10 minutes at 4ºC. Approximately 600μl of supernatant was transferred to a 5mm (outer diameter) NMR tube (Norell, USA) for subsequent NMR analysis on a Bruker 600 MHz spectrometer (Bruker Biospin, Fallenden, Switzerland) with a 5mm BBO probe operating at 600.13 MHz (ambient probe temperature 300K).
A standard 1-dimensional (1D) 1H NMR spectrum locked on D2O solvent was carried out to achieve satisfactory water suppression of each sample. A total of 32 scans were accumulated into 65K complex points over relaxation delay of 4s and mixing time of 0.01s. Spectral width of 12,019Hz with an acquisition time of 2.73s was used for each sample.
1H NMR data processing and analysis
Phasing and baseline correction of the 1H NMR spectra were performed manually using Bruker TopSpin (version 3.1, Bruker Biospin, Fallenden, Switzerland). The spectra were referenced to the TSP resonance at δ 0.00. Spectra were digitized into 7K datapoints using an in-house developed MATLAB (version R2011B, Natick, USA) script (O. Cloarec, Imperial College London). The regions containing water resonances (δ 4.6 – 5.0) and the regions δ 0.0 – 0.5 and δ 8.5 – 10.0 in the bacterial spectra which contain only noise were excluded from the analysis. For each spectrum, normalization to the total sum of the residual spectrum was carried out prior to pattern recognition analysis followed by scaling of the data to unit variance.
The metabolites were identified using available references from Human Metabolome Database (HMDB) and existing literature [21–24].
Results
Phenotypic responses of carbapenem resistant K. pneumoniae (CRKP) after exposure to imipenem
All three CRKP strains utilized a wide range of amino acids, carbohydrates and carboxylic acids but were selective in the utilization of alcohol, amide, ester and polymer. Generally, these strains demonstrated better carbon utilization after exposure to imipenem. Carbohydrates such as 3-θ-β-D-Galactopyranosyl-D-Arabinose, D-Raffinose and stachyose were metabolized by K/1310–33 and K/1309–38 only after exposure to imipenem. It is noteworthy that K/1310–33 and K/1309–38 belonging to the same sequence type (ST), ST101 and harboring blaOXA-48 and blaKPC-2 showed varying carbon utilization. Maltitol and turanose were metabolized by K/1310–33 after imipenem treatment but these carbons were metabolized by K/1309–38 only in imipenem-free cells. After imipenem treatment, carboxylic acid metabolism for D-Malic acid and 4-Hydroxybenzoic acid were disrupted in K/1310–33 while amino acid utilization (L-Arginine, Hydroxyl-L-Proline, L-Phenylalanine) ceased in K/1309–38. In contrast, K/1309–39, a ST147 strain which harbored blaNDM-1 and blaIMP-8 exhibited similar carbon utilization regardless of the presence or absence of imipenem treatment (with the exception of palatinose, D-raffinose and β-hydroxybutryric acid) but did not utilize fatty acids (Tween 20, Tween 40, Tween 80) unlike K/1310–33 and K/1309–38 (Supplementary Table 1).
Imipenem-treated bacterial cells generally exhibited lower growth rates as compared to imipenem-free cells across a majority of the osmolarity and pH tested in PM9 and PM10. It was noted that the bacterial cell growth decreases as the concentration of osmolytes increases with the exception of cells grown in the highest concentration of sodium lactate, sodium formate and ammonium sulphate at pH8 (Supplementary Figure 1). Growth rates under various single carbon sources were higher at pH9.5 as compared to pH4.5 in both imipenem-treated and untreated cells. When considered separately, imipenem-treated K/1310–33 showed higher growth rates in L-tyrosine and agmatine at pH9.5 while imipenem-treated K/1309–38 showed higher growth rates in L-leucine, L-norleucine, cadaverine and histamine at pH9.5 in addition to the two carbon sources (Supplementary Figure 2).
Overview of RNA-Seq data
Approximately 1.70–3.68% (51,276–77,029 reads) of low-quality reads were discarded. The remaining good quality sequences showed concordant alignment rates of 79.43–82.63% and overall alignment rates of 81.30–90.14% to the reference genome, K. pneumoniae strain 002SK2 (Supplementary Table 2). During replicate quality assessment, one of the triplicates from the untreated group was discarded from further analysis due to inconsistency. A dendogram of sample distances and clustering matrix (Figure 1(a)) showed consistent biological replicates clustering among intragroup replicates and exhibiting clear separation between untreated and imipenem-treated replicates while the coordinates on principal component analysis (PCA) plot, (Figure 1(b)) signifies high similarity between the samples of similar profiles indicating consistent intragroup replicates. The raw reads obtained were deposited at NCBI SRA database with the accession number PRJNA493659 (https://www.ncbi.nlm.nih.gov/sra/PRJNA493659).
Figure 1.
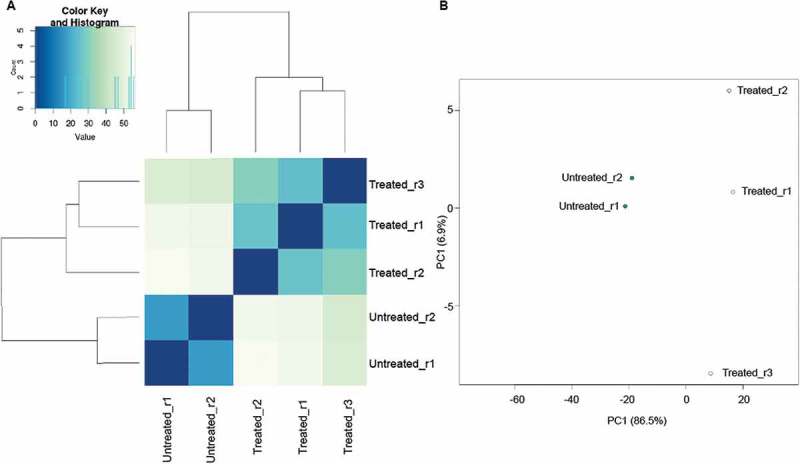
Similarity between groups of replicates of imipenem-treated and untreated K/1309–39.
(a) Dendogram of sample distances and clustering matrix profiles between biological replicates of imipenem-treated and untreated K/1309–39 (b) PCA plot showing similarity among biological replicates and differences between imipenem-treated and untreated K/1309–39.
Differential gene expression after sub-lethal imipenem treatment
A total of 2,048 genes were differentially expressed after imipenem treatment. Among them, 1,101 genes were significantly upregulated while 947 genes were significantly downregulated in imipenem-treated cells (Supplementary Table 3). The upregulated genes included those involved in transmembrane transport as well as aromatic hydrocarbon transport and metabolism. Conversely, the downregulated genes were mainly those responsible for translation, ribosomal structure and biogenesis as well as lipid, amino acid and nucleotide transport and metabolism (Table 2).
Table 2.
Differentially expressed genes organized by functional category.
| Gene category by function | No (%) of genes with significant expression after treatment vs no treatment |
|
|---|---|---|
| Up regulated | Down regulated | |
| Cellular process and signaling | ||
| Cell wall and cell membrane biogenesis | 25 (1.22) | 50 (2.44) |
| Cell cycle control, cell divison, chromosome partitioning |
3 (0.15) | 18 (0.88) |
| Intracellular trafficking, secretion and vesicular transport | 207 (10.11) | 66 (3.22) |
| Energy production and conversion | 67 (3.27) | 81 (3.96) |
| Defense mechanisms | 12 (0.59) | () 19 (0.93) |
| Cell adhesion and motility | 30 (1.46) | 1 (0.05) |
| Information storage and processing | ||
| Translation, ribosomal structure and biogenesis | 11 (0.54) | 94 (4.59) |
| Transcription | 79 (3.86) | 85 (4.15) |
| Replication, recombination and repair | 20 (0.98) | 23 (1.12) |
| DNA topological changes | 1 (0.05) | 7 (0.34) |
| Metabolism | ||
| Amino acid transport and metabolism | 51 (2.49) | 72 (3.52) |
| Nucleotide transport and metabolism | 10 (0.49) | 30 (1.46) |
| Carbohydrate transport and metabolism | 77 (3.76) | 58 (2.83) |
| Lipid transport and metabolism | 7 (0.34) | 27 (1.32) |
| Co-enzyme and co-factor transport and metabolism | 2 (0.10) | 11 (0.54) |
| Organic and inorganic compound transport and metabolism | 33 (1.61) | 37 (1.81) |
| Aromatic compound transport and metabolism | 11 (0.54) | 1 (0.05) |
| Iron and heme transport and metabolism | 28 (1.37) | 14 (0.68) |
| Vitamin transport and metabolism | 12 (0.59) | 14 (0.68) |
| Poorly characterized | ||
| General function prediction only | 225 (10.99) | 176 (8.60) |
| Hypothetical protein | 190 (9.28) | 63 (3.08) |
Furthermore, central carbon metabolism genes encoding glycolysis (aceEF, pckA, pyk) and tricarboxylic acid (TCA) cycle (acnAB, gltA, sdhB) (Figure 2(a)) were suppressed after imipenem treatment. In addition, genes responsible for nucleotide metabolism (purHU, pyrG) (Figure 2(b)) and cell division (ftsZ, minD) (Figure 2(c)) were also downregulated after exposure to sub-lethal concentrations of imipenem.
Figure 2.
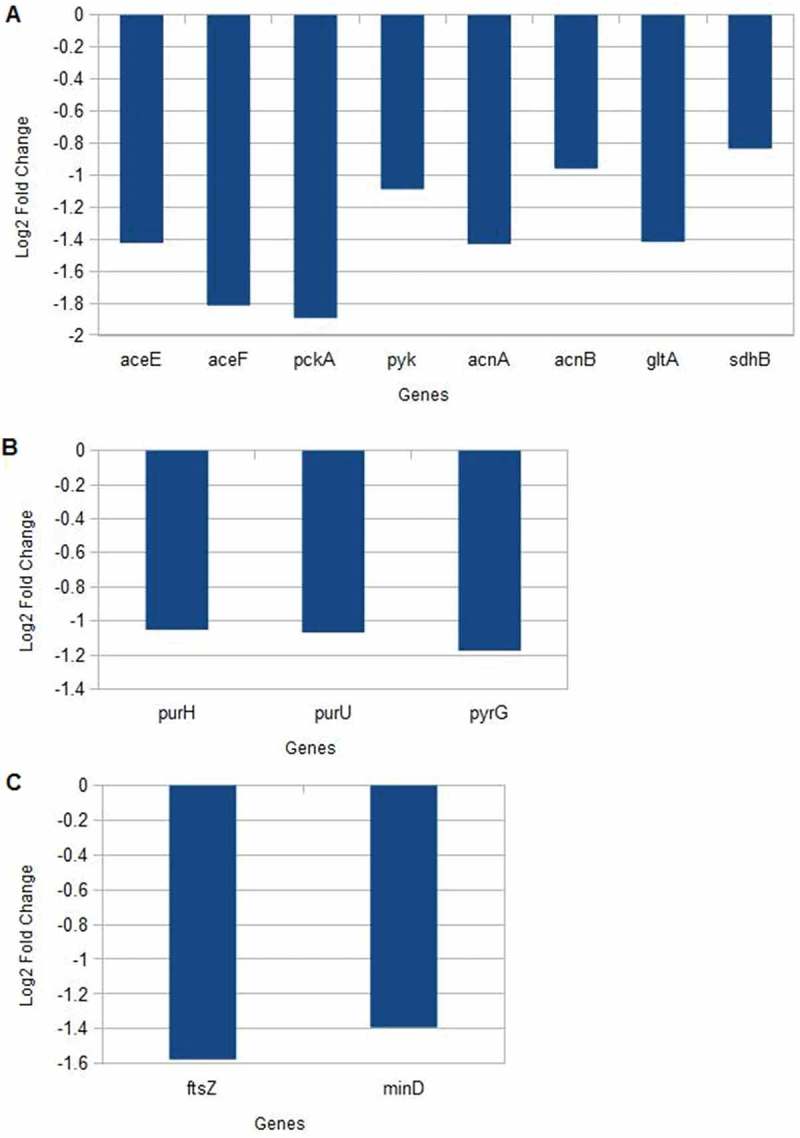
Gene expression levels after exposure to imipenem.
(a) Central Carbon Metabolism (b) Nucleotide metabolism (c) Cell division.
Differential metabolite expression after sub-lethal imipenem concentration treatment
Amino acids including alanine, methionine, glycine, tyrosine and bacteria metabolic end products such as succinate, pyruvate, acetate were the major metabolites detected in the selected carbapenem resistant K. pneumoniae strain (K/1309–39). Between the untreated and imipenem-treated cells, higher levels of bacterial metabolic end products (acetate, pyruvate, succinate, formate) and nucleotide metabolism (uracil, hypoxanthine and xanthine) were detected in the former while higher glycerolphosphocholine levels were detected in the latter. Separately, FAPγ-adenine and methyladenine were undetectable after imipenem treatment but anserine was detected only after exposure to imipenem (Figure 3(a,b)).
Figure 3.
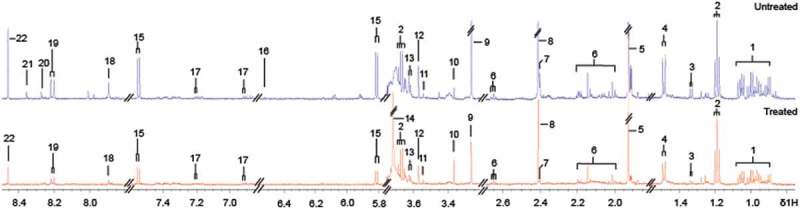
Comparison of 1H NMR spectra of imipenem-treated and untreated K/1309–39.
1, branched chain amino acid (BCAA); 2, ethanol; 3, threonine; 4, alanine; 5, acetate; 6, methionine; 7, pyruvate; 8, succinate; 9, trimethylamine-N-oxide (TMAO); 10, glycerophosphocholine; 11, phenylacetate; 12, glycine; 13, valine; 14, anserine; 15, uracil; 16, fumarate; 17, tyrosine; 18, xanthine; 19, hypoxanthine; 20, methyladenine; 21, FAPγ-adenine; 22, formate.
Discussion
Phenotypic responses of the three strains (two blaKPC-2 and one blaNDM-1) harboring carbapenemase genes that contribute to the spread of antibiotic resistance were studied. The carbon utilization results obtained from the phenotype microarray study showed that the imipenem-treated carbapenem resistant K. pneumoniae (CRKP) are more efficient in using carbon sources for growth as compared to the untreated cells. K/1310–33 and K/1309–38 acquired the ability to metabolize plant-derived carbohydrates, 3-θ-β-D-Galactopyranosyl-D-Arabinose, D-raffinose and stachyose only after exposure to imipenem. The introduction of antibiotic as a stressor to CRKP may also cause carbon accumulation to counter stress and to rapidly mobilize nutrients for growth when environmental conditions improves [25]. Our data is in agreement with Fabich et al. [26] who reported better carbon utilization in bacterial pathogens as compared to the commensal strain. In a separate study, glucose, the preferred carbon sources for E. coli could become one of the worst carbon sources for growth under poor nitrogen sources [27].
Furthermore, bacterial strains that are genetically related may not expresst similar phenotypic characteristics, particularly in the presence of sub-inhibitory drug concentration [28]. This was evidenced by K/1310–33 and K/1309–38 which were genotypically similar (ST101, same pulsotype and both harboring blaOXA-48 and blaKPC-2) but showed differences in carbon utilization both in imipenem-treated and untreated cells.
All untreated bacterial samples showed higher growth rates as compared to the imipenem-treated samples across the tested osmolarity and pH range. Exposure to bactericidal antibiotics are known to stimulate hydroxyl radical formation via rapid depletion of NADH in the TCA cycle and destabilization of ferrous iron in the Fenton reaction which eventually results in cell death [29]. CRKP growth with various carbons at pH9.5 was higher as compared to growth at pH4.5 for both imipenem-treated and untreated cells. This could be due to the presence of monovalent cation or proton antiporters involved in alkaliphily in these pathogenic strains since many natural habitats for microbes have high pH [30].
To further investigate the gene expression and metabolism of carbapenem resistant bacteria after imipenem exposure, K/1309–39, a ST147 strain which harbored blaNDM-1 was selected. This strain demonstrated a wider range of carbon utilization, osmolarity and pH adaptation in comparison to K/1310–33 and K/1309–38.
Increases in glycerophosphocholine levels and the presence of anserine, a metabolite known to exhibit antioxidant activities [31,32] were detected after imipenem treatment. This could indicate that anserine is a metabolite secreted after imipenem treatment to counteract oxidative damage by antibiotics. Similarly, genes involved in histidine metabolism (hutHU) were downregulated after imipenem treatment thus, resulting in accumulation of anserine in bacterial cell. Meanwhile glycerophospholine, an organic osmolyte involved in osmoregulation and osmoprotection [33] was accumulated as a strategy adopted by bacterial cells to combat stress. This is supported by the observation of downregulation of glpTU genes which are involved in transport of glycerophosphodiester glycerophosphocholine [34]. The suppression of these genes may result in the accumulation of glycerophospholine in the bacterial cell since it was not cleaved to glycerol-3-phosphate and choline.
However, the levels of amino acid (branched chain amino acids, alanine and glycine) and bacterial end products (acetate, pyruvate, succinate, formate) were suppressed after imipenem treatment. Similarly, most genes responsible for amino acid metabolism and central carbon metabolism genes encoding glycolysis (aceEF, pckA, pyk) and TCA cycle (acnAB, gltA, sdhB) were also downregulated after imipenem treatment. The reduced expression of these primary metabolism genes may be due to the increased concentrations of hydroxyl radicals [35] which disrupts the pathways of primary metabolism. This is in agreement with Ramos et al. [36], who reported the disruption of metabolic pathways such as TCA cycle and NADH oxidation in K. pneumoniae cells treated with polymyxin B.
FAPγ-adenine and methyladenine were only detected in CRKP before imipenem treatment and the levels of other nucleotide metabolites (uracil, hypoxanthine and xanthine) were higher in untreated cells suggesting diminishing nucleotide building block pool after imipenem treatment. This indicated that the antibiotic exposure inflicted DNA damage in the bacterial cell and disrupted cell division since the expression of purHU (purine metabolism genes), pyrG (pyrimidine metabolism genes) and ftsZ, minD (genes responsible for cell division) were suppressed [37–39]. In addition, it was noted that the expression of DNA repair genes recA, tisB were downregulated after being treated with sub-lethal concentrations of imipenem. The treatment of antibiotic resistant bacteria with sub-lethal concentrations of antibiotic may further increase error-prone DNA replication by suppressing these DNA repair genes [40,41], thus increasing mutation rates which may contribute to multi-drug resistance.
In conclusion, CRKP exhibits decreased central carbon and nucleotide metabolism and reduction in cell division activities when exposed to sub-lethal concentrations of imipenem. These responses illustrated the strategies used by CRKP to survive and proliferate in the presence of antibiotic. Understanding the survival mechanism of CRKP is essential for designing new treatment options that can enhance the effects of antibiotics. The combined gene expression and metabolism profiles of this CRKP strain harboring blaNDM-1 also provided further insight into the global regulatory network system of a multidrug resistant bacteria. Integration of biological data is helpful since it describes the various aspects of cellular function concurrently to address a wide range of biological problems.
Funding Statement
This study is supported by Fundamental Research Grant Scheme (FRGS) from the Ministry of Education, Malaysia (Grant number: FP023-2014A). University of Malaya Research Grant (UMRG) from University of Malaya (Grant number: RP026B-14HTM).
Disclosure statement
No potential conflict of interest was reported by the authors.
Supplementary material
Supplementary data for this article can be accessed here.
References
- [1].Hendrik TC, Voor in ‘T Holt AF, Vos MC.. Clinical and molecular epidemiology of extended-spectrum-beta-lactamase producing Klebsiella spp.: A systematic review and meta-analyses. PLoS One. 2015;10(10):e0140754. [DOI] [PMC free article] [PubMed] [Google Scholar]
- [2].Haller S, Eller C, Hermes J, et al. What caused the outbreak of ESBL-producing Klebsiella pneumoniae in a neonatal intensive care unit, Germany 2009 to 2012? Reconstructing transmission with epidemiological analysis and whole-genome sequencing. BMJ Open. 2015;5(5):e007397. [DOI] [PMC free article] [PubMed] [Google Scholar]
- [3].Campos AC, Albiero J, Ecker AB, et al. Outbreak of Klebsiella pneumoniae carbapenemase-producing K pneumoniae: A systematic review. Am J Infect Control. 2016;44(11):1374–1380. [DOI] [PubMed] [Google Scholar]
- [4].Cuzon G, Naas T, Truong H, et al. Worldwide diversity of Klebsiella pneumoniae that produce beta-lactamase blaKPC-2 gene. Emerg Infect Dis. 2010;16(9):1349–1356. [DOI] [PMC free article] [PubMed] [Google Scholar]
- [5].Tzouvelekis LS, Markogiannakis A, Psichogiou M, et al. Carbapenemases in Klebsiella pneumoniae and other Enterobacteriaceae: an evolving crisis of global dimensions. Clin Microbiol Rev. 2012;25(4):682–707. [DOI] [PMC free article] [PubMed] [Google Scholar]
- [6].Lascols C, Peirano G, Hackel M, et al. Surveillance and molecular epidemiology of Klebsiella pneumoniae isolates that produce carbapenemases: first report of OXA-48-like enzymes in North America. Antimicrob Agents Chemother. 2013;57(1):130–136. [DOI] [PMC free article] [PubMed] [Google Scholar]
- [7].Kitchel B, Rasheed JK, Endimiani A, et al. Genetic factors associated with elevated carbapenem resistance in KPC-producing Klebsiella pneumoniae. Antimicrob Agents Chemother. 2010;54(10):4201–4207. [DOI] [PMC free article] [PubMed] [Google Scholar]
- [8].Johnson AP, Woodford N. Global spread of antibiotic resistance: the example of New Delhi metallo-beta-lactamase (NDM)-mediated carbapenem resistance. J Med Microbiol. 2013;62(Pt 4):499–513. [DOI] [PubMed] [Google Scholar]
- [9].Nordmann P, Naas T, Poirel L. Global spread of Carbapenemase-producing Enterobacteriaceae. Emerg Infect Dis. 2011;17(10):1791–1798. [DOI] [PMC free article] [PubMed] [Google Scholar]
- [10].Lambert G, Kussell E. Memory and fitness optimization of bacteria under fluctuating environments. PLoS Genet. 2014;10(9):e1004556. [DOI] [PMC free article] [PubMed] [Google Scholar]
- [11].Lobritz MA, Belenky P, Porter CBM, et al. Antibiotic efficacy is linked to bacterial cellular respiration. Proc Natl Acad Sci USA. 2015;112(27):8173–8180. [DOI] [PMC free article] [PubMed] [Google Scholar]
- [12].Tamma PD, Cosgrove SE, Maragakis LL. Combination therapy for treatment of infections with gram-negative bacteria. Clin Microbiol Rev. 2012;25(3):450–470. [DOI] [PMC free article] [PubMed] [Google Scholar]
- [13].Kumar A, Zarychanski R, Light B, et al. Early combination antibiotic therapy yields improved survival compared with monotherapy in septic shock: a propensity-matched analysis. Crit Care Med. 2010;38(9):1773–1785. [DOI] [PubMed] [Google Scholar]
- [14].Low YM, Yap PS, Abdul Jabar K, et al. The emergence of carbapenem resistant Klebsiella pneumoniae in Malaysia: correlation between microbiological trends with host characteristics and clinical factors. Antimicrob Resist Infect Control. 2017;6:5. [DOI] [PMC free article] [PubMed] [Google Scholar]
- [15].Clinical and Laboratory Standards Institute (CLSI) M100-S25: performance standards for antimicrobial susceptibility testing. Twenty-Fifth Inter Suppl. 2015;35:45–50. [Google Scholar]
- [16].Shea A, Wolcott M, Daefler S, et al. Biolog phenotype microarrays. Methods Mol Biol. 2012;881:331–373. [DOI] [PubMed] [Google Scholar]
- [17].Kim D, Langmead B, Salzberg SL. HISAT: a fast spliced aligner with low memory requirements. Nat Methods. 2015;12(4):357–360. [DOI] [PMC free article] [PubMed] [Google Scholar]
- [18].Liao Y, Smyth GK, Shi W. featureCounts: an efficient general purpose program for assigning sequence reads to genomic features. Bioinformatics. 2014;30(7):923–930. [DOI] [PubMed] [Google Scholar]
- [19].Goff L, Trapnell C CummeRbund: Kelley D. Visualization and exploration of Cufflinks high-throughput sequencing data, 2014; R package version 2.6.1. doi: 10.18129/B9.bioc.cummeRbund [DOI]
- [20].Love MI, Huber W, Anders S. Moderated estimation of fold change and dispersion for RNA-seq data with DESeq2. Genome Biol. 2014;15(12):550. [DOI] [PMC free article] [PubMed] [Google Scholar]
- [21].Bundy JG, Willey TL, Castell RS, et al. Discrimination of pathogenic clinical isolates and laboratory strains of Bacillus cereus by NMR-based metabolomic profiling. FEMS Microbiol Lett. 2005;242(1):127–136. [DOI] [PubMed] [Google Scholar]
- [22].Jacobs DM, Deltimple N, van Velzen E, et al. 1H NMR metabolite profiling of feces as a tool to assess the impact of nutrition on the human microbiome. NMR Biomed. 2008;21(6):615–626. [DOI] [PubMed] [Google Scholar]
- [23].Martin FPJ, Sprenger N, Yap IKS, et al. Panorganismal gut microbiome-host metabolic crosstalk. J Proteome Res. 2009;8(4):2090–2105. [DOI] [PubMed] [Google Scholar]
- [24].Li J, Huang C, Zheng D, et al. CcpA-mediated enhancement of sugar and amino acid metabolism in Lysinibacillus sphaericus by NMR-based metabolomics. J Proteome Res. 2012;11(9):4654–4661. [DOI] [PubMed] [Google Scholar]
- [25].Rittershaus ES, Baek SH, Sassetti CM. The normalcy of dormancy: common themes in microbial quiescence. Cell Host Microbe. 2013;13(6):643–651. [DOI] [PMC free article] [PubMed] [Google Scholar]
- [26].Fabich AJ, Jones SA, Chowdhury FZ, et al. Comparison of carbon nutrition for pathogenic and commensal Escherichia coli strains in the mouse intestine. Infect Immun. 2008;76(3):1143–1152. [DOI] [PMC free article] [PubMed] [Google Scholar]
- [27].Bren A, Park JO, Towbin BD, et al. Glucose becomes one of the worst carbon sources for E.coli on poor nitrogen sources due to suboptimal levels of cAMP. Sci Rep. 2016;6:24834. [DOI] [PMC free article] [PubMed] [Google Scholar]
- [28].Bergmiller T, Andersson AMC, Tomasek K, et al. Biased partitioning of the multidrug efflux pump AcrAB-TolC underlies long-lived phenotypic heterogeneity. Science. 2017;356(6335):311–315. [DOI] [PubMed] [Google Scholar]
- [29].Kohanski MA, DePristo MA, Collins JJ. Sublethal antibiotic treatment leads to multidrug resistance via radical-induced mutagenesis. Mol Cell. 2010;37(3):311–320. [DOI] [PMC free article] [PubMed] [Google Scholar]
- [30].Krulwich TA, Sachs G, Padan E. Molecular aspects of bacterial pH sensing and homeostasis. Nat Rev Microbiol. 2011;9(5):330–343. [DOI] [PMC free article] [PubMed] [Google Scholar]
- [31].Bellia F, Vecchio G, Rizzarelli E. Carnosinases, their substrates and diseases. Molecules. 2014;19(2):2299–2329. [DOI] [PMC free article] [PubMed] [Google Scholar]
- [32].Kohen R, Yamamoto Y, Cundy KC, et al. Antioxidant activity of carnosine, homocarnosine, and anserine present in muscle and brain. Proc Natl Acad Sci USA. 1998;85(9):3175–3179. [DOI] [PMC free article] [PubMed] [Google Scholar]
- [33].Zhang W, Tan NG, Li SF. NMR-based metabolomics and LC-MS/MS quantification reveal metal-specific tolerance and redox homeostasis in Chlorella vulgaris. Mol Biosyst. 2014;10(1):149–160. [DOI] [PubMed] [Google Scholar]
- [34].Grosshennig S, Schmidl SR, Schmeisky G, et al. Implication of glycerol and phospholipid transporters in Mycoplasma pneumoniae growth and virulence. Infect Immun. 2013;81(3):896–904. [DOI] [PMC free article] [PubMed] [Google Scholar]
- [35].Sobota JM, Imlay JA. Iron enzyme ribulose-5-phosphate 3-epimerase in Escherichia coli is rapidly damaged by hydrogen peroxide but can be protected by manganese. Proc Natl Acad Sci USA. 2011;108(13):5402–5407. [DOI] [PMC free article] [PubMed] [Google Scholar]
- [36].Ramos PIP, Custódio MGF, Saji GRQ, et al. The polymyxin B-induced transcriptomic response of a clinical, multidrug-resistant Klebsiella pneumoniae involves multiple regulatory elements and intracellular targets. BMC Genomics. 2016;17(Suppl8):737. [DOI] [PMC free article] [PubMed] [Google Scholar]
- [37].Miller C, Thomsen LE, Gaggero C, et al. SOS response induction by beta-lactams and bacterial defense against antibiotic lethality. Science. 2004;305(5690):1629–1631. [DOI] [PubMed] [Google Scholar]
- [38].Foti JJ, Devadoss B, Winkler JA, et al. Oxidation of the guanine nucleotide pool underlies cell death by bactericidal antibiotics. Science. 2012;336(6079):315–319. [DOI] [PMC free article] [PubMed] [Google Scholar]
- [39].Belenky P, Ye JD, Porter CBM, et al. Bactericidal antibiotics induce toxic metabolic perturbations that lead to cellular damage. Cell Rep. 2015;13(5):968–980. [DOI] [PMC free article] [PubMed] [Google Scholar]
- [40].Long H, Miller SF, Strauss C, et al. Antibiotic treatment enhances the genome-wide mutation rate of target cells. Pnas. 2016;113(18):E2498–2505. [DOI] [PMC free article] [PubMed] [Google Scholar]
- [41].Mandsberg LF, Macia MD, Bergmann KR, et al. Development of antibiotic resistance and up-regulation of the antimutator gene pfpI in mutatar Pseudomonas aeruginosa due to inactivation of two DNA oxidative repair genes (mutY, mutM). FEMS Microb Lett. 2011;324(1):28–37. [DOI] [PubMed] [Google Scholar]
Associated Data
This section collects any data citations, data availability statements, or supplementary materials included in this article.