Abstract
Aims
Heart failure (HF) and diabetes mellitus (DM) often coexist and have bidirectional association. Advanced HF is associated with worsened glycaemic control. This meta‐analysis investigated the effects of left ventricular assist device (LVAD) implantation on markers of DM control.
Methods and results
We performed a systematic search of MEDLINE and Cochrane through October 2017 to identify studies evaluating advanced HF patients who had received an LVAD and reported markers of glycaemic control. The primary outcome was glycosylated haemoglobin A1c (HbA1c), and the secondary outcomes included fasting glucose, daily insulin requirements, and body mass index (BMI). Outcomes were pooled using a Hartung–Knapp random‐effects model producing a mean difference (MD) and 95% confidence interval (CI). Thirteen studies, including 820 participants, were included. HbA1c was 1.23% lower following LVAD implantation (95% CI −1.49 to −0.98). Greater HbA1c reductions were seen with higher pre‐LVAD values. Similarly, fasting plasma glucose (−24.4 mg/dL, 95% CI −33.4 to −15.5), daily insulin requirements (−18.8 units, 95% CI −28.8 to −8.7), and serum creatinine levels (MD −0.20, 95% CI −0.35 to −0.06) were significantly lower than pre‐LVAD levels. We saw no difference in BMI (MD 0.09, 95% CI −1.24 to 1.42).
Conclusions
LVAD implantation was associated with significant improvement in HbA1c, fasting plasma glucose, and daily insulin need in advanced HF patients.
Keywords: Left ventricular assist device, Diabetes mellitus, Mechanical circulatory support, Insulin, Insulin resistance, Body mass index, Meta‐analysis
Introduction
Heart failure (HF) and diabetes mellitus (DM) have a causal relationship to one another and are often coexistent.1 The risk of developing HF is 2.4‐ and 5‐fold higher in diabetic men and women, respectively. HF itself, owing to poor perfusion and cardiac output, can lead to insulin resistance and poor glycaemic control secondary to hormonal dysregulation and inflammation.2
Mortality rates are higher in HF patients with DM compared with non‐DM especially peri‐operatively.3 The implantation of a left ventricular assist device (LVAD) is becoming the therapy of choice in advanced HF patients as either a bridge to transplantation or destination therapy.4 LVADs normalize haemodynamics and cardiac output and improve tissue perfusion,5 which in turn may improve glycaemic control and lower the need for anti‐diabetic medication use.6
While studies have investigated changes in glycaemic control following LVAD implantation in advanced HF patients, the magnitude of change varies, and few studies look at changes that may help explain these glycaemic improvements. Thus, the objective of this study was to systematically evaluate the literature assessing the impact of LVAD implantation on glycaemic control and insulin requirement in patients with advanced HF. We also aimed to look at relationships between improvements in long‐term control and other glycaemic measures.
Methods
This meta‐analysis conforms to standard guidelines and is written in accordance with the Preferred Reporting Items for Systematic Reviews and Meta‐Analyses statement.7
Data sources and search strategy
We systematically searched MEDLINE and Scopus from their inception through 20 October 2017. The following Medical Subject Headings and keywords were used: diabetes; diabetes mellitus; type II diabetes mellitus; insulin; insulin resistance; hemoglobin A, glycosylated; haemoglobin A1c; blood glucose; heart assist device, left ventricular assist device; lvad; and mechanical circulatory support. Citations were limited to those published in English. We also performed a manual search of references from included studies as well as proceedings from related conferences over the prior 3 years.
Study selection
Two authors independently reviewed all potentially relevant articles in a parallel manner by using pre‐defined inclusion criteria. Studies were included if they met the following criteria: (i) enrolled human subjects in an original investigation, (ii) included adult patients (>18 years of age) with advanced HF receiving mechanical circulatory support with an LVAD, and (iii) reported data on changes in the desired outcomes after LVAD implantation. For studies that reported outcomes on patients with pre‐existing diabetes, no differentiation was made between those with Type 1 or Type 2 disease. We excluded studies if there were case reports, reviews, editorials, and non‐English publications. The primary outcome was the difference in glycosylated haemoglobin A1c (HbA1c) before vs. after LVAD implantation. Secondary outcomes included changes in fasting plasma glucose, daily insulin requirements, body mass index (BMI), and serum creatinine.
Data extraction and risk of bias assessment
For each study, two independent authors used a standardized data abstraction tool to extract all the relevant and specific information. We resolved disagreements by consensus. Information collected from each study included author, year of publication, study design, duration of follow‐up, sample size, type of LVAD, pertinent patient characteristics, and data on the desired outcomes. We contacted individual authors for additional data when reported information was missing or unsuitable for pooling. Risk of bias was assessed using a modified Newcastle–Ottawa Scale for observational studies.8 Domains (with those related to non‐exposed cohorts removed) were given a low, moderate, or high risk of bias. We gave studies an overall risk of bias of low, moderate, or high, according to the collective risk per evaluated domain.
Statistical analysis
For each study, we calculated net changes in each of the study parameters as the changes (baseline–follow‐up) in the mean values (also referred to as the change score). As all studies did not directly report variances for net changes, they were calculated from confidence intervals (CIs), P‐values, or individual variances for intervention and placebo/control groups/periods (when necessary). A correlation coefficient of 0.5 between initial and final values was assumed.9
All outcome data were pooled using a Hartung–Knapp random‐effects model producing a mean difference (MD) with accompanying 95% CI.10, 11 Between‐study variance was calculated using the Paule–Mandel estimator.12 We evaluated for the presence of statistical heterogeneity using the Cochrane P‐value (P < 0.10 was considered significant) and the degree of heterogeneity using the I 2 with a value > 50% considered substantial.13 We assessed for the presence of publication bias using funnel plot inspection and Egger's test of plot asymmetry14 and the trim and fill method15 when >10 studies were included in an analysis. Lastly, we conducted random‐effects meta‐regression to assess the association between changes in HbA1c and baseline values as well as changes in fasting blood glucose. We performed all analyses using the ‘meta’ package in R (Version 3.4.3; the R Project for Statistical Computing).
Results
Study selection and characteristics
Figure 1 illustrates the literature search process. A total of 13 studies were included in the analysis (Table 1).6, 16, 17, 18, 19, 20, 21, 22, 23, 24, 25, 26, 27 All studies were single‐centre, retrospective observational investigations that utilized a pre–post design and were published as full‐text articles, except one that is only available in abstract form.16 Sample sizes ranged from 11 to 139 with durations of follow‐up ranging from 126 days to 12 months. The mean age of the populations was similar amongst the studies, ranging from 51.6 to 63 years. Three studies enrolled patients who had received pulsatile or continuous LVADs,6, 25, 27 with most patients receiving continuous‐flow devices [HeartMate II (Thoratec, Pleasanton, CA) or HVAD (HeartWare International, Framingham, MA)]. Just a single study6 compared diabetes control between pulsatile and continuous‐flow LVADs stating that no appreciable difference existed (although specific data were not provided). Similarly, no studies directly compared outcomes between destination therapy and bridge‐to‐transplant LVAD patients.
Figure 1.
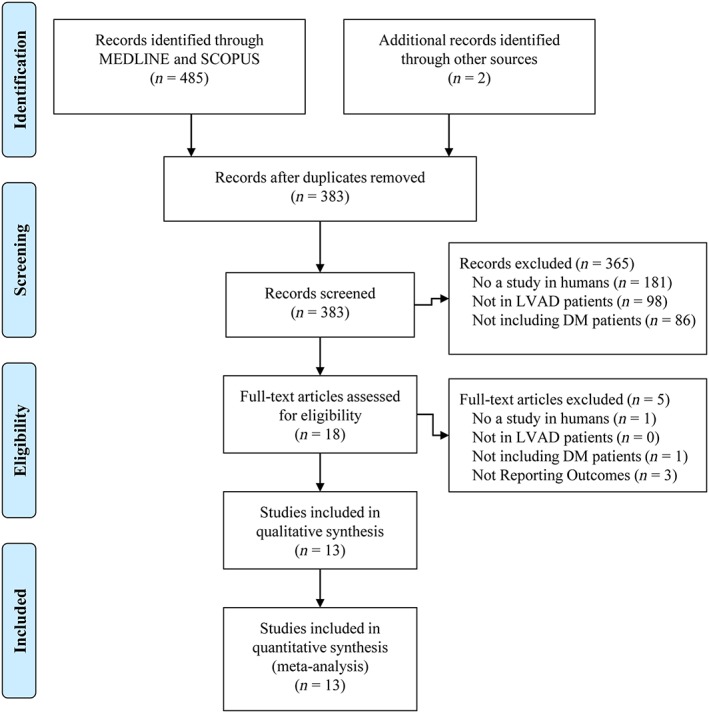
Flow chart of study selection. DM = diabetes mellitus; LVAD = left ventricular assist device.
Table 1.
Baseline characteristics of included studies
| Study, year | Study design | n | Enrolment years | Follow‐up | Age (years) | LVAD type | LVAD indication | Baseline A1c (%) | Baseline glucose (mg/dL) | Baseline BMI (kg/m2) |
|---|---|---|---|---|---|---|---|---|---|---|
| Asleh et al., 201716 | Retrospective, observational | 139 | 2007–16 | 4 months | NR | HM II = 78% | NR | 7.1 (1.7) | NR | NR |
| Vest et al., 201617 | Retrospective, observational | 50 | 2006–13 |
510 days (median) |
57 (50–64, range) |
HM II = 96% HVAD = 4% |
BTT = 62% | 7.7 (1.3) | NR | 29.3 (5.3) |
| Yen et al., 201618 | Retrospective, observational | 83 | 2008–13 | 4.8 months (median) | 61.3 (11.8) |
HM II = 90.4% HVAD = 9.6% |
NR | 7.5 (1.5) | NR | 32.3 (7.0) |
| Subauste et al., 201419 | Retrospective, observational | 11 | NR | 6 months | 60.2 (41–78, range) | NR | NR | 8.6 (1.4) | NR | 31.2 (20.3–43.1, range) |
| Mohamedali et al., 201420, 21 | Retrospective, observational | 66 | 2006–13 | 6 months | 59 (12) | HM II = 100% |
DT = 83% BTT = 17% |
7.2 (1.6) | 141 (46) | 30.3 (5.8) |
| Choudhary et al., 201422 | Retrospective, observational | 22 | 2006–12 | 5.6 (1.1) months | 51.6 (12.5) | NR | NR | 7.9 (1.2) | 142 (39) | 34.7 (7.5) |
| Guglin et al., 201423 | Retrospective, observational | 50 | 2002–12 | 6 months | 56.7 (12.1) |
HM I = 12% HM II = 76% HVAD = 12% |
NR | 7.6 (1.6) | NR | 29.7 (5.5) |
| Koerner et al., 201424 | Retrospective, observational | 28 | 2007–11 | 12 months | 59 (10) | Pulsatile = 100% | NR | 6.8 | 136 | NR |
| Chokshi et al., 201225 | Retrospective, observational | 61 | 1998–10 | 185 (156) days | 55 (13.4) |
Pulsatile = 49% Continuous = 51% |
BTT = 100% | 7.0 (1.6) | 137 (49) | 26.5 (5.3) |
| Chavarria et al., 201226 | Retrospective, observational | 58 | 2002–10 | 146 (106) days | 57.7 (12.4) | NR | NR | 7.1 (1.5) | 133.5 (38.9) | 26.4 (4.8) |
| Khan et al., 201227 | Retrospective, observational | 36 | 2002–10 | 129 (99) days | 59.4 (10.4) |
Pulsatile = 38.9% Continuous = 61.1% |
NR | 6.4 (0.9) | 120.6 (34.2) | 25.4 (8.7) |
| Uriel et al., 20116 | Retrospective, observational | 15 | 2008–09 | 4 (2.3) months | 63 (11.1) |
HM XVE = 26.7% HM II = 73.3% |
DT = 40% BTT = 60% |
7.7 (0.9) | 158 (51) | 28.7 (5.3) |
A1c, haemoglobin A1c; BMI, body mass index; BTT, bridge to transplant; DT, destination therapy; HM I, HeartMate I; HM II, HeartMate II; HM XVE, Heart Mate XVE; HVAD, HeartWare Ventricular Assist Device; LVAD, left ventricular assist device; NR, not reported.
Data are reported as mean (SD) unless otherwise specified. The value for the column ‘n’ represents the patients in each study with diabetes mellitus, not the entire reported population.
The diabetes diagnostic thresholds used by the included studies varied across the body of literature. Some studies, while not specifically identifying solely diabetic patients, used a positive documented history from the medical record.24, 25, 26, 27 The other studies defined diabetes by use of oral anti‐diabetic medications or insulin, an elevated HbA1c (>6.5–7%), or elevated plasma glucose (random > 200 mg/dL or fasting > 126 mg/dL). The study by Yen et al. used an International Classification of Diseases, Ninth Revision code for diabetes.18
The mean baseline HbA1c ranged from 6.8% to 8.6%, mean baseline glucose ranged from 120.6 to 158 mg/dL, and mean BMI ranged from 25.4 to 34.7 kg/m2. The proportion of patients on pre‐LVAD insulin and oral anti‐diabetic medications ranged from 27.8% to 100% and 13% to 100%, respectively. The proportion of patients requiring post‐LVAD insulin and oral anti‐diabetic medications dropped by 6.7–14.5% and 13.3–26%, respectively. Importantly, the reported 24 h insulin requirements did not routinely differentiate between short‐acting and long‐acting preparations. The risk of bias evaluations for each study are shown in Table S1 .16
Primary outcome
As shown in Figure 2 , 11 studies6, 16, 17, 18, 19, 21, 22, 23, 25, 26, 27 reported the HbA1c level before and after LVAD implantation (Table S2 ). Pooled analysis shows a significant 1.23% reduction in HbA1c (95% CI −1.49 to −0.98) post‐LVAD implant. Both a significant amount of statistical heterogeneity (I 2 = 75%, Cochrane P < 0.01) and significant small‐study effects (Egger's P = 0.08) were seen in this analysis (Figure S1 ). Random‐effects meta‐regression analysis showed that HbA1c was reduced by 0.7% for every 1% increase in baseline HbA1c value (P < 0.01; Figure S2 ). Similarly, post‐LVAD HbA1c showed a positive correlation with reductions in post‐LVAD fasting glucose levels (P = 0.05).
Figure 2.
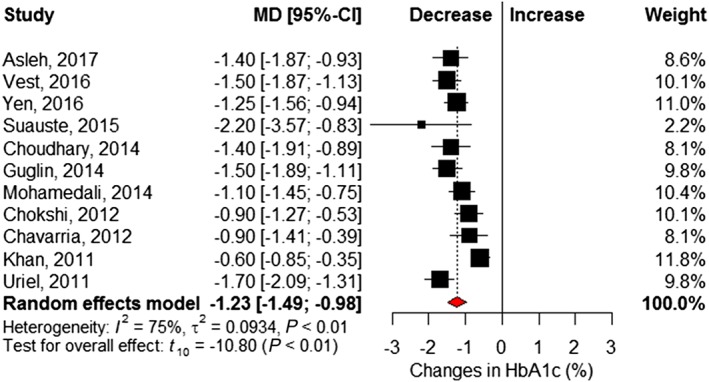
Changes in per cent haemoglobin A1c following left ventricular assist device implantation. Squares represent the mean difference (MD) in individual trials with the width of the line representing the 95% confidence interval (CI). The red triangle represents the pooled effect size and 95% CI. HbA1c = haemoglobin A1c.
Secondary outcomes
Six studies6, 21, 22, 25, 26, 27 reported changes in fasting blood glucose before and after LVAD implantation (Table S2 ). Pooled analysis showed a significant 24.4 mg/dL reduction at follow‐up (95% CI −33.4 to −15.5) and little statistical heterogeneity (I 2 = 7%, Cochrane P = 0.37) (Figure 3 ). Eight studies6, 16, 17, 18, 21, 22, 23, 24 reported insulin requirements, showing patients required 18.8 (95% CI −28.8 to −8.7; I 2 = 66%, Cochrane P < 0.01) fewer units of insulin per day following LVAD implantation (Figure 4 ). Changes in BMI (kilogram per square metre) were reported in seven studies,6, 16, 17, 18, 21, 22, 23 which revealed no significant difference after LVAD implantation (MD 0.09, 95% CI −1.24 to 1.42; I 2 = 43%, Cochrane P = 0.11) (Figure 5 ). However, significant reductions in post‐LVAD serum creatinine (milligrams per decilitre) levels were seen in a pooled analysis of seven studies (MD −0.20, 95% CI −0.35 to −0.06; I 2 = 25%, Cochrane P = 0.24) (Figure 6 ).6, 17, 22, 23, 25, 26, 27
Figure 3.
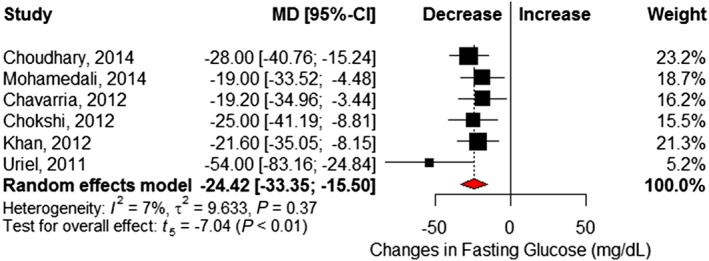
Changes in fasting plasma glucose (in mg/dL) following left ventricular assist device implantation. Squares represent the mean difference (MD) in individual trials with the width of the line representing the 95% confidence interval (CI). The red triangle represents the pooled effect size and 95% CI.
Figure 4.
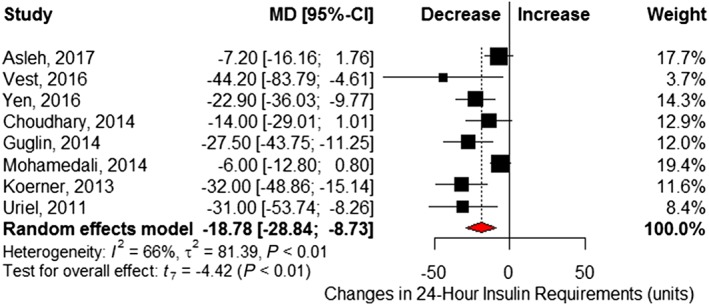
Changes in units of insulin over a 24 h period following left ventricular assist device implantation. Squares represent the mean difference (MD) in individual trials with the width of the line representing the 95% confidence interval (CI). The red triangle represents the pooled effect size and 95% CI.
Figure 5.
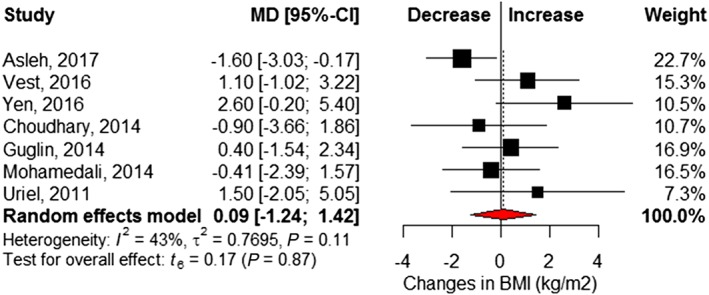
Changes in body mass index (kg/m2) following left ventricular assist device implantation. Squares represent the mean difference (MD) in individual trials with the width of the line representing the 95% confidence interval (CI). The red triangle represents the pooled effect size and 95% CI. BMI = body mass index.
Figure 6.
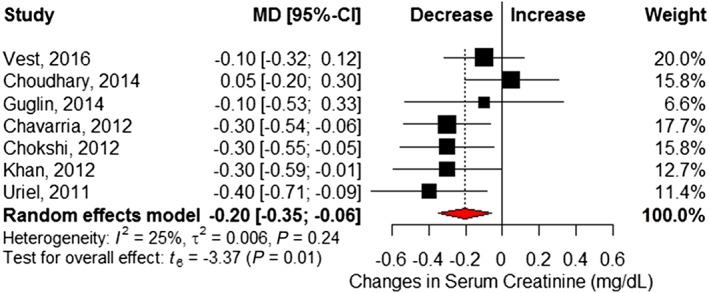
Changes in serum creatinine (mg/dL) following left ventricular assist device implantation. Squares represent the mean difference (MD) in individual trials with the width of the line representing the 95% confidence interval (CI). The red triangle represents the pooled effect size and 95% CI.
Discussion
This meta‐analysis showed LVAD implantation is associated with significant improvements in HbA1c by 1.23%, lower insulin requirements by 18.8 units per day, and lower fasting glucose levels by 24.4 mg/dL without affecting BMI. To our knowledge, this is the first meta‐analysis evaluating glycaemic improvement after LVAD implantations. Clinicians caring for advanced HF patients who have received an LVAD need to be cognizant of these anticipated glycaemic changes and adjust patients' drug regimens accordingly. In fact, some studies showed that patients could discontinue their oral diabetes medications entirely following LVAD implantation.6, 21, 23
The physiologic explanation for these findings is likely multifactorial and stems from mechanical LV unloading and resultant improvements in cardiac output. Low cardiac output in advanced HF increases cortisol and catecholamine levels, leading to the insulin resistance.28 The LVAD‐associated increases in cardiac output correct these metabolic disturbances24 and enhance blood flow to both cardiac and peripheral tissues (including the pancreas), improving glucose homeostasis and reducing whole‐body and cardiac insulin resistance.25, 28, 29 Animal studies confirm these findings, showing improved cardiac glucose oxidation and free fatty acid oxidation to normal levels after HF recovery.30 Mechanical LV unloading also reduces inflammation evidenced by lower retinal binding protein 4,26 tumour necrosis factor‐α,31 and interleukins32 6 and 8 and many help explain the reversal of insulin resistance in these patients.
Other potential explanations for these findings could include improved physical activity, care co‐ordination and management, or medication optimization. Given that our analysis showed no significant changes in BMI following LVAD implantation, the observed glycaemic profile improvements may not be the result of weight loss due to increased physical activity.33 It is, however, possible that the enhancements in skeletal muscle insulin sensitivity seen with exercise could positively impact glycaemic indices.34 The changes could also reflect the more frequent and co‐ordinated care of these patients. Most advanced HF centres caring for LVAD patients have designated endocrinologists and nutritionists as part of their multidisciplinary program,35 which have been shown to improve diabetes control in general populations.36 Changes in medication use could also play a role. As an example, animal studies suggest that milrinone use can induce an insulin resistance by suppressing lipolysis and insulin‐mediated glucose utilization in peripheral tissues37; therefore, these potentially deleterious effects would be mitigated once the milrinone is discontinued following LVAD implantation.
It is important to note that HbA1c levels are affected by the red blood cell (RBC) lifespan and cell turnover, which may overestimate glycaemic control.38 Haemolysis is commonly observed in mechanical circulatory support patients owing to increases in shear stress and results in reductions in haemoglobin and haematocrit values with increasing reticulocyte counts.39, 40 These effects of LVAD use can lead to spurious HbA1c measurements and render them less reliable. While other markers of glycaemic control, such as glycated albumin, have been recommended when increased RBC cell turnover is a concern,38 these data were not routinely available in the current literature base. To overcome this potential effect, we included fasting blood glucose levels and the insulin requirement, both of which were improved with LVAD use and support the HbA1c findings. Additionally, a positive association was seen between reductions in HbA1c and lowering of post‐LVAD fasting blood glucose levels.
It is important to examine the impact of diabetes on outcomes in advanced HF patients, particularly following LVAD implantation. Disagreement exists regarding the diabetes is associated with worsened clinical outcomes in LVAD patients. While Vest et al.17 did not see a significant association between diabetes and all‐cause mortality in 300 mostly bridge‐to‐transplant LVAD patients (P = 0.58), a recently published study by Asleh et al.16 suggested a nearly two‐fold higher mortality risk in 341 diabetics. Interestingly, Asleh et al. saw no association between preoperative HbA1c values and post‐LVAD outcomes. While we did not evaluate clinical outcomes and their associations with glycaemic control in this study, we agree with others41 that such an evaluation is warranted to better aid in risk stratifying advanced HF patients who are being considered for mechanical support.
Study limitations
The results from our meta‐analysis should be evaluated within the context of its potential limitations. Firstly, the definition of diabetes varied amongst the literature body including medical chart documentation of diabetes and differing HbA1c or fasting plasma glucose cut‐offs. This could limit the external validity, as the specific population that would receive the benefits we demonstrated is unknown. In addition, the included studies were single‐site, retrospective observational evaluations reporting values before and after LVAD implantation. While some studies reported glycaemic control only in their diabetic subgroups, others evaluated their entire patient cohort (of whom a proportion had diabetes). It is important to carefully evaluate duration of follow‐up and timing of glycaemic tests in this population, as peri‐operative factors (e.g. blood transfusions) could influence outcomes. All of the included studies reported glycaemic outcomes a number of months following LVAD implantation. Thus, it was not possible to analyse use of either oral anti‐diabetic medications or insulin immediately following surgery compared with later follow‐up times. Similarly, longer duration of follow‐up may reflect reporting of data from healthier patients who were more likely to show improvement of their chronic diseases, including diabetes. Interestingly, the effects on glycaemic control were similar regardless of the follow‐up duration and supported by individual studies that evaluated multiple time points.23 We were unable to assess the impact of concomitant drug therapy, including both diabetes treatments and cardiovascular medications known to affect glycaemic control, including angiotensin‐converting enzyme inhibitors, beta‐adrenergic receptor blockers, and diuretics. Lastly, the studies did not report data separately by either LVAD type or indication; thus, whether these factors affected our findings is unknown. These differences could help explain the modest to significant statistical heterogeneity seen in some of the analyses. The studies within each endpoint agreed on the direction of the association but not necessarily on the magnitude.
Conclusions
Our meta‐analysis showed significant improvements in glycaemic control, including lower HbA1c and plasma glucose levels as well as reduced daily insulin needs in advanced HF patients who received an LVAD. It is prudent for clinicians to follow up the post‐LVAD patient carefully and adjust insulin requirement and oral diabetes medications accordingly.
Conflict of interest
The authors declare no conflict of interest. We presented these results, in part, at the Heart Failure Society of America Annual Scientific Meeting on 16 September 2017 in Dallas, Texas.
Supporting information
Table S1. Risk of bias assessment
Table S2. Individual study outcomes
Figure S1. Funnel plot for HbA1c analysis. The solid circles represent actual identified studies, and the open circles represent imputed studies from a trim and fill analysis. HbA1c = haemoglobin A1c.
Figure S2. Meta‐regression evaluating relationship between changes in HbA1c after LVAD implantation and baseline HbA1c (BLA1c) values. The circles represent individual studies, and the area of the circle is proportional to the weight of each study. The dark line represents the regression equation with a higher baseline HbA1c associated with a greater HbA1c following LVAD implantation. HbA1c = haemoglobin A1c; LVAD = left ventricular assist device.
Patel, N. , Gluck, J. A. , Radojevic, J. , Coleman, C. I. , and Baker, W. L. (2018) Left ventricular assist device implantation improves glycaemic control: a systematic review and meta‐analysis. ESC Heart Failure, 5: 1141–1149. 10.1002/ehf2.12337.
References
- 1. Kannel WB, Hjortland M, Castelli WP. Role of diabetes in congestive heart failure: the Framingham study. Am J Cardiol 1974; 34: 29–34. [DOI] [PubMed] [Google Scholar]
- 2. Shoelson SE, Herrero L, Naaz A. Obesity, inflammation, and insulin resistance. Gastroenterology 2007; 132: 2169–2180. [DOI] [PubMed] [Google Scholar]
- 3. Aguilar D, Bozkurt B, Ramasubbu K, Deswal A. Relationship of hemoglobin A1C and mortality in heart failure patients with diabetes. J Am Coll Cardiol 2009; 54: 422–428. [DOI] [PMC free article] [PubMed] [Google Scholar]
- 4. Kirklin JK, Naftel DC, Pagami FD, Kormos RL, Stevenson LW, Blume ED, Myers SL, Miller MA, Baldwin JT, Young JB. Seventh INTERMACS annual report: 15,000 patients and counting. J Heart Lung Transplant 2015; 34: 1495–1504. [DOI] [PubMed] [Google Scholar]
- 5. Schumer EM, Black MC, Monreal G, Slaughter MS. Left ventricular assist devices: current controversies and future directions. Eur Heart J 2016; 37: 3434–3439. [DOI] [PubMed] [Google Scholar]
- 6. Uriel N, Naka Y, Colombo PC, Farr M, Pak SW, Cotarian V, Albu JB, Gallagher D, Mancini D, Ginsberg HN, Jorde UP. Improved diabetic control in advanced heart failure patients treated with left ventricular assist devices. Eur J Heart Fail 2011; 13: 195–199. [DOI] [PMC free article] [PubMed] [Google Scholar]
- 7. Moher D, Liberati A, Tetzlaff J, Altman DG, and the PRISMA Group . Preferred Reporting Items for Systematic Reviews and Meta‐Analyses: The PRISMA Statement. Ann Intern Med 2009;151:1–6. [PMC free article] [PubMed] [Google Scholar]
- 8. Wells GA, Shea B, O'Connell D, Peterson J, Welch V, Losos M, Tugwell P. The Newcastle–Ottawa Scale (NOS) for assessing the quality of nonrandomised studies in meta‐analyses. http://www.ohri.ca/programs/clinical_epidemiology/oxford.asp (23 May 2017).
- 9. Follmann D, Elliott P, Suh I, Cutler J. Variance imputation for overviews of clinical trials with continuous response. J Clin Epidemiol 1992; 45: 769–773. [DOI] [PubMed] [Google Scholar]
- 10. Hartung J, Knapp G. On tests of the overall treatment effect in meta‐analysis with normally distributed responses. Stat Med 2001; 20: 1771–1782. [DOI] [PubMed] [Google Scholar]
- 11. Hartung J, Knapp G. A refined method for meta‐analysis of controlled clinical trials with binary outcomes. Stat Med 2001; 20: 3875–3889. [DOI] [PubMed] [Google Scholar]
- 12. Paule RC, Mandel J. Consensus values and weighting factors. J Res Natl Bur Stand 1982; 87: 377–385. [DOI] [PMC free article] [PubMed] [Google Scholar]
- 13. Higgins JP, Thomas SG, Deeks JJ, Altman DG. Measuring inconsistency in meta‐analyses. BMJ 2003; 327: 557–560. [DOI] [PMC free article] [PubMed] [Google Scholar]
- 14. Egger M, Davey Smith G, Schneider M, Minder C. Bias in meta‐analysis detected by a simple, graphical test. BMJ 1997; 315: 629–634. [DOI] [PMC free article] [PubMed] [Google Scholar]
- 15. Duval S, Tweedie R. Trim and fill: a simple funnel‐plot‐based method of testing and adjusting for publication bias in meta‐analysis. Biometrics 2000; 56: 455–463. [DOI] [PubMed] [Google Scholar]
- 16. Asleh R, Briasoulis A, Schettle SD, Tchantchaleishvili V, Pereira NL, Edwards BS, Clavell AL, Maltais S, Joyce DL, Joyce LD, Daly RC, Kushwaha SS, Stulak JM. Impact of diabetes mellitus on outcomes in patients supported with left ventricular assist devices. A single institutional 9‐year experience. Circ Heart Fail 2017; 10: e004213. [DOI] [PubMed] [Google Scholar]
- 17. Vest AR, Mistak SM, Hachamovitch R, Mountis MM, Moazami N, Young JB. Outcomes for patients with diabetes after continuous‐flow left ventricular assist device implantation. J Card Fail 2016; 22: 789–796. [DOI] [PubMed] [Google Scholar]
- 18. Yen DC, Watson MH, Burgess LD, Kuchibhatla M, Patel CB, Campbell KB, Vora AK. Positive impact of continuous‐flow left ventricular assist device implantation on glycemic control in patients with type 2 diabetes mellitus and advanced chronic systolic heart failure. Pharmacotherapy 2016; 36: 1210–1216. [DOI] [PubMed] [Google Scholar]
- 19. Subauste AR, Esfandiari NH, Qu Y, Oral EA, Aaronson KD, Pagani FD, Gianchandani RG. Impact of left ventricular assist device on diabetes management: an evaluation through case analysis and clinical impact. Hosp Pract (1995) 2014; 42: 116–122. [DOI] [PubMed] [Google Scholar]
- 20. Mohamedali B, Yost G, Bhat G. Is diabetes mellitus a risk factor for poor outcomes after left ventricular assist device placement? Tex Heart Int J 2017; 44: 115–119. [DOI] [PMC free article] [PubMed] [Google Scholar]
- 21. Mohamedali B, Yost G, Bhat G. Mechanical circulatory support improves diabetic control in patients with advanced heart failure. Eur J Heart Fail 2014; 16: 1120–1124. [DOI] [PubMed] [Google Scholar]
- 22. Choudhary N, Chen L, Kotyra L, Wittlin SD, Alexis JD. Improvement in glycemic control after left ventricular assist device implantation in advanced heart failure patients with diabetes mellitus. ASAIO J 2014; 60: 675–680. [DOI] [PubMed] [Google Scholar]
- 23. Guglin M, Maguire K, Missimer T, Faber C, Caldeira C. Improvement in blood glucose control in patients with diabetes after implantation of left ventricular assist devices. ASAIO J 2014; 60: 290–293. [DOI] [PubMed] [Google Scholar]
- 24. Koerner MM, El‐Banayosy A, Eleuteri K, Kline C, Stephenson E, Pae W, Ghodsizad A. Neurohormonal regulation and improvement in blood glucose control: reduction of insulin requirement in patients with a nonpulsatile ventricular assist device. Heart Surg Forum 2014; 17: E98–E102. [DOI] [PubMed] [Google Scholar]
- 25. Chokshi A, Drosatos K, Cheema FH, Ji R, Khawaja T, Yu S, Kato T, Khan R, Takayama H, Knoll R, Milting H, Chung CS, Jorde U, Naka Y, Mancini DM, Goldberg IJ, Schulze PC. Ventricular assist device implantation corrects myocardial lipotoxicity, reverses insulin resistance, and normalizes cardiac metabolism in patients with advanced heart failure. Circulation 2012; 125: 2844–2853. [DOI] [PMC free article] [PubMed] [Google Scholar]
- 26. Chavarria N, Kato TS, Khan R, Chokshi A, Collado E, Akashi H, Takayama H, Naka Y, Farr M, Mancini D, Schulze PC. Increased levels of retinol binding protein 4 in patients with advanced heart failure correct after hemodynamic improvement through ventricular assist device placement. Circ J 2012; 76: 2148–2152. [DOI] [PubMed] [Google Scholar]
- 27. Khan RS, Kato TS, Chokshi A, Chew M, Yu S, We C, Singh P, Cheema FH, Takayama H, Harris C, Reyes‐Soffer G, Knoll R, Milting H, Naka Y, Mancini D, Shulze PC. Adipose tissue inflammation and adiponectin resistance in patients with advanced heart failure. Correction after ventricular assist device implantation. Circ Heart Fail 2012; 5: 340–348. [DOI] [PMC free article] [PubMed] [Google Scholar]
- 28. Heck PM, Dutka DP. Insulin resistance in heart failure. Curr Heart Fail Rep 2009; 6: 89–94. [DOI] [PubMed] [Google Scholar]
- 29. Tuzun E, Narin C, Gregoric ID, Cohn WE, Frazier OH. Ventricular assist device outflow‐graft site: effect on myocardial blood flow. J Surg Res 2011; 171: 71–75. [DOI] [PubMed] [Google Scholar]
- 30. Qanud K, Mamdani M, Pepe M, Khairallah RJ, Gravel J, Lei B, Gupte SA, Sharov VG, Sabbah NN, Stanley WC, Recchia FA. Reverse changes in cardiac substrate oxidation in dogs recovering from heart failure. Am J Heart Circ Physial 2008; 295: H2098–H2105. [DOI] [PMC free article] [PubMed] [Google Scholar]
- 31. Torre‐Amione G, Bozkurt B, Deswal A, Mann DL. An overview of tumor necrosis factor alpha and the failing human heart. Curr Opin Cardiol 1999; 14: 206–210. [DOI] [PubMed] [Google Scholar]
- 32. Goldstein DJ, Moazami N, Seldomridge JA, Laio H, Ashton RC, Naka Y, Pinsky DJ, Oz MC. Circulatory resuscitation with left ventricular assist device support reduces interleukins 6 and 8 levels. Ann Thorac Surg 1997; 63: 971–974. [DOI] [PubMed] [Google Scholar]
- 33. Miller LW, Pagani FD, Russell SD, John R, Boyle AJ, Aaronson KD, Conte JV, Naka Y, Mancini D, Delgado RM, MacGillivray TE, Farrar DJ, Frazier OH. Use of a continuous‐flow device in patients awaiting heart transplantation. N Engl J Med 2007; 357: 885–896. [DOI] [PubMed] [Google Scholar]
- 34. Devlin JT, Hirshman M, Horton ED, Horton ES. Enhanced peripheral and splanchnic insulin sensitivity in NIDDM men after single bout of exercise. Diabetes 1987; 36: 434–439. [DOI] [PubMed] [Google Scholar]
- 35. Wever‐Pinzon O, Drakos SG, Fang JC. Team‐based care for advanced heart failure. Heart Fail Clin 2015; 11: 467–467, 477. [DOI] [PubMed] [Google Scholar]
- 36. Boyle PJ, O'Neil KW, Berry CA, Stowell SA, Miller SC. Improving diabetes care and patient outcomes in skilled‐care communities: successes and lessons from a quality improvement initiative. J Am Med Dir Assoc 2013; 14: 340–344. [DOI] [PubMed] [Google Scholar]
- 37. Cheung P, Yang G, Boden G. Milrinone, a selective phosphodiesterase 3 inhibitor, stimulates lipolysis, endogenous glucose production, and insulin secretion. Metabolism 2003; 52: 1496–1500. [DOI] [PubMed] [Google Scholar]
- 38. Inaba M, Okuno S, Kumeda Y, Yamada S, Imanishi Y, Tabata T, Okamura M, Okada S, Yamakawa T, Ishimura E, Nishizawa Y, and the Osaka CKD Expert Research Group . Glycated albumin is a better glycemic indicator than glycated haemoglobin values in hemodialysis patients with diabetes: effect of anemia and erythropoietin injection. J Am Soc Nephrol 2007;18:896–903. [DOI] [PubMed] [Google Scholar]
- 39. Panzer S, Kronik G, Lechner K, Bettelheim P, Neumann E, Dudczak R. Glycosylated hemoglobins (GHb): an index of red cell survival. Blood 1982; 59: 1348–1350. [PubMed] [Google Scholar]
- 40. Pierce CN, Larson DF. Inflammatory cytokine inhibition of erythropoiesis in patients implanted with a mechanical circulatory assist device. Perfusion 2005; 20: 83–90. [DOI] [PubMed] [Google Scholar]
- 41. Young JB, Vest AR. Is there a sweet spot for left ventricular assist devices and diabetes mellitus? Circ Heart Fail 2017; 10: e004594. [DOI] [PubMed] [Google Scholar]
Associated Data
This section collects any data citations, data availability statements, or supplementary materials included in this article.
Supplementary Materials
Table S1. Risk of bias assessment
Table S2. Individual study outcomes
Figure S1. Funnel plot for HbA1c analysis. The solid circles represent actual identified studies, and the open circles represent imputed studies from a trim and fill analysis. HbA1c = haemoglobin A1c.
Figure S2. Meta‐regression evaluating relationship between changes in HbA1c after LVAD implantation and baseline HbA1c (BLA1c) values. The circles represent individual studies, and the area of the circle is proportional to the weight of each study. The dark line represents the regression equation with a higher baseline HbA1c associated with a greater HbA1c following LVAD implantation. HbA1c = haemoglobin A1c; LVAD = left ventricular assist device.


