Abstract
Context:
Primary pigmented nodular adrenocortical disease (PPNAD) is a rare type of bilateral adrenal hyperplasia leading to hypercortisolemia. Adrenal gland nodularity is often appreciable with computer tomography (CT). However, accurate radiologic characterization of adrenal size in PPNAD has not been performed.
Objective:
To further characterize adrenal size in patients with PPNAD using 3D CT volumetric analysis, comparing adrenal volumes in PPNAD, with and without Cushing’s syndrome (CS).
Design and Setting:
Patients diagnosed with PPNAD and their family members with known mutations in PRKAR1A were screened. Adrenal glands were imaged and sized using 3D software.
Patients:
Forty-five patients with PPNAD (24 females, mean age 27.8±17.6 years) and 8 controls (19±3 years) evaluated.
Interventions:
CT scans were used to create 3D models of each adrenal gland. Criteria for biochemical diagnosis of CS include paradoxical increase in urinary free cortisol and/or urinary 17-hydroxysteroids in Liddle’s test, loss of diurnal variation of cortisol, and/or elevated midnight cortisol.
Main Outcome Measure:
3D volumetric modeling of adrenal glands in relationship to clinical CS.
Results:
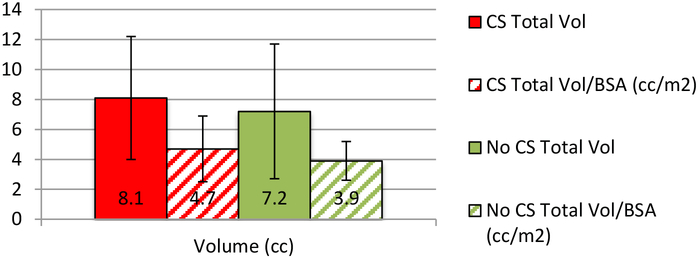
Thirty-eight patients out of 45 (84.4%) had CS. Their mean adrenal volume was 8.1cc±4.1, 7.2cc±4.5 (p=.643) for non-CS, and 8.0±1.6 cc for 8 normal controls. The means were corrected for body surface area; 4.7cc/kg/m2±2.2 for CS, and 3.9cc/kg/m2±1.3 for non-CS (p=.189). Adrenal size and midnight cortisol in patients with PPNAD were positively correlated, r=0.35, p=.025.
Conclusions:
Adrenal volume in PPNAD patients with CS was similar to those without CS. Adrenal volume may be used as a marker of who among patients with PPNAD may develop CS.
Keywords: PPNAD, primary pigmented nodular adrenocortical disease, 3D, imaging, CT, adrenals, Cushing’s syndrome
Introduction
Primary pigmented nodular adrenocortical disease (PPNAD) is a rare, congenital, ACTH-independent cause of Cushing’s syndrome (CS). PPNAD is transmitted as an autosomal dominant trait. It may occur as an isolated condition, or it may be associated with Carney’s complex (CNC), a multiple endocrine neoplasia syndrome that may affect the adrenal cortex and is characterized by spotty skin pigmentation, myxomas, and endocrine overactivity. Loss-of-function mutations in the regulatory subunit type 1 alpha of protein kinase A (PRKAR1A) are associated with both CNC as well as isolated PPNAD (1). In addition, large adrenal adenomas may develop in the background of PPNAD. Somatic and germline mutations of the PRKAR1A gene are frequent in sporadic PPNAD, or as part of Carney Complex (2). A paradoxical increase in levels of 17-hydroxycorticosteroid (17-OHS) and urinary free cortisol (UFC) in response to dexamethasone administration in the Liddle’s test is characteristic of PPNAD (3). Radiological imaging is often not helpful, as all patients with PPNAD almost always have small-sized adrenal glands (4).
Accurate assessment of adrenal gland volume has been difficult due to the gland’s convoluted structure. 3-D volumetric imaging can potentially be useful to assess adrenal pathology. Adrenal glands in PPNAD have been described as “normal-sized or small and peppered with black or brown nodules” in an atrophic cortex (5). Despite their small size, the nodules are often visible withCT, which in combination with the atrophic cortex give the adrenal glands an irregular contour, more so in younger patients with CS (6). Adrenocortical tumors associated with CS, particularly in children, are diagnosed by ACTH-independent hypercortisolemia with visible adrenal lesions on CT (7). Patients that present with CS begin their radiologic evaluation with adrenal CT (8). However, CT imaging results may appear normal where there could be indistinguishable nodularity, as is frequently found in other causes of CS and in normal elderly individuals. Additionally, 3D imaging and volumetric data can potentially provide more diagnostic insight where classic biochemical CS tests are not conclusive, such as in mild or periodic cases of CS, or during nonhypersecretory periods. The segmentation process of the adrenal glands on CT allows for demonstration and visualization of the adrenals’ structural irregularities and results in a model where the adrenals can be pictured relative to their anatomical space.
The primary objective of our study was to use the 3D CT volumetric analysis to gain a better insight into adrenal volume in PPNAD and how it relates to adrenal overactivity. We hypothesized that the individuals with active CS would have hyperfunctioning adrenals with nodularity, and therefore larger adrenal gland volume. Patients that appeared with adrenocortical disease on radiological examination were evaluated to assess if adrenal volume was helpful in the diagnosis and/or management of PPNAD.
Methods
Patients & their genetics
Forty-five patients (24 females and 21 males, mean age 27.8±17.6 years) were evaluated for PPNAD based on clinical suspicion and/or family history between January 2007 and July 2013, nineteen of whom were children. Eight normal controls were also evaluated (19±3 years). Demographics are presented in Table 1. At the time the Liddle’s test was performed, the mean age was 27.6 ± 17.3 and 28.6 ± 20.7 years for patients with active CS and patients without active CS, respectively (see Table 1). Twenty-nine of the 38 (76.3%) CS patients had a PRKAR1A mutation on 17q22–4, as did all seven of the non-CS patients (see Table 3). The patients with PPNAD who were known carriers of PRKAR1A mutations were being prospectively followed for the development CS.
Table 1:
Population Characteristics
| Active CS | No CS | Overall | |
|---|---|---|---|
|
Number of patients (N=45) Male Female Children Male Female |
38 (84.4%) 16 (42.1%) 22 (57.9%) 16 (42.1%) 6 (37.5%) 10 (62.5%) |
7 (15.6%) 5 (71.4%) 2 (28.6%) 3 (42.9%) 2 (66.7%) 1 (33.3%) |
45 21 (46.7%) 24 (53.3%) 19 (42.2%) 8 (17.8%) 11 (24.4%) |
|
Race White Black Native Hawaiian/Pacific Islander Multiple Unknown |
31 (81.6%) 0 0 1 (2.6%) 6 (15.8%) |
6 (85.7%) 0 1 (14.3%) 0 0 |
37 (82.2%) 0 1 (2.2%) 1 (2.2%) 6 (13.3%) |
|
Ethnic Group Hispanic Non-Hispanic |
5 (13.2%) 33 (86.8%) |
0 7 (100%) |
5 (11.1%) 40 (88.9%) |
|
Age at Liddle’s Test (years) (mean ± SD) |
27.6 ± 17.3 | 28.6 ± 20.7 | 27.8 ± 17.6 |
| BSA (m2) (mean ± SD) | 1.7 ± 0.5 | 1.7 ± 0.7 | 1.7 ± 0.5 (p=.83) |
Table 3:
Presence of mutation between active CS and no CS
| Mutation | No Mutation | X2 | p value | |
|---|---|---|---|---|
| CS | 29 | 9 | 2.07 | .150 |
| No CS | 7 | 0 | ||
|
PM cortisol (μg/dl) (mean ± SD) CS No CS |
8.4 ± 5.4 9.4 ± 5.3 3.9 ± 2.2 |
13.7 ± 9.2 --- --- |
.031* .020* |
Clinical evaluations
Biochemical diagnosis of CS was made using diurnal cortisol, ACTH measurements, a six-day low and high dose dexamethasone suppression test (Liddle’s Test), 24-hour UFC, and urinary 17-OHS levels. The diagnostic criteria for active CS include a paradoxical increase in UFC and/or 17-OHS between baseline and day six of the Liddle’s test, loss of diurnal variation of cortisol, elevated UFC, and/or midnight cortisol ≥ 4.4 μg/dl in children and ≥ 7.5 μg/dl in adults. Suppression of UFC greater than 90% and suppression of 17-OHS greater than 64% defined paradoxical increase on Liddle’s test (3).
Imaging
To evaluate the adrenal CT scans, we used Vitrea Core Fx v6.3 software (Vital Images, Minnetonka, Minnesota). The scans, ranging from 1 to 2.5 mm slice thickness, were used to create 3D models of each adrenal gland by contouring the gland in each slice. Adrenal glands were segmented from CT scans, by using region growing algorithm, for which a single, blinded radiologist defined a seed point to initiate the segmentation process for each gland. Mean Hounsfield units and standard deviation of intensity values were applied to all slices automatically, while implementing region-growing algorithm. Finally, hybrid visualization technique with conventional volume rendering and shell rendering was used to demonstrate volume and object (adrenal glands), as well as nearby organs in the same anatomical space.
Statistics
Data are expressed as mean ± SD. A P value less than 0.05 was considered significant for all statistical comparisons. Whitney-Mann U test and unpaired t-test were used to assess the differences between the groups.
Results
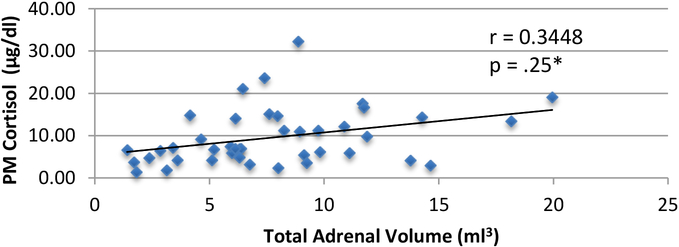
All patients had PPNAD by clinical and biochemical criteria. Twenty-nine (76.3%) had a PRKAR1A mutation. Of the patients with CS, 15 had paradoxical increase to UFC and 14 to 17-OHS (see Table 2). None of the patients without CS showed a paradoxical increase to UFC or 17-OHS. The mean total volume of adrenals in evaluated patients with active CS was 8.1±4.1 and 7.2±4.5 (cc) in those without CS (p=.25). In patients with active CS the mean total adrenal volume corrected for body surface area (BSA) was 4.7±2.2 whereas it was 3.9±1.3 (cc/kg/m2) in patients without CS (see Figure 1). Midnight cortisol was positively correlated with total adrenal volume (R=0.35, p=.025*, see Figure 2). Interestingly, the mean adrenal volume in 8 normal controls was 8.0 cc ± 1.6.
Table 2:
Liddle’s test in patients with active CS vs. w/o CS
| Active CS | No CS | p value | |
|---|---|---|---|
| UFC paradoxical increase (Y/N) | 15 | -- | -- |
| 17-OHS paradoxical increase (Y/N) | 14 | -- | -- |
|
PM cortisol (μg/dl) (mean ± SD) Adults Children |
10.5 ± 6.6 10.8 ± 5.6 10.1 ± 7.9 |
3.9 ± 2.2 4.1 ± 2.5 3.8 ± 2.4 |
.022* .059 .19 |
Figure 1:
Total adrenal volume in patients with active CS vs. without CS
Figure 2:
PM cortisol vs. total adrenal volume in PPNAD (n=38)
Discussion
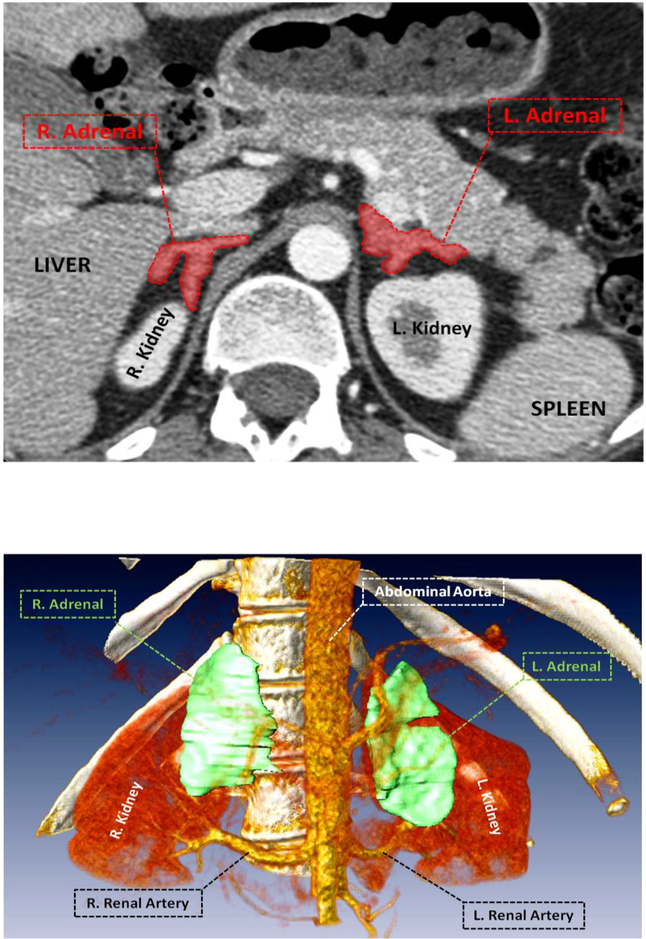
Thirty-eight of the 45 (84.4%) patients evaluated met the clinical criteria for active CS. Nineteen of the patients with CS had either partial or bilateral adrenalectomy. One patient that had a mutation and bilateral adrenalectomy had a total adrenal volume of 19.95cc and on examination their largest adrenal gland measured to be 8×5.5×1.8 cm3 with fat (see L. Adrenal in Figure 3) This 19 year-old, female CS patient had the largest adrenal volumes of all patients evaluated. Fourteen of the CS patients who had adrenalectomy also presented with a PRKAR1A mutation. The total adrenal volume of patients with CS was not statistically different than those without CS, suggesting that adrenal volume may not be the most helpful indication for adrenalectomy in patients with PPNAD. This is consistent with previous literature that PPNAD patients present with bilateral nodularity on radiologic exam, but without enlargement of the adrenal glands (8). This may also suggest that adrenal volume may not be a good indicator of who develops CS amongst patients with PPNAD, given the insignificant difference in size.
Figure 3:
Active CS patient with largest observed adrenal volume and the greatest degree of nodularity.
However, the midnight cortisol levels of all patients are correlated with their total adrenal volume (p=.025*, see Figure 2), suggesting that larger total adrenal volume correlates positively with higher midnight cortisol levels. Larger adrenal volume in patients with PPNAD is related to hyperactivity and hypersecretion of cortisol as exemplified by the loss of diurnal variation in serum cortisol. The significantly higher midnight cortisol levels in patients with CS support the biochemical and clinical presentation of PPNAD as a cause of CS in those patients. Thusly, adrenal volume may be useful as an indication of PPNAD patients that may develop CS.
Having a 3D model of adrenal glands in patients with PPNAD allows for nodularity and any irregular structure to be visualized relative to their anatomical space. Our results suggest that adrenal volume does not differ significantly between PPNAD patients with and without CS, so looking at volume alone may not be representative of the true phenotype of the adrenal gland. In addition to paradoxical increases to 17-OHS and/or UFC, loss of diurnal variation of cortisol after low-dose dexamethasone test and high midnight cortisol relative to total adrenal volume appears to be a good indicator of PPNAD patients with comorbidity of CS.
In PPNAD cases that require surgical intervention, CT has been shown to be very valuable in optimizing surgical planning and ultimately decreasing morbidity and mortality by using appropriate surgical approaches based on localization of adrenal tumors (6,8). A 3D model of the adrenal glands can provide further input with respect to the nodularity of the adrenals. Although nodules in PPNAD and CS patients are very small, the adrenal glands tend to be visualized quite well due to the retroperitoneal fat in these patients (8). The irregular contour of the adrenals was noticed to be more apparent when nodularity was surrounded by fatty tissue.
We conclude that use of 3D radiologic imaging yields promise to improving specificity and sensitivity of diagnostic radiology in helping the prognosis in patients with PPNAD.
Table 4:
Adrenalectomy, mutation, & adrenal size within active CS group
| Mutation | No Mutation | X2 | p value | |
|---|---|---|---|---|
|
Surgery No Surgery |
14 15 |
5 4 |
0.15 |
.70 |
| Total Adrenal Volume (cc) (mean ± SD) | 8.4 ± 4.5 | 7.0 ± 2.5 | .36 |
Footnotes
Disclosure Statement: The authors have nothing to disclose.
References
- 1.Kirschner LS, Sandrini F, Monbo J, Lin J-P, Carney JA, Stratakis CA. Genetic heterogeneity and spectrum of mutations of the PRKAR1A gene in patients with the Carney Complex. Hum. Mol. Genet 2000; 9(20):3037–3046. [DOI] [PubMed] [Google Scholar]
- 2.Groussin L, Jullian E, Perlemoine K, et al. Mutations of the PRKAR1A Gene in Cushing’s Syndrome due to Sporadic Primary Pigmented Nodular Adrenocortical Disease. The Journal of Clinical Endocrinology & Metabolism. 2002; 87(9):4324–4329. [DOI] [PubMed] [Google Scholar]
- 3.Stratakis CA, Sarlis N, Kirschner LS, et al. Paradoxical response to dexamethasone in the diagnosis of primary pigmented nodular adrenocortical disease. Annals of internal medicine. 1999; 131(8):585–591. [DOI] [PubMed] [Google Scholar]
- 4.Powell AC, Stratakis CA, Patrona NJ, Steinberg SM, Batista D, Alexander RH, Pingpank JF, Keil M, Bartlett DL, Libutti SK. Operative management of Cushing Syndrome secondary to micronodular adenal hyperplasia. Surgery. 2008; 143:750–758. [DOI] [PMC free article] [PubMed] [Google Scholar]
- 5.Horvath A, Stratakis C. Primary pigmented nodular adrenocortical disease and Cushing’s syndrome. Arquivos Brasileiros de Endocrinologia & Metabologia. 2007; 51(8):1238–1244. [DOI] [PubMed] [Google Scholar]
- 6.Stratakis CA. Adrenocortical tumors, primary pigmented adrenocortical disease (PPNAD)/Carney complex, and other bilateral hyperplasias: the NIH studies. Horm Metab Res. 2007; 39(6):467–473. [DOI] [PubMed] [Google Scholar]
- 7.Storr HL, Mitchell H, Swords FM, et al. Clinical features, diagnosis, treatment and molecular studies in paediatric Cushing’s syndrome due to primary nodular adrenocortical hyperplasia. Clinical Endocrinology. 2004; 61(5):553–559. [DOI] [PubMed] [Google Scholar]
- 8.Dunnick NR, Doppman JL, J R Gill J, Strott CA, Keiser HR, Brennan MF. Localization of functional adrenal tumors by computed tomography and venous sampling. Radiology. 1982; 142(2):429–433. [DOI] [PubMed] [Google Scholar]
- 9.Rockall AG, Babar SA, Sohaib SAA, et al. CT and MR Imaging of the Adrenal Glands in ACTH-independent Cushing Syndrome. RadioGraphics. 2004; 24(2):435–452. [DOI] [PubMed] [Google Scholar]


