

Abstract
Chronic kidney disease (CKD), a condition when the kidneys are unable to clear waste products, affects 700 million people globally. Genome-wide association (GWA) studies identified sequence variants for CKD; however, the biological basis of GWAS remains poorly understood. To address this issue, we created an expression quantitative trait loci (eQTL) atlas for the glomerular and tubular compartments of the human kidney. Integrating the CKD GWAS with eQTL, single-cell RNA sequencing and regulatory region maps, we identified novel genes for CKD. Putative causal genes were enriched for proximal tubule expression and endo-lysosomal function, where DAB2, an adaptor protein in the TGFβ pathway, formed a central node. Functional experiments confirmed that reducing Dab2 expression in renal tubules protected mice from CKD. In conclusion, compartment-specific eQTL analysis is an important avenue for the identification of novel genes and cellular pathways involved in CKD development and thus potential new opportunities for its treatment.
Keywords: renal disease, eQTL, compartment-specific
Introduction
Chronic kidney disease (CKD) affects close to 10% of the population worldwide1,2. Despite advances in therapeutic methods such as dialysis and transplantation, CKD remains the 9th leading cause of death in the world3,4. The precise molecular and cellular mechanisms underlying CKD pathogenesis are still poorly understood5. As a result, current treatments are mostly palliative rather than truly curative.
It is estimated that 20% of individuals with CKD in the US harbor potentially identifiable and causal (for CKD) mutations in a single gene6,7. The majority of individuals with CKD exhibit a polygenic architecture with an estimated heritability proportion of around 30%−50%8. Large-scale genome-wide association (GWA) studies using more than 100,000 subjects were performed to unravel the genetics of kidney function and CKD in the general population and successfully identified a total of 53 loci significantly associated with kidney disease9. Currently, the total number of loci with genome-wide significant association with kidney disease traits are 839–12. As seen for other traits, more than 95% of variants significantly associated with kidney function are in the non-coding regions of the genome13,14.
GWA studies often label risk allele regions by their proximity to specific genes. However, regulatory elements can act over large distances and in a cell-type-specific manner; thus, making the identification of disease-causing genes and their mechanism exceedingly difficult15,16. For example, specific genes that explain the common genetic variation associated with hyperlipidemia, diabetes and heart disease have been uncovered only for a handful of loci17–19. These studies support a model that causal nucleotide variants are localized to cell-type-specific regulatory regions, such as enhancers, that alter transcription factor binding and induce quantitative differences in transcript level of nearby causal genes20,21. One such example is the FTO region, where variants in the intronic region of FTO show strong association with obesity, but the actual causal genetic variation was found to be an enhancer modulating the expression of the transcription factors IRX3 and IRX5 that are encoded nearby the FTO gene22. These observations highlight the critical importance of careful, unbiased in-depth follow-up studies to GWA studies to better confirm or identify the actual causal genes for a given pathological condition.
Several large collaborative efforts have been set up to better understand complex trait variations. The Encyclopedia of DNA Elements (ENCODE) project was an important international effort to identify regulatory regions that could harbor disease-causing variants. The project generated regulatory region maps for large number of cell types and organs23,24. Similarly, the Genotype-Tissue Expression (GTEx) project provided one of the largest and most comprehensive catalogs of whole genome and transcriptome sequencing data, comprised of up to 53 human tissue samples across 635 individuals defining an association between genetic variant and gene expression; also called expression of quantitative trait (eQTL) analysis25–27. Nonetheless, the human kidney has been poorly covered both by ENCODE28,29 and GTEx25–27 studies. To address this issue, our group has previously generated histone Chromatin Immunoprecipitation Sequencing (ChIP-Seq) data to annotate kidney-specific regulatory regions and performed eQTL analyses on 96 human whole kidney tissue samples30. As a result of this whole tissue-based analysis, we identified putative disease associated genes for five of the 83 previously identified CKD-associated GWAS loci. Candidate gene and animal model studies indicated that UMOD and SHROOM3 are likely causal genes for CKD GWAS variants31,32. Causal genes and pathways for the remaining 76 loci remain unknown to date.
Here we argue that cell-type heterogeneity of the eQTL dataset, in addition to the sample size limitation, are the key contributors to the low yield of identifying causal genes for CKD using the GWAS-eQTL integration approach24,33–35. Our recent single-cell transcriptome analysis highlighted important cell-type convergence, indicating that diseases that present with similar phenotypes originate from the same cell types36. We propose that diseases are not organ-specific but, rather, cell-type-specific; therefore, genetic variants are localized to cell-type-specific regulatory regions and influence gene expression changes only in disease-causing cell types35,37,38.
As a first step towards identifying disease genes of CKD, we performed a compartment-based eQTL analysis of human kidney tissue samples using manual microdissection of the glomerulus and tubule, which are two key compartments of this organ. This microdissection significantly reduces cell heterogeneity as each compartment is composed of around only five cell types36. We aimed to define genotype-driven gene expression changes in the glomerular and tubular compartments of human kidneys, identifying genetic variants that influence the expression of genes. Here, we call genetic variants that influence gene expression eVariants and their target genes eGenes.
Subsequently, we integrated this information with genotype and phenotype association studies (that is, GWAS hits) to identify genes for which expression in the kidney shows differences in individuals with GWAS-identified variants (Supplementary Fig. 1a). We show that compartment-based eQTL data significantly improves identification of genes for which expressions are regulated by GWAS-identified variants. Furthermore, we integrated the kidney eQTL data with epigenomic data and transcriptome analysis from single-cell RNA sequencing (RNA-Seq) to study the regulatory mechanism of the cell-type-specific eQTL effects of disease variants. Finally, we performed cell-type-specific gene expression manipulations in animal models and specifically demonstrated that DAB2 is likely a causal gene for CKD development. Our study provides a novel genetic framework for CKD development as it defines key cell types and novel mechanisms involved in the disease.
Results
Compartment-based eQTLs in the human kidney
We separated human kidney tissue compartments, in particular glomeruli and tubules, by manual microdissection followed by RNA-Seq of each compartment (Supplementary Fig. 1b). The expression of tubule epithelial-specific markers such as SLC12A1 and SLC34A1 were significantly greater in tubules (P < 2.2 × 10⁻¹⁶ and P = 3.59 × 10⁻¹¹, respectively; two-sided Student’s t test), while glomerulus epithelial-specific genes were almost exclusively expressed in glomeruli (Supplementary Fig. 1c). Well-known nephrotic syndrome genes showed preferential expression in glomerular compartment and proximal tubulopathy genes expressed in tubules (Supplementary Fig. 1d). We validated that the fraction of each cell type was similar in the kidney samples included in the analysis using in silico cell deconvolution analysis that estimates cell-type proportions based on latent variable modeling39,40 (Supplementary Fig. 1e). Furthermore, tissue samples underwent careful clinical and histological evaluation, and we included samples only without significant structural and functional changes in the analysis to minimize non-genetically driven gene expression fluctuations (Supplementary Table 1).
Using these stringent criteria, we included 151 kidneys in the analysis, including 121 tubule samples and 119 glomerulus samples used to identify compartment-based cis-eQTLs (further referred to as eQTLs) (Supplementary Fig. 1f). We performed eQTL analysis separately for the two compartments by using a linear model and ± 1Mb window around the transcription start site (TSS). In the tubular compartment, we identified 4,081 genes with eQTLs at a 5% FDR (hereafter referred to as eGenes) and 389,454 significant SNP-gene pairs; in the glomerular compartment, 4,913 eGenes and 467,994 significant SNP-gene pairs. We made this dataset available via our searchable website (http://susztaklab.com/eqtl). We have also performed meta-analysis on tubules and glomeruli eQTLs and have defined tubule-compartment-specific eGenes (n = 417), glomerulus-compartment-specific eGenes (n = 674), and compartment-shared eGenes (n = 3,493) (Fig. 1a).
Figure 1:
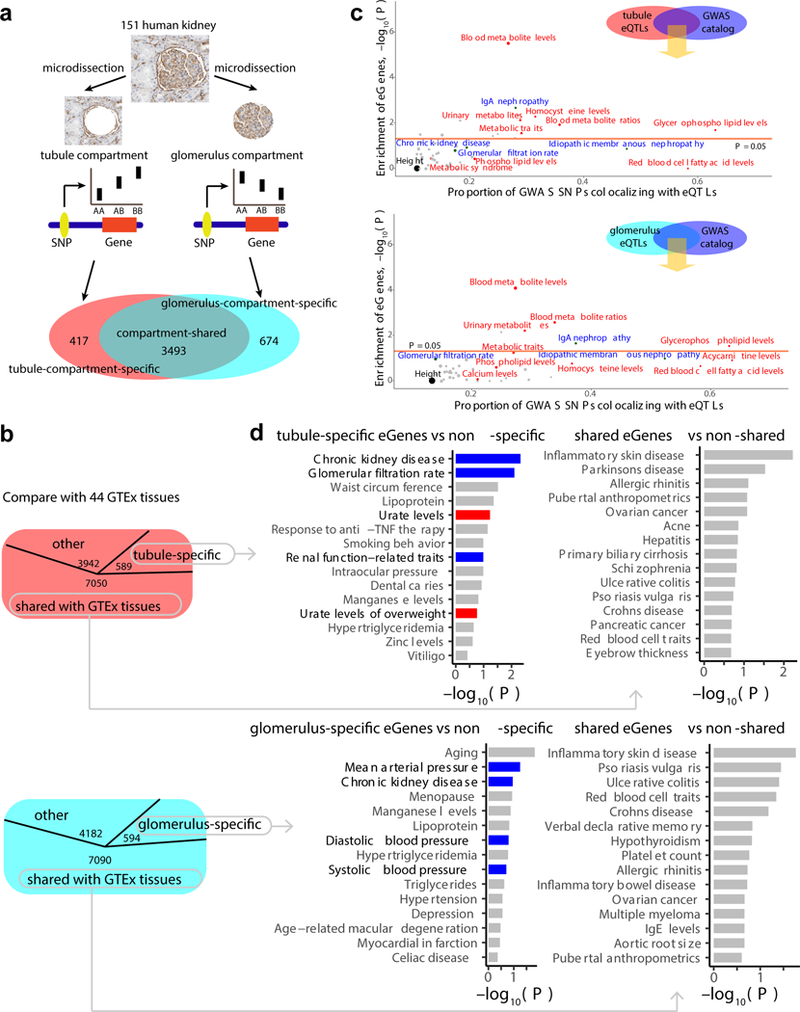
Summary of kidney compartment-based eQTL analysis. a, Diagram indicating the work flow (and results) by which eGenes were identified in the tubular and glomerular compartment of human kidneys. b, Diagram illustrating the number of tubule-specific (top) and glomerulus-specific (bottom) eGenes identified by meta-analysis of eQTLs from 46 human tissues (44 GTEx tissues plus 2 kidney compartments). c, Overlap of tubule (top) and glomerulus (bottom) eQTLs with hits of various GWA studies from GWAS catalogue. The x-axis shows the proportion of GWAS variants of each GWAS trait overlapped with tubule and glomerulus eQTLs (when the GWAS varuants and eVariants are located in the same LD, r2 > 0.8). The y-axis shows enrichment of tubule and glomerulus eGenes by genes around the hits of each GWAS trait. –log10 (P) was calculated by two-sided Fisher’s exact test (height was used for background estimation). Red dots, metabolite traits; blue dots, kidney-related traits; grey dots, other traits. Orange line, statistical significance threshold. d, The 15 GWAS traits showing the strongest enrichment (y-axis) for tubule- and glomerulus-specific eGenes (left) or shared eGenes (right). Tubule-specific eGene: n = 589; tubule-shared eGene: n = 7050; glomerulus-specific eGene: n = 594; glomerulus-shared eGene: n = 7090. –log (P) was calculated by two-sided Fisher’s exact test (x-axis).
The number of eGenes identified is in line with expectations (Supplementary Fig. 2a), from previous publications of 44 human tissues of the GTEx Consortium25. Furthermore, many of the significant SNP-gene pairs identified by our tubule eQTL analysis can be replicated in other tissues (thyroid (π1 = 0.79) and transformed fibroblasts cells (π1 = 0.77), π1 refers to the proportion of true positives). As expected, the greatest overlap for tubule was observed in glomeruli (π1 = 0.91) (Supplementary Fig. 2b).
By performing meta-analysis of kidney compartments and 44 GTEx tissue samples, we could identify 589 tubule-specific eGenes (m > 0.9 in less than five tissues, including tubule, m refers to the posterior probability that the effect is shared in each tissue) and 594 glomerulus-specific eGenes. We found 7,050 shared eGenes in the tubules (m > 0.9 in more than 40 tissues, including tubule); and 7,090 shared eGenes in the glomerulus. These results are in line with previous observations indicating that most eGenes were shared across tissues25 (Fig. 1b).
Our compartment-based eQTL study identified many novel eQTLs that were previously not detected by bulk tissue, whole kidney eQTL analysis (Supplementary Table 2). For example, LRRC3 is associated with rs2838917 genotype only in the tubular compartment, but not in whole kidney or glomerulus (Supplementary Fig. 2c, d). In contrast, ANXA2 is associated with rs3068 genotype only in the glomerular compartment (Supplementary Fig. 2e, f). Of note, we found one gene, NUCB1, had an opposite eQTL effect direction between tubule and glomerulus (Supplementary Fig. 2g). These examples highlight the utility of compartment-based eQTL analysis to identify a large number of novel eQTLs.
Renal compartment eQTLs are enriched for kidney-associated GWAS trait variants
By assessing overlap between the entire published GWAS catalogue41 (downloaded 1/4/2017) and our kidney compartment eQTLs, we found that GWAS hits in genes encoding proteins that are related to regulating the levels various blood metabolites were significantly enriched for tubule eQTLs. 26% of metabolite GWAS hits colocalized with tubule eQTLs and its associated genes were significantly enriched for tubule eGenes (P = 3.04 × 10⁻⁶, Fisher’s exact test). Moreover, tubule eGenes were also significantly enriched for genes for kidney disease traits, such as IgA nephropathy (P = 2.12 × 10⁻³). A similar pattern of kidney and metabolite trait enrichment was seen in the glomerulus eQTL dataset (Fig. 1c).
Next, we focused on our newly identified tubule-specific and glomerulus-specific eGenes by assessing overlap with the GWAS catalogue. Tubule-specific eGenes, compared to non-tubule-specific eGenes, were significantly enriched for CKD GWAS hits (P = 4.79 × 10⁻³, Fisher’s exact test) and glomerular filtration rate GWAS hits (P = 7.96 × 10⁻³). In contrast, these tubule-shared eGenes were enriched in genes for inflammatory skin disease (P = 5.94 × 10⁻³) and Parkinson’s disease (P = 2.95 × 10⁻²), compared with non-tubule-shared eGenes. Glomerulus-specific eGenes were not only enriched for CKD GWAS variants but also for blood pressure-associated genetic variants (Fig. 1d). In summary, these results indicate that kidney-specific eQTLs show enrichment for kidney-associated phenotypic traits, but shared eQTLs showed no enrichment for renal traits, thus confirming the specificity and biological relevance of compartment-based eQTL analysis.
Integration of CKD GWAS variants and compartment-based eQTLs to identify causal genes for kidney disease
Our goal was to annotate CKD GWAS variants to identify genes and pathways responsible for CKD development. By literature survey, we identified a total of 83 replicated, CKD-associated GWAS loci9–12 (Supplementary Table 3). A direct overlap of loci that reached genome-wide significance in GWAS for CKD and in our eQTL data identified differences in the expression level of 27 genes associated with CKD GWAS loci. To test whether two traits share a causal variant at a given locus, we conducted colocalization analysis using coloc42. And, in a complementary analysis, to assess whether a GWAS SNP tags the same functional variant as the eQTL, we calculated RTC scores43 for each candidate SNP-gene pair. Most of these genetic regions showed a positive colocalization between the eQTL effect and CKD GWAS (posterior probability of colocalization between eQTL and GWAS effect in the given region (PP_H4) > 0.8), suggesting that these genes are strong causal candidates for kidney disease (Table 1). The functional role of MANBA, PGAP3 and CASP9 for kidney disease development has been supported by prior animal model studies, confirming the biological validity of our computational analysis44,45.
Table 1:
Colocalization of CKD GWAS leading SNPs with kidney compartment eQTLs. a, GWAS variant and eQTL variant are not the same one, but in the same LD (r2 > 0.8); b, The regulatory direction of risk allele of each SNP on its target gene. ↑, higher gene expression with risk allele; ↓, lower gene expression with risk allele; N/A, this gene or SNP was excluded by data pre-processing.
| Compartment | Chr | GWAS SNP | Risk Allele | Gene | eQTL β | eQTL P | Regulatory directionb | Regulatory direction in Whole Kidneyb | PP_H3 (coloc) | PP_H4 (coloc) | RTC |
|---|---|---|---|---|---|---|---|---|---|---|---|
| Tubule | 1 | rs12136063 | G | SORT1 | 0.717 | 6.85 × 10⁻⁸ | ↓ | ↓ | 0.049 | 0.943 | 1 |
| 1 | rs12124078 | G | CASP9 | 0.832 | 1.13 × 10⁻⁹ | ↑ | ↑ | 0.021 | 0.978 | 1 | |
| 2 | rs1260326 | C | NRBP1 | −0.614 | 6.52 × 10⁻⁷ | ↓ | N/A | 0.003 | 0.981 | 1 | |
| 3 | rs347685 | A | TFDP2 | −0.773 | 4.07 × 10⁻⁸ | ↓ | ↓ | 0.014 | 0.979 | 1 | |
| 5 | rs11959928 | A | DAB2 | 0.566 | 3.52 × 10⁻⁶ | ↑ | ↑ | 0.039 | 0.938 | 1 | |
| 7 | rs228611 | A | MANBAa | −0.572 | 1.79 × 10⁻⁵ | ↓ | ↓ | 0.682 | 0.294 | 0.906 | |
| 7 | rs228611 | A | CISD2 | 0.580 | 1.10 × 10⁻⁵ | ↑ | ↑ | 0.665 | 0.322 | 1 | |
| 7 | rs10277115 | T | UNCX | 0.708 | 3.84 × 10⁻⁶ | ↑ | N/A | 0.002 | 0.916 | 1 | |
| 10 | rs10994860 | C | ASAH2B | 1.153 | 3.13 × 10⁻¹¹ | ↓ | ↓ | 0.257 | 0.743 | 1 | |
| 11 | rs4014195 | G | MAP3K11a | 0.482 | 1.90 × 10⁻⁴ | ↑ | ↑ | 0.152 | 0.677 | 0.843 | |
| 12 | rs10774021 | T | SLC6A13 | −0.709 | 4.14 × 10⁻⁸ | ↓ | ↓ | 0.002 | 0.994 | 1 | |
| 13 | rs626277 | A | DACH1 | 0.669 | 5.61 × 10⁻⁸ | ↓ | ↓ | 0.023 | 0.973 | 1 | |
| 15 | rs2928148 | G | CHAC1 | −0.681 | 2.95 × 10⁻⁷ | ↑ | ↑ | 0.036 | 0.944 | 1 | |
| 16 | rs164748 | G | CHMP1A | −0.766 | 5.38 × 10⁻¹⁰ | ↓ | ↓ | 0.017 | 0.982 | 1 | |
| 16 | rs164748 | G | DPEP1 | 0.811 | 3.09 × 10⁻¹¹ | ↑ | ↑ | 0.023 | 0.975 | 1 | |
| 17 | rs11078903 | A | PGAP3 | −0.809 | 1.38 × 10⁻⁹ | ↓ | ↓ | 0.032 | 0.967 | 1 | |
| 17 | rs11078903 | A | FBXL20 | 0.655 | 2.06 × 10⁻⁶ | ↑ | ↑ | 0.031 | 0.920 | 1 | |
| glom | 1 | rs12136063 | G | ATXN7L2a | 0.629 | 1.26 × 10⁻⁵ | ↓ | ↓ | 0.034 | 0.801 | 0.896 |
| 1 | rs12124078 | G | CASP9 | 0.798 | 9.29 × 10⁻⁸ | ↑ | ↑ | 0.021 | 0.968 | 1 | |
| 2 | rs13538 | A | ALMS1Pa | 0.572 | 4.72 × 10⁻⁵ | ↓ | ↓ | 0.041 | 0.717 | 0.998 | |
| 2 | rs1260326 | C | NRBP1a | −0.499 | 5.79 × 10⁻⁵ | ↓ | N/A | 0.007 | 0.873 | 0.988 | |
| 2 | rs13538 | A | NAT8 | −0.609 | 9.34 × 10⁻⁶ | ↑ | ↑ | 0.048 | 0.814 | 1 | |
| 5 | rs12654812 | A | RGS14 | −0.740 | 2.60 × 10⁻⁸ | ↓ | N/A | 0.273 | 0.162 | 1 | |
| 5 | rs12654812 | A | SLC34A1a | −0.608 | 1.16 × 10⁻⁵ | ↓ | N/A | 0.021 | 0.525 | 0.97 | |
| 6 | rs7759001 | A | ZNF391 | 1.081 | 6.18 × 10⁻¹⁶ | ↑ | ↑ | 0.095 | 0.894 | 1 | |
| 10 | rs10994860 | C | ASAH2B | 1.261 | 1.11 × 10⁻¹³ | ↓ | ↓ | 0.209 | 0.791 | 1 | |
| 11 | rs4014195 | G | DPP3a | −0.510 | 4.94 × 10⁻⁵ | ↓ | ↓ | 0.006 | 0.867 | 0.973 | |
| 15 | rs2928148 | G | CHAC1 | −0.592 | 2.05 × 10⁻⁶ | ↑ | ↑ | 0.039 | 0.864 | 1 | |
| 15 | rs2467853 | G | SPATA5L1 | 0.729 | 1.08 × 10⁻⁸ | ↑ | ↑ | 1.000 | 0.000 | 1 | |
| 16 | rs164748 | G | CHMP1Aa | −0.587 | 1.06 × 10⁻⁵ | ↓ | ↓ | 0.022 | 0.941 | 0.988 | |
| 16 | rs164748 | G | DPEP1 | 0.889 | 7.54 × 10⁻¹³ | ↑ | ↑ | 0.021 | 0.978 | 1 | |
| 17 | rs11078903 | A | PGAP3 | −0.660 | 5.55 × 10⁻⁷ | ↓ | ↓ | 0.032 | 0.945 | 1 | |
| 20 | rs6088580 | C | ACSS2 | 0.567 | 1.43 × 10⁻⁵ | ↑ | ↑ | 0.332 | 0.592 | 1 | |
| 20 | rs6088580 | C | MAP1LC3A | 0.713 | 3.34 × 10⁻⁸ | ↑ | ↑ | 0.015 | 0.980 | 1 |
In summary, when compared to previous eQTL studies of whole kidney tissue samples, the compartment-based eQTL analysis could identify larger number of causal genes for CKD (n = 5 for bulk tissue and n = 27 for specific compartment). Furthermore, despite the significant eQTL sharing (π1 = 0.91) between tubule and glomerulus, more identified GWAS causal genes came from the smaller, newly discovered compartment-specific eQTL subset.
Compartment-specific eQTLs are enriched in distal regulatory regions and show greater cell-type specificity
We hypothesized that integration of GWAS with compartment eQTLs can identify potential causal cell types for a given set of traits (Fig. 2a). To further understand whether the 27 genes with GWAS overlapping compartment-based eQTLs show cell-type specificity, we have examined the expression of putative GWAS target genes in kidney cells. We have previously performed single-cell RNA-Seq on mouse kidney tissue samples and our analysis has identified 16 distinct cell types in the kidney36. Using this unique expression dataset (only use 13 well-annotated cell types), we next examined the cell types where putative GWAS target genes were expressed. We were able to map the expression of 23 out of the 27 human target genes in our mouse kidney single-cell atlas. We found that most CKD-associated genes have a unique cell-type-enriched expression profile and these transcripts are not broadly expressed in all kidney cells. Particularly, we found that renal proximal tubules show the greatest enrichment for GWAS-eQTL target genes, where 39% of genes (9 out of 23) were expressed in proximal tubule epithelial cells, which is markedly higher than what is expected if genes were randomly distributed in kidney cells (23 genes/13 cell types; ~1 gene per cell type) (Fig. 2b).
Figure 2:
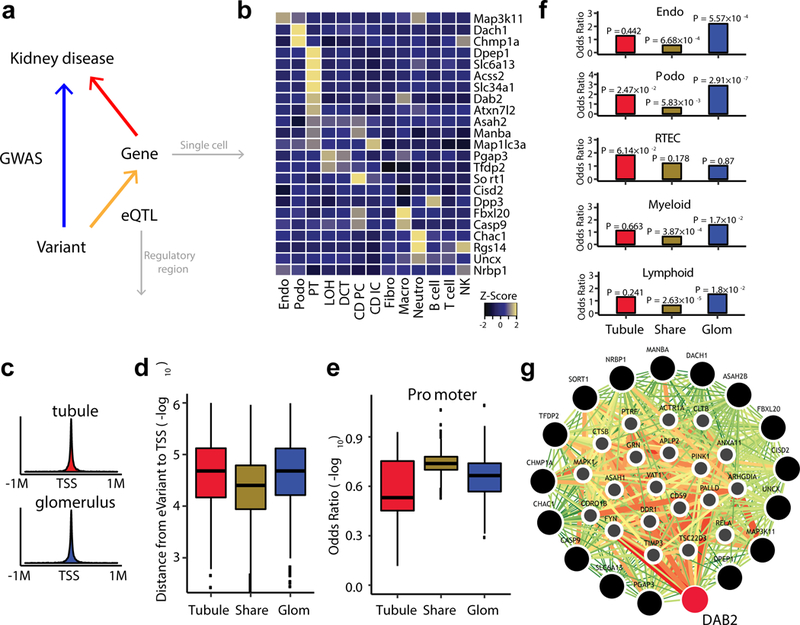
Compartment-specific eQTLs show greater cell-type specificity and distal regulatory element enrichment. a, Diagram describing the integration of kidney eQTLs, GWAS, single-cell expression and regulatory region. b, Heatmap of cell-type-specific expression of identified CKD target genes. The blue/yellow color corresponds to the level of expression (z-score). Endo, endothelial; Podo, podocyte; PT, proximal tubule; LOH, loop of Henle; DCT, distal convoluted tubule; CD-PC, collecting duct principal cell; CD-IC, collecting duct intercalated cell; Fibro, fibroblast; Macro, macrophage; Neutro, neutrophil; NK, natural killer cell. c, Density plots of best eVariants in tubule (top) and glomerulus (bottom) and the relationship to transcription start site (TSS). d, Distance of top eVariants from TSS (-log10) by groups. e, Odds ratios of the top eVariants on kidney promoter by groups. The groups were compared to randomly selected variants matched by MAF and distance to TSS (n = 5,000 randomly selected times). Center lines show the medians; box limits indicate the 25th and 75th percentiles; whiskers extend to the 5th and 95th percentiles, outliers are represented by dots (d, e). f, Odds ratios (y-axis) of eGenes from each group enriched by kidney-specific cell type expression. P was calculated by two-sided Fisher’s exact test. RTEC: PT, LOH and DCT, Myeloid: Fibro, Macro and Neutro; Lymphoid: B cell, T cell and NK. Tubule, tubule-specific-eGenes: n = 417; Share, compartment-shared-eGenes: n = 3,493; Glom, glomerulus-specific-eGenes: n = 674 (d-f). g, Genome scale integrated analysis of gene network (GIANT) visualization of tubule-specific candidate genes. The color of each link shows the relationship confidence, from green (0.01) to red (1).
As observed by GTEx and most prior studies, eQTLs identified by our analysis were mostly enriched on promoters (Supplementary Fig. 3a). Upon examining for binding sites of transcription factors, we found enrichment for SAP30, KDM5A, HDAC1, CREB1, ELK4 and ESRRA, key transcription factors that are proposed to be involved in maintaining the high metabolic rate of proximal tubule cells (Supplementary Fig. 3b).
We reasoned that if compartment-based eQTLs are more informative for GWAS annotation, then compartment-specific eGenes must arise from variants that are localized to cell-type-specific regulatory regions such as distant regulatory regions (e.g., enhancers), rather than proximal regulatory regions (i.e., promoters) that are mostly shared between cell types. When we compared shared and compartment-specific eGenes, we found that their eQTL variants were significantly further away from TSS for compartment-specific compared with shared eGenes, indicating that compartment-specific eQTLs might be linked to more distal (i.e., enhancers) regulatory variants (Fig. 2c, d).
To further investigate this finding, we compared the genomic feature annotations for compartment-specific eGenes and compartment-shared eGenes, using ChIP-Seq data derived from adult human kidney. Compartment-shared eGenes were significantly more enriched in promoters than compartment-specific eGenes (P < 2.2 × 10⁻¹⁶, Wilcox-test) (Fig. 2e). Moreover, we examined whether cell-type-specific enrichment would explain the identification of compartment-specific eGenes. We found that glomerulus-compartment-specific eGenes were significantly enriched for expression in podocyte (P = 2.91 × 10⁻⁷, Fisher’s exact test), and tubule-compartment-specific eGenes were enriched for expression in tubule epithelial cells (P = 6.14 × 10⁻², Fisher’s exact test), indicating that disease-associated target genes are more likely to be cell-type-specific (Fig. 2f).
To gain further insight into kidney disease pathogenesis, we have performed functional annotation of the 27 genes identified by colocalization between kidney compartment-based eQTLs and CKD GWAS. By using the pathway analysis described in GIANT46, we found that these genes identified by tubule compartment were significantly enriched for a single functional group: endo-lysosomal function (FDR = 1.5 × 10⁻²) (Fig. 2g). Combining results from both kidney compartments showed enrichment not only for endo-lysosomal genes but related pathways such as autophagy (FDR = 3.59 × 10⁻²) and mitochondrial degradation pathway (FDR = 4.58 × 10⁻²) (Supplementary Fig. 3c). These results indicate that the expression of the target genes for kidney function are enriched for a limited number of functional groups. Specifically, we noticed that DAB2 had the greatest number of connections in the functional network and represented a central hub.
Identification of DAB2 as a kidney disease gene
To leverage our unique eQTL datasets to identify kidney-specific causal genes for kidney disease, we focused on the DAB2-Complement C9 (C9) CKD GWAS for follow-up functional validation studies. rs11959928 at the DAB2-C9 locus has been significantly associated with CKD in multiple CKD GWA studies9,10,12. The DAB2 and C9 genes are located near rs11959928; however, it was unclear which gene is regulated by the disease-causing variant. In whole kidney level eQTL analysis, the rs11959928 genotype was not significantly associated with either DAB2 or C9 levels30. Compartment-based eQTL analysis identified an association between the rs11959928 genotype and DAB2 level, but not with C9 level. Furthermore, this eQTL was only identified in tubule eQTLs, not in glomerulus eQTLs (Fig. 3a, b). The tubule-specific eQTL effect of rs11959928 on DAB2 can be replicated by a recent kidney cis-eQTLs study47 (Supplementary Fig. 4a). Although DAB2 is broadly expressed in multiple tissues and cell types, rs11959928 was not identified as a significant eQTL in the 44 GTEx tissue samples25 (Fig. 4a). Meta-analysis48 of our kidney compartment and 44 GTEx tissues indicated that rs11959928 showed tubule-specific eQTL effect only on DAB2 (m = 0.855), rather than on C9 (m = 0.407) (Fig. 4b).
Figure 3:
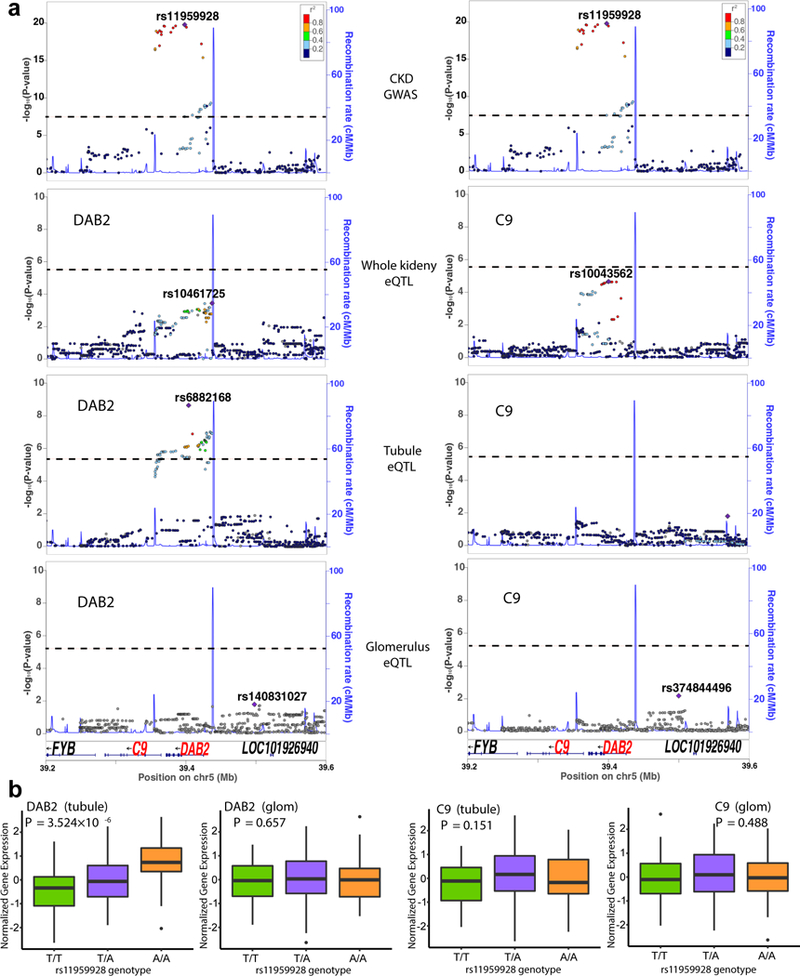
CKD associated GWAS SNP (rs11959928) specifically influences DAB2 levels in human kidney tubules. a, LocusZoom plots of CKD GWAS or eQTL around the region of rs11959928. The y-axis shows -log (P) of association tests (by linear regression). Top, GWAS association (genotype and eGFR as outcome); Bottom, eQTLs (genotype and expression of DAB2 (left) or C9 (right)) in different compartments (whole kidney, tubule or glomerulus). Note the overlapping genetic region associated with kidney function and DAB2 expression. n = 133,814 individuals for CKD GWAS; n = 121 individuals for tubule eQTLs. n = 119 individuals for glomerulus eQTLs; n = 96 individuals for whole kidney eQTLs. Dash lines, significance thresholds (GWAS, P = 5 × 10⁻⁸ ; eQTL, nominal P threshold for individual gene calculated by permutation). b, Genotype (rs11959928) and gene expression (DAB2 or C9) association in human tubules (n = 121) and glomeruli (n = 119). Center lines show the medians; box limits indicate the 25th and 75th percentiles; whiskers extend to the 5th and 95th percentiles, outliers are represented by dots. P was calculated by linear regression.
Figure 4:
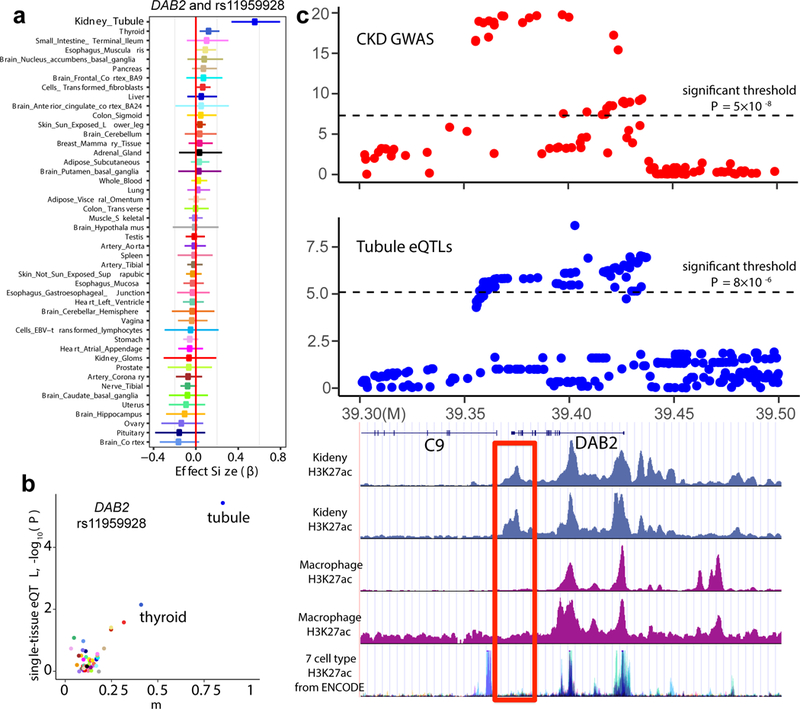
Functional annotation of the genomic area around rs11959928. a, The effect size (β) of eQTL association between rs11959928 and DAB2, in tubular (n = 121) glomerular (n = 119) compartments and 44 human tissues from GTEx (v6p). The x-axis shows effect size (β) with 95% CI. b, Meta-analysis result of association relationship between rs11959928 and DAB2, using eQTLs of kidney compartments and 44 human tissues from GTEx. Each dot represents one tissue data point. The y-axis shows the nominal P of association in each single tissue. The x-axis shows m, the posterior probability calculated by METASOFT, for each tissue. c, Top, LocusZoom plots of GWAS (genotype and eGFR association) and kidney tubule DAB2 eQTLs (genotype and DAB2 expression association). The y-axis show -log (P) of association tests (by linear regression). n = 133,814 individuals for CKD GWAS; n = 121 individuals for tubule eQTLs. Bottom, histone H3K27ac enrichment of the genomic region (analyzed by chromatin immunoprecipitation) in human kidney samples, blood macrophages and the 7 ENCODE cell lines.
Using single-cell RNA-Seq of mouse kidney tissue samples, we found that in the kidney, Dab2 expression is restricted to the proximal tubules and to macrophages (Fig. 2a). While one prior study reported a significant eQTL effect of rs11959928 for DAB2 in peripheral blood mononuclear cells (PBMC)49 that was in the opposite direction (z-score = −32.69, P = 5.123 × 10−124) (Supplementary Fig. 4b); however, this eQTL was not replicated in the whole blood samples of the GTEx dataset (β = 0.032, P = 0.394) (Supplementary Fig. 4c).
Given differences in eQTL effects, we examined the functional annotation of this candidate GWAS and eQTL locus in the human kidney and other tissues/cells by comparing the enrichment for histone H3K27ac, a marker that distinguishes an active enhancer from poised ones. We noticed a binding peak of H3K27ac that is specifically found in kidney, but not in macrophages or any other cells analyzed by ENCODE (Fig. 4c). The kidney-specific enhancer peak coincided with the CKD GWAS region, suggesting that this region might have a functional role in kidney tubule cells and likely explain the existence of a kidney eQTL effect for a gene with a relatively broad expression profile.
Furthermore, we also noted that GTEx (GTEx v7, https://www.gtexportal.org/) reported a kidney-specific DAB2 isoform, when compared to other human tissues. This isoform contains an exon skipping (chr5: 39,382,720–39,383,373, hg19) and was highly expressed in the kidney. Using the LeafCutter50 method for isoform quantification, we confirmed the presence of this isoform in our human kidney tubule dataset (Supplementary Fig. 4d). Kidney-specific isoform expression can also contribute to the specific eQTL effect on DAB2 in tubule cells. In summary, we have identified the CKD associated variant rs11959928 with renal tubule-specific effects on DAB2 expression levels. Our results indicate a kidney-specific isoform expression and a kidney-specific enhancer peak at this locus that is not present in other cell types and suggest genetic variation at this enhancer could lead to kidney diseases through higher DAB2 expression in renal tubules.
Dab2 alters kidney disease development in mice
To determine whether C9 or Dab2 plays a role in kidney disease development, we performed in vivo validation using animal models with reduced gene dosage. Global knock-out and heterozygous C9 mice were phenotypically normal and we did not observe structural or functional changes in the kidney (Fig. 5a–c). We reasoned that C9 might alter injury response and might still be responsible for kidney disease development. Therefore, we subjected wild-type (WT) and C9+/− mice to folic acid-induced kidney injury (FAN; folic acid nephropathy) (Supplementary Fig. 5a). Transcript levels of kidney fibrosis markers including Fibronectin 1 (Fn1), Collagen 1a1 (Col1a1), and Collagen 3a1 (Col3a1) were significantly higher in WT mice when injected with folic acid. However, we found no differences between WT and C9+/− mice in this CKD model (Fig. 5a). Similar results were obtained when analyzing histological lesion on PAS-stained and Sirius Red-stained kidney sections (Fig. 5b, c).
Figure 5:
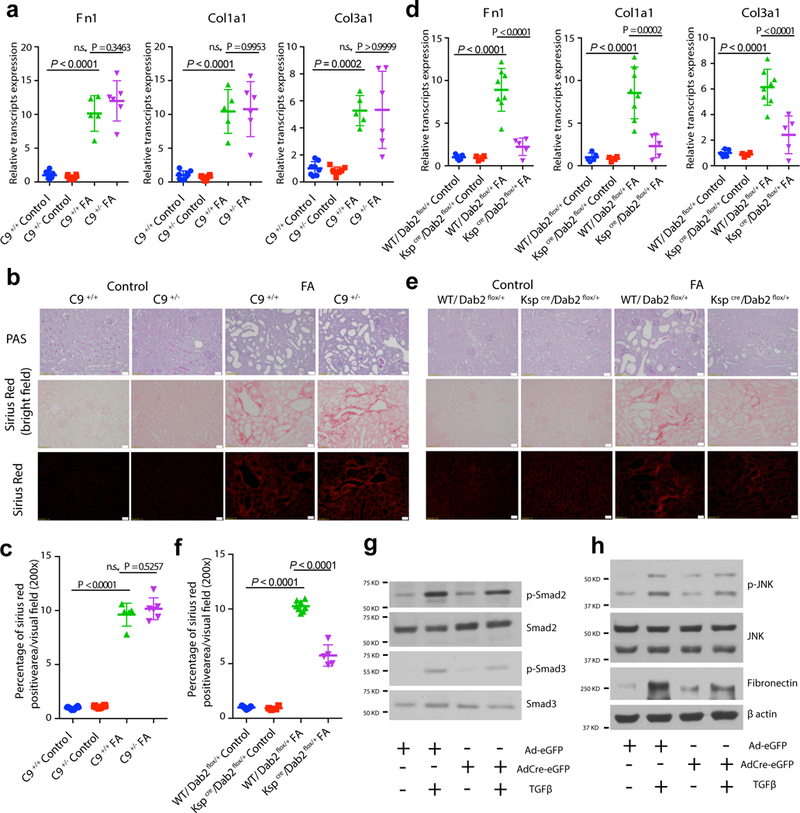
Tubule-specific expression of Dab2 influences kidney disease development in mice. a, Relative mRNA amount of Fibronectin 1, Fn1; Collagen1a1, Col1a1; and Collagen3a1, Col3a1 in C9+/+ and C9+/− mice with or without FA injection. b, Representative images of PAS-stained and Sirius Red-stained kidney sections from C9+/+ and C9 +/− mice with or without FA injection. Scale bar: 20μm. c, Quantification of Sirius Red-stained kidney sections from C9+/+ and C9 +/− mice with or without FA injection. d, Relative mRNA amount of Fn1, Col1a1 and Col3a1 in control and Kspcre/Dab2flox/+ mice with or without FA injection. e, Representative images of PAS-stained and Sirius Red-stained kidney sections from control and Kspcre/Dab2flox/+ mice with or without FA injection. Scale bar: 20μm. f, Quantification of Sirius Red-stained kidney sections from control and Kspcre/Dab2flox/+ mice with or without FA injection. g, h, Representative western blots of p-Smad2, Smad2, p-Smad3, Smad3, p-JNK, JNK, Fibronectin in TGFβ-treated Dab2+/+ and Dab2+/− primary TECs from n = 4 independently repeated experiments. β-actin was used as a loading control. P values were calculated by One-way ANOVA with post-hoc Tukey test (a, c, d, f). C9+/+ Control: n = 8, C9+/− Control: n = 8, C9+/+ FA: n = 5, C9+/− FA: n = 6 (a-c). WT/Dab2flox/+ Control: n = 5, Kspcre/Dab2flox/+ Control: n = 4, WT/Dab2flox/+ FA: n = 8, Kspcre/Dab2flox/+ FA: n = 5 (d-f). Data are represented as mean ± SD.
Next, we studied the role of Dab2, as the CKD GWAS also influenced the expression of Dab2 in the kidney. We generated mice with tubule epithelial-specific dose reduction of Dab2 using the well-characterized tubule-specific Kspcre mice and Dab2flox mice (Supplementary Fig. 5b). The genetic and eQTL study integration suggested that the risk allele was associated with higher DAB2 levels in the kidney (Table 1). We did not observe any renal functional or histological abnormalities in Kspcre/Dab2flox/+ animals at baseline. Next, we subjected these animals to FA-induced acute and chronic kidney injury. A significant lower expression of fibrosis markers (Fn1, Col1a1 and Col3a1) at the mRNA level in Kspcre/Dab2flox/+ mice was observed after FA injection (Fig. 5d). We also found that the degree of disease was significantly less in tubule-specific Dab2 knock-out mice compared with FA-treated WT mice (Fig. 5e, f), indicating that the directionality is consistent with the GWAS effect direction. In additional to the FAN model, we also found a lower level of interstitial fibrosis in mice with tubule-specific loss of Dab2 subjected to unilateral ureter obstruction (UUO). (Supplementary Fig. 5c–e).
To understand the role of Dab2 in kidney fibrosis development, we generated primary renal tubule cells with lower Dab2 levels by infecting cells from Dab2flox/+ mice with Cre-eGFP adenovirus (Supplementary Fig. 6a). Injured TECs release TGFβ (encoded by Tgfb1), which is one of the best-known profibrotic cytokines51,52. TGFβ levels are known to be higher in the UUO model of fibrosis53 and we confirmed the higher Tgfb1 expression in the FA-induced fibrosis mouse model as well (Supplementary Fig. 6b).
We found that lowering the Dab2 level resulted in less TGFβ-induced Smad2 and Smad3 phosphorylation of cultured tubule cells (Fig. 5g). In our experiments, Dab2 had no significant effect on p38 or ERK phosphorylation (Supplementary Fig. 6c), but we found lower JNK phosphorylation in absence of Dab2 (Fig. 5h). As Smad3 and JNK mediate TGFβ-induced profibrotic gene expression, we found that reducing Dab2 levels resulted in less TGFβ-induced fibronectin and collagen1 production in cultured tubule cells (Fig. 5h and Supplementary Fig. 6d).
In summary, these results indicate that Dab2 in tubule cells is a likely causal gene for CKD development as Dab2 plays an important role in TGFβ-induced profibrotic gene expression.
Discussion
The contribution of multiple cell types and mechanisms to kidney disease pathogenesis has been proposed. A key limitation to disease understanding is that most human studies cannot go beyond descriptive and correlative analysis, and animal models often show limited relevance to human disease development as genotypes are established before disease development. GWA studies provide valuable insight into disease mechanisms. While GWAS has identified non-coding genetic variants associated with CKD, the underlying genes, cell types and mechanism still remains elusive. Here we generated novel datasets and conducted a genome- and transcriptome-wide scan for genetic variants associated with gene expression variation (eQTLs) in two kidney compartments: tubules and glomeruli. While some cell-type-specific eQTL analyses have been performed in blood samples, we believe that this is the first study to directly characterize cell-type specificity of different compartments on solid organ samples38. By integrating this data with prior GWA studies, epigenome analysis and single-cell transcriptome analysis, we have identified putative causal genes for 24 of the 83 GWAS loci.
To date, GTEx has conducted eQTL analysis on 53 human tissues, 44 of which had sufficient sample size for further analyses (GTEx v6p). Kidney, however, was not included due to the limited sample size25. By comparing our results with GTEx, we showed that the majority of eQTLs are shared between multiple GTEx tissue types as well as two kidney compartments. Strikingly though, we observed that previously identified CKD GWAS loci were more likely to be associated with eQTLs that are compartment-specific, reside further away from promoters and possibly act by modulating compartment-specific active enhancers compared to those identified by bulk-sequencing data analysis. Our study highlights that cell-type-specific eQTL and epigenome datasets are crucial components of post-GWAS prioritization and mechanism studies. Deeper insight into these cell-type-specific mechanisms may reveal that many diseases and conditions are perturbations of a specific cell type rather than specific organs.
Next, we investigated whether specific regulatory elements were enriched for compartment-specific or compartment-shared eQTLs. Functional annotation analysis indicated that compartment- and tissue-shared eQTLs were more likely to be located in promoter regions. On the other hand, by incorporating single-cell mouse kidney RNA-Seq data, we demonstrate that disease-specific target gene regulation is likely to be cell-type-specific and the most likely causal GWAS variants are localized to cell-type-specific enhancers. We then focused on the DAB2 locus to illustrate such cell-type-specific eQTL and enhancer effects.
We used comprehensive and novel compartment-specific RNA-Seq dataset, computational analysis as well as rigorous in vitro and in vivo assays to identify DAB2 as a new causal gene for CKD pathophysiology. The rs11959928 variant has been associated with CKD in multiple GWAS10–12. Yet, this variant was not associated with gene expression changes in GTEx25 or in bulk kidney eQTL datasets30. Furthermore, even though DAB2 is expressed across multiple cell types, we observed that this variant only displays tubule-specific effects on DAB2 expression. Single-cell RNA-Seq data further refined the target tissues to two cell types (tubules and macrophages) with high DAB2 expression in the kidney. Of note, a prior report49 showed a macrophage-specific eQTL effect of DAB2 of this variant in the opposite direction. However, this effect and direction was not replicated in the larger GTEx dataset25, and follow-up in vivo results failed to show consistent effects of macrophage-specific Dab2 reduction on kidney fibrosis development (S. H. and K. S. unpublished data). Based on the replicated eQTL effect, combination of strong colocalization between the tubule-specific eQTLs and CKD GWAS, and the protection from kidney injury observed in DAB2 knock-out mice, we conclude that the CKD risk allele at the DAB2 locus from GWAS is associated with higher expressed levels of DAB2 in tubule cells, leading to tubular fibrosis.
DAB2 is a central adaptor protein in several receptor-mediated pathways54. In vitro studies showed that DAB2 is required for TGFβ-mediated signaling in epithelial cells55. TGFβ is one of the strongest inducers of kidney fibrosis and CKD51. The CKD risk-increasing allele of the underlying causal variant likely modifies this enhancer function specifically in tubule cells, raising cytokine levels (including TGFβ), thus altering endocytosis and inducing downstream development of fibrosis through DAB2. We demonstrate the role of tubule-specific DAB2 in kidney disease development using cell-type-specific knock-out mice.
Through gene-gene network analysis, we also show that these 24 putative causal genes are enriched in a specific kidney cell type and highlight the endo-lysosomal pathway as a likely pathophysiological mechanism in the proximal tubules for kidney disease development. Proximal tubule epithelial cells are the most common cell type in the kidney and dedifferentiation of these highly specialized cells has been linked to a reduction in kidney function and the development of kidney disease56,57. The proximal tubules play a key role in initial processing of the primary blood filtrate as the renal glomerulus processes more than 144 liters of primary filtrate a day. Further, the proximal tubules have one of the highest levels of endocytic activity in the body to reclaim critical nutrients from the primary filtrate58. Alterations in the endocytic, lysosomal and autophagy pathways of these cells have been previously observed in animal models and individuals with kidney disease59,60. Now, our genetic studies can help to refocus attention to this specific cell type and mechanisms in CKD development.
In summary, this is one of the first and extensive post-GWAS annotations of CKD risk loci. We combined compartment-specific transcriptome, genome, epigenome and single-cell sequencing data to identify novel genes, cell types and mechanisms contributing to the CKD pathophysiology. The integration of these datasets is critically needed information for the field. Our data delivered novel biological insight by the identification of DAB2 as kidney disease-causing gene and an additional 26 putative candidate genes. We also show that renal tubule cells and the endo-lysosomal pathway play an important role in CKD, providing a novel mechanism for disease development.
Online Methods
Sample procurement
Human kidney tissue collection was approved by the University of Pennsylvania Institutional Review Board. Kidney samples were obtained from surgical nephrectomies. Nephrectomies were de-identified, and the corresponding clinical information was collected through an honest broker; therefore, no consent was obtained from the subjects.
Collected tissue was immersed in RNAlater (Ambion#AM7020) solution at 4°C for several hours prior to being stored at −80°C in RNAlater. Tissue was thawed on ice, placed in RNAlater, and manually microdissected for glomerular and tubular compartments. In general, 60–150 glomeruli that readily released from the capsule were collected and placed into RNeasy RNA Tissue Lysis Buffer Solution (per Qiagen RNeasy kit manufacturer instructions (Qiagen#74106)). We refer to the remaining compartment as tubule throughout the article.
Part of the tissue core was formalin fixed and paraffin embedded. These samples were later sectioned and stained with Hematoxylin eosin or periodic acid schiff. Our local renal pathologist performed an unbiased review of the tissue section by scoring multiple parameters.
DNA was isolated using the Qiagen DNAeasy or MagAttract High Molecular Weight DNA Kit (Qiagen#67563) according to the manufacturer’s instructions. DNA was quantified by the Invitrogen Quant-iT PicoGreen dsDNA Assay Kit (Invitrogen#P11496).
Data production
Genomic DNA isolated from whole kidney or tubule tissue was used for genotyping. 424 individuals were genotyped using Affymetrix Axiom Biobank genotyping array. Quality control steps were performed using PLINK 1.961, and ultimately, we excluded 16 samples. First, two samples were excluded due to their SNP data which were ambiguous regarding sex. An additional four samples were excluded because of their low call-rate (<5%), and another two samples were excluded because of elevated heterozygosity (Supplementary Fig. 7a). To further identify potential sample contamination, identity-by-descent (IBD) was computed between all pairwise sample combinations, and eight samples were excluded due to their high PI_HAT (>0.2).
To quantify population structure, Principal Component Analysis (PCA) implemented in EIGENSTRAT was conducted on these final 408 samples, with additional genotype data from 395 HapMap2 samples (112 CEU, 84 CHB, 86 JPT, 113 YRI) and 2,504 samples from the 1000 Genomes Project Phase 1 (release v3, 661 AFR, 347 AMR, 504 EAS, 503 EUR, 489 SAS), respectively62,63. Plots of the two main principal components (PCs) for each dataset are shown in Supplementary Fig. 7b, c. Subsequently, genotypes of the 408 samples were phased with SHAPEIT264 and imputed with IMPUTE265, using multi-ethnic panel reference66 from 1000 Genomes Phase 1 v3.
Separated by two kidney compartments, RNA was isolated from a total of 329 tubule samples and 311 glomerulus samples from up to 359 individuals. RNA quality was assessed with the Agilent Bioanalyzer 2100. Only samples with RIN scores above 7 and a minimum total RNA of 100 ng were used for cDNA production. Non-strand specific, polyA+ selected RNA-Seq libraries were generated using the Illumina TruSeq protocol. Libraries were sequenced to a median depth of 35 million 100-bp single-end reads. After first assessing sequence quality using FastQC and then trimming the adaptor and lower-quality bases using Trim-galore, RNA-Seq reads were aligned to the human genome (hg19/GRCh37) using STAR (v2.4.1d) based on GENCODE v19 annotations29,67. Gene-level expression was estimated on uniquely mapped reads as reads per kilobase of transcript per million mapped reads (RPKM) using HTSeq 0.9.168 and DESeq269. Samples with less than 15 million mapped reads were excluded.
For eQTL analysis, only samples with European ancestry and absence of significant kidney structural changes (tubular fibrosis < 10%, glomerular sclerosis < 10%) were used. Variants were excluded from analysis if they had: (1) call rate < 95%; (2) Minor allele frequency (MAF) < 5%; (3) deviated from Hardy-Weinberg Equilibrium (P < 10−6); and (4) imputation info score less than 0.4. Finally, 121 samples were used for tubule eQTL analysis, and 119 samples were used for glomerulus eQTL analysis, respectively. In addition, genotype-based PCA analysis was conducted again using now the final set of tubule and glomerulus samples, respectively, and then the first six PCs were used as covariates (Supplementary Fig. 7d, e). We also generated a VCF file with dosages for alternative allele counts used as input for the Matrix eQTL and FastQTL software packages70,71.
Cis-eQTL mapping
We conducted cis-eQTL (further just referred to as eQTL) mapping with 121 samples of tubules and 119 samples of glomeruli, respectively. Only genes having at least 0.1 RPKM in 2 or more samples were considered significantly expressed and used for eQTL mapping. Within each compartment, quantile-normalization was performed on RPKMs, and then expression measurements for each gene were rank-based inverse normal transformed. To remove the effects of unobserved confounding variables, PEER was performed for 15 factors on gene expression with age, gender, collected site, sequencing batch, RIN, and fibrosis percentage (for tubule samples) or sclerosis percentage (for glomerulus samples) as covariates72. The Pearson correlation P between known clinical variables and 15 PEER factors calculated by 121 tubule RNA-Seq samples are shown in Supplementary Fig. 7f. The Pearson correlation P between known clinical variables and 15 PEER factors calculated by 119 glomerulus RNA-Seq samples are shown in Supplementary Fig. 7g. Finally, once the PEER factors were regressed out, the residuals of the analysis with rank-based inverse normal transformation were used as expression measurements in following eQTL mapping, and 32,596 genes were used for tubule analysis as well as 31,635 for glomeruli analysis.
The cis window was defined as 1 megabase up- and down-stream of the transcriptional start site (± 1Mb), and we tested about 1.25 × 10⁸ gene-SNP pairs for each compartment. Nominal P were calculated for each SNP-gene pair with FastQTL using linear regression with an additive effect model and adjusted by six genotype PCs. Significance of the top associated variant per gene was estimated by adaptive permutation with the setting “--permute 10000” in FastQTL. Beta distribution-adjusted empirical P were used to calculate q using Storey’s q method73, and a q threshold ≤ 0.05 was applied to identify eGenes (eQTL-containing genes).
Next a genome-wide empirical P threshold, Pt, was defined as the empirical P of the gene closest to the 0.05 FDR threshold. Pt was used to calculate a nominal P threshold for each gene based on the beta distribution model (from FastQTL) of the minimum P distribution f(Pmin) obtained from the permutations for the gene. For each eGene, variants with a nominal P below the gene-level threshold were considered significant as eVariants25.
Meta-analysis of multiple-tissue eQTL mapping
The eQTL summary results of 44 other human tissues were downloaded from GTEx [v6p; www.gtexprotal.org]25. To evaluate which of the GTEx eQTLs replicated the significant SNP-gene pair eQTLs found in the kidney eQTL study, the π1 statistic was calculated to estimate the fraction of true positive eQTLs, considering the formula π1 = 1 - π0, where π0 is the estimated fraction of null eQTLs from the full distribution of P. For example, for tubule eQTL, eGenes and their top significant SNPs were selected. The nominal P of these SNP-gene pairs in another GTEx eQTL were extracted, and then π1 was calculated on these P using Storey’s q method73.
To further define tubule-specific eGenes and glomerulus-specific eGenes, METASOFT, a meta-analysis method, was performed on all variant-gene pairs that were significant (FDR < 5%) in at least one of the 46 tissues (2 kidney compartments and 44 GTEx tissues) based on the single-tissue results from FastQTL. A random effects model in METASOFT (called RE2) was used and the posterior probability that an eQTL effect exists in a given tissue (called m) was calculated for each SNP-gene pair and tissue tested48. A significance cutoff of m > 0.9 was used to discover high-confidence eQTLs. Based on this meta-analysis result, tubule-specific eGenes (glomerulus-specific eGenes) were defined as having m > 0.9 in less than 5 tissues, including tubule (glomerulus). In contrast, tubule-shared eGenes (glomerulus-shared eGenes) were defined as having m > 0.9 in more than 40 tissues, including tubule (glomerulus) (Supplementary Fig. 8a).
To further test the sensitivity of the original results to these cut-offs, we changed the threshold numbers and re-estimated the enrichment results of tubule-specific eGenes and tubule-shared eGenes. Even though the P are slightly inflated, we found that chronic kidney disease, glomerular filtration rate, and metabolite traits are still the top traits enriched for tubule-specific eGenes, as well as tubule-shared eGenes are enriched by some common human diseases (Supplementary Fig. 8b–d).
To identify tubule-compartment-specific eGenes, glomerulus-compartment-specific eGenes and kidney-compartment-shared eGenes, Meta-tissue, which was used to address effect size heterogeneity to detect eQTLs across multiple tissues, was performed on three eQTLs datasets74, tubule eQTLs, glomerulus eQTLs and our previous whole kidney eQTLs30, to remove the effect brought by collecting multiple tissues from the same individuals.
Functional annotation
Traits and disease associated significant genetic variants were extracted from GWAS Catalog v1.0.1 (accessed 1/4/2017, https://www.ebi.ac.uk/gwas/)41. These variants were used for enrichment analysis for kidney compartment eQTLs.
Human kidney-specific ChIP-Seq data can be found at GEO: GSM621634, GSM670025, GSM621648, GSM772811, GSM621651, GSM1112806, GSM621638. Different histone markers were combined into chromatin states using ChromHMM75,76. To quantify kidney eQTL enrichment in these regulatory regions, the top significant SNPs per eGenes were used as tested eQTL subset. To calculate enrichment significance, the data was compared between the tested eQTL subset and a randomly selected SNP set that was matched for MAF (< 0.01) and distance to TSS of target genes (< 2.5kb).
Transcription Factor ChIP-Seq (161 factors) was extracted from ENCODE project TFBS clusters (V3), and the enrichment analysis procedure was as same as former29.
GWAS analysis
Leading SNPs of CKD GWAS
eGFR-associated GWAS SNPs were collected from the CKDGen Consortium and several other studies to determine whether kidney disease traits in our eQTLs were enriched9–12. This step yielded 83 leading SNPs.
Coloc
To estimate the posterior probabilities of whether two potentially related phenotypes – kidney disease and kidney compartment gene expression – share common genetic causal variants in a given region, we performed colocalization analyze using coloc42 and summary data of GWAS and eQTL analyses. The eGFR-associated GWAS study from CKDGen Consortium was used as CKD GWAS dataset. Then, the summary data from both studies of SNPs within 100 kilobase of each leading SNP were used to calculate the posterior probability. In the coloc results, H3 represents the posterior probability of both traits are associated, but with different causal variants; H4 represents the posterior probability that both traits are associated and share a single causal variant. We used PP_H4 > 0.8 as the threshold of colocalization.
RTC
Regulatory Trait Concordance (RTC) score was used to assess whether a GWAS SNP tags the same functional variant as a regulatory variant43. In short, if an eQTL variant and GWAS leading SNP were located in the same region between recombination hotspots, the eQTL phenotype (gene expression) was corrected for all the N variants within this region using linear regression, and then the residuals were used as N pseudo-phenotypes. The P, obtained by testing for eQTL association between the eQTL variant and these N pseudo-phenotypes, were sorted (descending) and ranked. Then, the rank of the P obtained from the pseudo-phenotype corrected by GWAS SNP was used to calculate the RTC score: (N-GWASrank) / N. The RTC score ranges from 0 to 1, and 1 represents higher likelihood of shared effect between eQTL and GWAS.
Single-cell RNA-Seq of mouse kidney
Single-cell RNA-Seq libraries were generated using the 10X Chromium Single Cell instrument and the 10X Chromium TM Single cell 3’ Library Kit according to the manufacturer’s original protocol. We have generated single cell suspensions from seven different mouse kidney samples. The single-cell sequencing libraries were sequenced on an Illumina HiSeq with 2×150 paired-end kit. The sequencing reads were demultiplexed, aligned to the mouse genome (mm10) and processed to generate gene-cell data matrix using Cell Ranger 1.3 (http://10xgenomics.com). We have sequenced 57,979 mouse kidney cells36.
Cells were clustered using dimension reduction. We identified 3 cell types in the glomerulus and 7 kidney cell types in the tubule, in addition to 6 immune cells. Of the entire 16 cell clusters identified by single-cell RNA-Seq in mice, 13 are previously known cell types and while the other 3 are novel cell types.
Pathway analysis of candidate genes
The pathway analysis of candidate genes, identified by colocalization between eGFR GWAS and kidney compartment-based eQTLs, was performed by the web-based program, GIANT (http://giant.princeton.edu)46.
Decompose tubule compartment tissue by various segments
CIBERSORT was developed to identify the relative levels of distinct cell types within a complex expression admixture40. Here, we use RNA-Seq data of microdissected rat kidney tubule segments39 (https://hpcwebapps.cit.nih.gov/ESBL) as signature matrix, to decompose our 121 tubule samples, identifying their segment composition.
Isoform detection using LeafCutter
LeafCutter50 is used to quantify RNA splicing variation using short-read RNA-Seq data by leveraging reads that span each intron to quantify intron usage across samples (http://davidaknowles.github.io/leafcutter/). We performed LeafCutter on 121 tubule RNA-Seq samples, by which a specific exon deletion was identified on DAB2.
SMR
SMR77 (Summary-data-based Mendelian Randomization) is used to test for potential causal effects of, e.g. gene on complex trait, given a SNP as an instrumental variable, using summary-level data from GWAS and eQTL studies. We performed SMR on CKD GWAS and eQTLs (tubule and blood49 separately) to estimate the direction of expression changes of DAB2 with eGFR, using multiple variants in the cis-eQTL region of the gene.
Mice
C9 knock-out mice purchased from Jackson Lab (Stock No: 022779) were kindly provided by Dr. Wen-chao Song from University of Pennsylvania. Dab2flox/flox mice were kindly provided by Dr. Xiang-Xi Xu from University of Miami78,79. Kspcre mice were purchased from Jackson Lab (Stock No: 012237). 8- to 10-week-old male mice were used in this study. Mice were injected with FA (250 mg/kg, dissolved in 300mM NaHCO3) intraperitoneally and sacrificed 1 week later. For the UUO model, mice underwent ligation of the left ureter, and sacrificed 1 week later. Sham-operated mice were used as controls. Animal studies were approved by the Animal Care Committee of the University of Pennsylvania.
Quantitative Real-Time PCR
RNA was isolated using RNeasy Mini Kit per manufacturer’s instructions. 1μg RNA was reverse transcribed using cDNA archival kit (Applied Biosystems#4368813), and quantitative real-time PCR was conducted in the ViiA 7 System (Applied Biosystems) machine using SYBRGreen Master Mix (Applied Biosystems#A25742). The data were normalized and analyzed using the delta/delta CT method. Primers used are listed in Supplementary Table 4.
Histological analysis
We used formalin-fixed, paraffin-embedded kidney sections stained with periodic acid Schiff (PAS) or Picrosirius red (Polyscience#24901). Slides were examined, and pictures were taken with an Olympus BX43 microscope and Olympus DP73 Diagnostic CCD camera. Quantification was performed on Sirius Red-stained kidney sections. For each section, five random fields were quantified in an unbiased manner using ImageJ. Immunohistochemistry images of LRRC3 (https://www.proteinatlas.org/ENSG00000160233-LRRC3/tissue/kidney#img) and ANXA2 (https://www.proteinatlas.org/ENSG00000182718-ANXA2/tissue/kidney#img) were downloaded from Human Protein Atlas (v18.proteinatlas.org) 80.
Primary Culture of Renal Tubule Cells
Kidneys were collected from Dab2flox/+mice (males, 3–5 weeks old). Cells were isolated by 2 mg/ml collagenase I (Worthington Biochemical Product#CLS-1) digestion for 30 min at 37°C with gentle stirring. Cells were then filtered through the 100-mm mesh to isolate single cells. Cell suspensions were cultured in RPMI 1640 (Corning#10–040-CM) supplement with 10% fetal bovine serum (Atlanta Biologicals#S11950), 20 ng/ml EGF (Peprotech#AF-100–15), 1 × ITS (Gibco#51500–056), and 1% penicillin-streptomycin (Corning#30–002-CI) at 5% CO2, at 37°C. When cell confluence reached 70%, the media were changed with serum-free RPMI and infected with Ad5CMV-eGFP (Ad-GFP) or Ad5CMVCre-eGFP (Ad-Cre-eGFP) (University of Iowa Gene Transfer Vector Core, Iowa City, IA) at 4 × 10¹⁰ plaque forming units/ml for 24h. Infection efficiency was estimated under fluorescence microscope by the presence of GFP-positive cells. After that, cells were treated with 5 ng/ml TGFβ (Peprotech#100–21) for 24 h.
Western blot analysis
Cell lysates were prepared with SDS lysis buffer containing protease inhibitor cocktail (Complete Mini, Roche#11836153001) and phosphatase inhibitor (PhosSTOP, Roche# 4906837001). Proteins were resolved on 8–12% gradient gels, transferred on to polyvinylidene difluoride membranes and probed with antibodies as below; Dab2 (BD Transduction Laboratories#610464; 1:1000), Phospho-Smad2 (Cell signaling#3108; 1:1000), Smad2 (Cell signaling#5339; 1:2000), Phospho-Smad3 (Abcam#ab52903; 1:1000), Smad3 (Abcam#ab40854; 1:2000), Phospho-JNK (Cell signaling#4668; 1:2000), JNK (Cell signaling#9252; 1:2000), Phospho-Erk1/2 (Cell signaling#4370; 1:2000), Erk1/2 (Cell signaling#4695; 1:2000), Phospho-p38 (Cell signaling#4511; 1:2000), p38 (Cell signaling#8690; 1:2000), Fibronectin (Abcam#ab32419, 1:2000). Anti-rabbit (Cell Signaling#7074) or anti-mouse (Cell Signaling#7076) IgG horseradish peroxidase (HRP) was used as a secondary antibody. Blots were detected by enhanced chemiluminescence (Western Lightning-ECL, Thermo Scientific). The full scans of the Western blots are showed in Supplementary Fig. 9.
Statistics
Statistical analyses for animal study were performed using GraphPad Prism 6.0 software. All values are expressed as mean and standard deviation (SD). Unpaired two-sided Student’s t test was used for comparisons between two groups. One-way ANOVA with post-hoc Tukey test was used to compare multiple groups. P less than 0.05 was considered statistically significant.
Reporting Summary
Further information on experimental design is available in the Nature Research ‘Life Sciences Reporting Summary’ linked to this article.
Supplementary Material
Acknowledgments
This work in the Susztaklab has been supported by the National Institute of Health NIH R01 DK087635, DK076077 and DP3108220, Boehringer Ingelheim, the Eli Lilly Co. and the Juvenile Diabetes Research Foundation. The authors thank the Molecular Pathology and Imaging Core (P30-DK050306) and Diabetes Research Center (P30-DK19525) at University of Pennsylvania for their services.
J.Hill, P.J., J.Hawkins, C.M.B.-K. and S.S.P. are full time employees of Boehringer Ingelheim Pharmaceuticals, Inc. This work has been supported by Boehringer Ingelheim Pharmaceuticals, Inc, and the Eli Lilly Co.
Footnotes
Competing Financial Interests Statement
Accession code
RNA-Seq data has been deposited in the Gene Expression Omnibus (GEO) with the accession code GSE115098, and additional data are in process.
Data availability
The eQTL data is publicly available at http://susztaklab.com/eqtl. RNA-Seq data has been deposited in the Gene Expression Omnibus (GEO) with the accession code GSE115098, and additional data are in process. Since the samples were collected from de-identified kidney tissue samples, no consent was obtained to share individual-level genotype data.
References
- 1.Eckardt KU, et al. Evolving importance of kidney disease: from subspecialty to global health burden. Lancet 382, 158–169 (2013). [DOI] [PubMed] [Google Scholar]
- 2.Webster AC, Nagler EV, Morton RL & Masson P Chronic Kidney Disease. Lancet 389, 1238–1252 (2017). [DOI] [PubMed] [Google Scholar]
- 3.Rhee CM & Kovesdy CP Epidemiology: Spotlight on CKD deaths-increasing mortality worldwide. Nat Rev Nephrol 11, 199–200 (2015). [DOI] [PMC free article] [PubMed] [Google Scholar]
- 4.Sud M, Tangri N, Pintilie M, Levey AS & Naimark DM Progression to Stage 4 chronic kidney disease and death, acute kidney injury and hospitalization risk: a retrospective cohort study. Nephrol Dial Transplant 31, 1122–1130 (2016). [DOI] [PubMed] [Google Scholar]
- 5.Garrett MR, Pezzolesi MG & Korstanje R Integrating human and rodent data to identify the genetic factors involved in chronic kidney disease. J Am Soc Nephrol 21, 398–405 (2010). [DOI] [PMC free article] [PubMed] [Google Scholar]
- 6.Braun DA, et al. Mutations in nuclear pore genes NUP93, NUP205 and XPO5 cause steroid-resistant nephrotic syndrome. Nat Genet 48, 457–465 (2016). [DOI] [PMC free article] [PubMed] [Google Scholar]
- 7.Tory K, et al. Mutation-dependent recessive inheritance of NPHS2-associated steroid-resistant nephrotic syndrome. Nat Genet 46, 299–304 (2014). [DOI] [PubMed] [Google Scholar]
- 8.Fox CS, et al. Genomewide linkage analysis to serum creatinine, GFR, and creatinine clearance in a community-based population: the Framingham Heart Study. J Am Soc Nephrol 15, 2457–2461 (2004). [DOI] [PubMed] [Google Scholar]
- 9.Pattaro C, et al. Genetic associations at 53 loci highlight cell types and biological pathways relevant for kidney function. Nat Commun 7, 10023 (2016). [DOI] [PMC free article] [PubMed] [Google Scholar]
- 10.Kottgen A, et al. New loci associated with kidney function and chronic kidney disease. Nat Genet 42, 376–384 (2010). [DOI] [PMC free article] [PubMed] [Google Scholar]
- 11.Okada Y, et al. Meta-analysis identifies multiple loci associated with kidney function-related traits in east Asian populations. Nat Genet 44, 904–909 (2012). [DOI] [PMC free article] [PubMed] [Google Scholar]
- 12.Kottgen A, et al. Multiple loci associated with indices of renal function and chronic kidney disease. Nat Genet 41, 712–717 (2009). [DOI] [PMC free article] [PubMed] [Google Scholar]
- 13.Witte JS, Visscher PM & Wray NR The contribution of genetic variants to disease depends on the ruler. Nat Rev Genet 15, 765–776 (2014). [DOI] [PMC free article] [PubMed] [Google Scholar]
- 14.Chatterjee N, Shi J & Garcia-Closas M Developing and evaluating polygenic risk prediction models for stratified disease prevention. Nat Rev Genet 17, 392–406 (2016). [DOI] [PMC free article] [PubMed] [Google Scholar]
- 15.Pasaniuc B & Price AL Dissecting the genetics of complex traits using summary association statistics. Nat Rev Genet 18, 117–127 (2017). [DOI] [PMC free article] [PubMed] [Google Scholar]
- 16.Korstanje R & Paigen B From QTL to gene: the harvest begins. Nat Genet 31, 235–236 (2002). [DOI] [PubMed] [Google Scholar]
- 17.Pashos EE, et al. Large, Diverse Population Cohorts of hiPSCs and Derived Hepatocyte-like Cells Reveal Functional Genetic Variation at Blood Lipid-Associated Loci. Cell Stem Cell 20, 558–570 e510 (2017). [DOI] [PMC free article] [PubMed] [Google Scholar]
- 18.Gupta RM, et al. A Genetic Variant Associated with Five Vascular Diseases Is a Distal Regulator of Endothelin-1 Gene Expression. Cell 170, 522–533 e515 (2017). [DOI] [PMC free article] [PubMed] [Google Scholar]
- 19.Musunuru K, et al. From noncoding variant to phenotype via SORT1 at the 1p13 cholesterol locus. Nature 466, 714–719 (2010). [DOI] [PMC free article] [PubMed] [Google Scholar]
- 20.Capellini TD, et al. Ancient selection for derived alleles at a GDF5 enhancer influencing human growth and osteoarthritis risk. Nat Genet 49, 1202–1210 (2017). [DOI] [PMC free article] [PubMed] [Google Scholar]
- 21.Soldner F, et al. Parkinson-associated risk variant in distal enhancer of alpha-synuclein modulates target gene expression. Nature 533, 95–99 (2016). [DOI] [PMC free article] [PubMed] [Google Scholar]
- 22.Claussnitzer M, et al. FTO Obesity Variant Circuitry and Adipocyte Browning in Humans. N Engl J Med 373, 895–907 (2015). [DOI] [PMC free article] [PubMed] [Google Scholar]
- 23.Encode Project Consortium, et al. Identification and analysis of functional elements in 1% of the human genome by the ENCODE pilot project. Nature 447, 799–816 (2007). [DOI] [PMC free article] [PubMed] [Google Scholar]
- 24.Roadmap Epigenomics Consortium, et al. Integrative analysis of 111 reference human epigenomes. Nature 518, 317–330 (2015). [DOI] [PMC free article] [PubMed] [Google Scholar]
- 25.GTEx Consortium, et al. Genetic effects on gene expression across human tissues. Nature 550, 204–213 (2017). [DOI] [PMC free article] [PubMed] [Google Scholar]
- 26.GTEx Consortium. The Genotype-Tissue Expression (GTEx) project. Nat Genet 45, 580–585 (2013). [DOI] [PMC free article] [PubMed] [Google Scholar]
- 27.GTEx Consortium. Human genomics. The Genotype-Tissue Expression (GTEx) pilot analysis: multitissue gene regulation in humans. Science 348, 648–660 (2015). [DOI] [PMC free article] [PubMed] [Google Scholar]
- 28.Consortium EP An integrated encyclopedia of DNA elements in the human genome. Nature 489, 57–74 (2012). [DOI] [PMC free article] [PubMed] [Google Scholar]
- 29.Harrow J, et al. GENCODE: the reference human genome annotation for The ENCODE Project. Genome Res 22, 1760–1774 (2012). [DOI] [PMC free article] [PubMed] [Google Scholar]
- 30.Ko YA, et al. Genetic-Variation-Driven Gene-Expression Changes Highlight Genes with Important Functions for Kidney Disease. Am J Hum Genet 100, 940–953 (2017). [DOI] [PMC free article] [PubMed] [Google Scholar]
- 31.Yeo NC, et al. Shroom3 contributes to the maintenance of the glomerular filtration barrier integrity. Genome Res 25, 57–65 (2015). [DOI] [PMC free article] [PubMed] [Google Scholar]
- 32.Trudu M, et al. Common noncoding UMOD gene variants induce salt-sensitive hypertension and kidney damage by increasing uromodulin expression. Nat Med 19, 1655–1660 (2013). [DOI] [PMC free article] [PubMed] [Google Scholar]
- 33.Trynka G, et al. Chromatin marks identify critical cell types for fine mapping complex trait variants. Nat Genet 45, 124–130 (2013). [DOI] [PMC free article] [PubMed] [Google Scholar]
- 34.Schiffer M, et al. Pharmacological targeting of actin-dependent dynamin oligomerization ameliorates chronic kidney disease in diverse animal models. Nat Med 21, 601–609 (2015). [DOI] [PMC free article] [PubMed] [Google Scholar]
- 35.Raj T, et al. Polarization of the effects of autoimmune and neurodegenerative risk alleles in leukocytes. Science 344, 519–523 (2014). [DOI] [PMC free article] [PubMed] [Google Scholar]
- 36.Park J, et al. Single-cell transcriptomics of the mouse kidney reveals potential cellular targets of kidney disease. Science 360, 758–763 (2018). [DOI] [PMC free article] [PubMed] [Google Scholar]
- 37.Fairfax BP, et al. Genetics of gene expression in primary immune cells identifies cell type-specific master regulators and roles of HLA alleles. Nat Genet 44, 502–510 (2012). [DOI] [PMC free article] [PubMed] [Google Scholar]
- 38.Ishigaki K, et al. Polygenic burdens on cell-specific pathways underlie the risk of rheumatoid arthritis. Nat Genet 49, 1120–1125 (2017). [DOI] [PubMed] [Google Scholar]
- 39.Lee JW, Chou CL & Knepper MA Deep Sequencing in Microdissected Renal Tubules Identifies Nephron Segment-Specific Transcriptomes. J Am Soc Nephrol 26, 2669–2677 (2015). [DOI] [PMC free article] [PubMed] [Google Scholar]
- 40.Newman AM, et al. Robust enumeration of cell subsets from tissue expression profiles. Nat Methods 12, 453–457 (2015). [DOI] [PMC free article] [PubMed] [Google Scholar]
- 41.MacArthur J, et al. The new NHGRI-EBI Catalog of published genome-wide association studies (GWAS Catalog). Nucleic Acids Res 45, D896–D901 (2017). [DOI] [PMC free article] [PubMed] [Google Scholar]
- 42.Giambartolomei C, et al. Bayesian test for colocalisation between pairs of genetic association studies using summary statistics. PLoS Genet 10, e1004383 (2014). [DOI] [PMC free article] [PubMed] [Google Scholar]
- 43.Nica AC, et al. Candidate causal regulatory effects by integration of expression QTLs with complex trait genetic associations. PLoS Genet 6, e1000895 (2010). [DOI] [PMC free article] [PubMed] [Google Scholar]
- 44.Howard MF, et al. Mutations in PGAP3 impair GPI-anchor maturation, causing a subtype of hyperphosphatasia with mental retardation. Am J Hum Genet 94, 278–287 (2014). [DOI] [PMC free article] [PubMed] [Google Scholar]
- 45.Araki T, Hayashi M, Nakanishi K, Morishima N & Saruta T Caspase-9 takes part in programmed cell death in developing mouse kidney. Nephron Exp Nephrol 93, e117–124 (2003). [DOI] [PubMed] [Google Scholar]
- 46.Greene CS, et al. Understanding multicellular function and disease with human tissue-specific networks. Nature Genetics 47, 569–576 (2015). [DOI] [PMC free article] [PubMed] [Google Scholar]
- 47.Gillies C, et al. An eQTL landscape of Kidney Tissue in Human Nephrotic Syndrome. Am J Hum Genet (2018). [DOI] [PMC free article] [PubMed]
- 48.Han B & Eskin E Random-effects model aimed at discovering associations in meta-analysis of genome-wide association studies. Am J Hum Genet 88, 586–598 (2011). [DOI] [PMC free article] [PubMed] [Google Scholar]
- 49.Westra HJ, et al. Systematic identification of trans eQTLs as putative drivers of known disease associations. Nat Genet 45, 1238–1243 (2013). [DOI] [PMC free article] [PubMed] [Google Scholar]
- 50.Li YI, et al. Annotation-free quantification of RNA splicing using LeafCutter. Nat Genet 50, 151–158 (2018). [DOI] [PMC free article] [PubMed] [Google Scholar]
- 51.Meng XM, Nikolic-Paterson DJ & Lan HY TGF-beta: the master regulator of fibrosis. Nat Rev Nephrol 12, 325–338 (2016). [DOI] [PubMed] [Google Scholar]
- 52.Borges FT, et al. TGF-beta1-containing exosomes from injured epithelial cells activate fibroblasts to initiate tissue regenerative responses and fibrosis. J Am Soc Nephrol 24, 385–392 (2013). [DOI] [PMC free article] [PubMed] [Google Scholar]
- 53.Sato M, Muragaki Y, Saika S, Roberts AB & Ooshima A Targeted disruption of TGF-beta1/Smad3 signaling protects against renal tubulointerstitial fibrosis induced by unilateral ureteral obstruction. J Clin Invest 112, 1486–1494 (2003). [DOI] [PMC free article] [PubMed] [Google Scholar]
- 54.Hocevar BA, Smine A, Xu XX & Howe PH The adaptor molecule Disabled-2 links the transforming growth factor beta receptors to the Smad pathway. EMBO J 20, 2789–2801 (2001). [DOI] [PMC free article] [PubMed] [Google Scholar]
- 55.Prunier C & Howe PH Disabled-2 (Dab2) is required for transforming growth factor beta-induced epithelial to mesenchymal transition (EMT). J Biol Chem 280, 17540–17548 (2005). [DOI] [PubMed] [Google Scholar]
- 56.Edeling M, Ragi G, Huang S, Pavenstadt H & Susztak K Developmental signalling pathways in renal fibrosis: the roles of Notch, Wnt and Hedgehog. Nat Rev Nephrol 12, 426–439 (2016). [DOI] [PMC free article] [PubMed] [Google Scholar]
- 57.Reidy K, Kang HM, Hostetter T & Susztak K Molecular mechanisms of diabetic kidney disease. J Clin Invest 124, 2333–2340 (2014). [DOI] [PMC free article] [PubMed] [Google Scholar]
- 58.Zhuo JL & Li XC Proximal nephron. Compr Physiol 3, 1079–1123 (2013). [DOI] [PMC free article] [PubMed] [Google Scholar]
- 59.Kimura T, et al. Autophagy protects kidney proximal tubule epithelial cells from mitochondrial metabolic stress. Autophagy 9, 1876–1886 (2013). [DOI] [PubMed] [Google Scholar]
- 60.Dickson LE, Wagner MC, Sandoval RM & Molitoris BA The proximal tubule and albuminuria: really! J Am Soc Nephrol 25, 443–453 (2014). [DOI] [PMC free article] [PubMed] [Google Scholar]
- 61.Chang CC, et al. Second-generation PLINK: rising to the challenge of larger and richer datasets. Gigascience 4, 7 (2015). [DOI] [PMC free article] [PubMed] [Google Scholar]
- 62.Genomes Project Consortium, et al. A global reference for human genetic variation. Nature 526, 68–74 (2015). [DOI] [PMC free article] [PubMed] [Google Scholar]
- 63.Price AL, et al. Principal components analysis corrects for stratification in genome-wide association studies. Nat Genet 38, 904–909 (2006). [DOI] [PubMed] [Google Scholar]
- 64.Delaneau O, Marchini J & Zagury JF A linear complexity phasing method for thousands of genomes. Nat Methods 9, 179–181 (2011). [DOI] [PubMed] [Google Scholar]
- 65.Howie BN, Donnelly P & Marchini J A flexible and accurate genotype imputation method for the next generation of genome-wide association studies. PLoS Genet 5, e1000529 (2009). [DOI] [PMC free article] [PubMed] [Google Scholar]
- 66.Howie B, Marchini J & Stephens M Genotype imputation with thousands of genomes. G3 (Bethesda) 1, 457–470 (2011). [DOI] [PMC free article] [PubMed] [Google Scholar]
- 67.Dobin A, et al. STAR: ultrafast universal RNA-seq aligner. Bioinformatics 29, 15–21 (2013). [DOI] [PMC free article] [PubMed] [Google Scholar]
- 68.Anders S, Pyl PT & Huber W HTSeq--a Python framework to work with high-throughput sequencing data. Bioinformatics 31, 166–169 (2015). [DOI] [PMC free article] [PubMed] [Google Scholar]
- 69.Love MI, Huber W & Anders S Moderated estimation of fold change and dispersion for RNA-seq data with DESeq2. Genome Biol 15, 550 (2014). [DOI] [PMC free article] [PubMed] [Google Scholar]
- 70.Shabalin AA Matrix eQTL: ultra fast eQTL analysis via large matrix operations. Bioinformatics 28, 1353–1358 (2012). [DOI] [PMC free article] [PubMed] [Google Scholar]
- 71.Ongen H, Buil A, Brown AA, Dermitzakis ET & Delaneau O Fast and efficient QTL mapper for thousands of molecular phenotypes. Bioinformatics 32, 1479–1485 (2016). [DOI] [PMC free article] [PubMed] [Google Scholar]
- 72.Stegle O, Parts L, Piipari M, Winn J & Durbin R Using probabilistic estimation of expression residuals (PEER) to obtain increased power and interpretability of gene expression analyses. Nat Protoc 7, 500–507 (2012). [DOI] [PMC free article] [PubMed] [Google Scholar]
- 73.Storey JD A direct approach to false discovery rates. J Roy Stat Soc B 64, 479–498 (2002). [Google Scholar]
- 74.Sul JH, Han B, Ye C, Choi T & Eskin E Effectively identifying eQTLs from multiple tissues by combining mixed model and meta-analytic approaches. PLoS Genet 9, e1003491 (2013). [DOI] [PMC free article] [PubMed] [Google Scholar]
- 75.Bernstein BE, et al. The NIH Roadmap Epigenomics Mapping Consortium. Nat Biotechnol 28, 1045–1048 (2010). [DOI] [PMC free article] [PubMed] [Google Scholar]
- 76.Ernst J & Kellis M ChromHMM: automating chromatin-state discovery and characterization. Nat Methods 9, 215–216 (2012). [DOI] [PMC free article] [PubMed] [Google Scholar]
- 77.Zhu Z, et al. Integration of summary data from GWAS and eQTL studies predicts complex trait gene targets. Nat Genet 48, 481–487 (2016). [DOI] [PubMed] [Google Scholar]
- 78.Tao W, Moore R, Smith ER & Xu XX Endocytosis and Physiology: Insights from Disabled-2 Deficient Mice. Front Cell Dev Biol 4, 129 (2016). [DOI] [PMC free article] [PubMed] [Google Scholar]
- 79.Moore R, Cai KQ, Tao W, Smith ER & Xu XX Differential requirement for Dab2 in the development of embryonic and extra-embryonic tissues. BMC Dev Biol 13, 39 (2013). [DOI] [PMC free article] [PubMed] [Google Scholar]
- 80.Uhlen M, et al. Proteomics. Tissue-based map of the human proteome. Science 347, 1260419 (2015). [DOI] [PubMed] [Google Scholar]
Associated Data
This section collects any data citations, data availability statements, or supplementary materials included in this article.