

Introduction
Head-and-neck cancer and its treatment inflict a substantial burden on patients, including a variety of acute and late toxicities (1,2). Five-year survival rates between 34% and 70% (3) compound patient distress. To minimize this burden, providers must try to ameliorate adverse events (AEs) that impact quality of life (QOL) during radiotherapy (RT) or concurrent chemoradiotherapy (CCRT) for head-and-neck cancer. Although research has shown QOL to be analogous to other vital signs (4), many aspects of QOL may not be evident to the clinical team as they focus their efforts on treating the patient’s disease. Physicians have begun to use patient-reported QOL (PROQOL) data in an effort to assess changes in QOL that might otherwise remain unaddressed. Using PROQOL data in the outpatient oncology setting improves physician-patient communication (4–6) and provides tangible benefits. For example, the use of PROQOL data can decrease the underestimation of depression and anxiety by physicians (7). Furthermore, for patients with head-and-neck cancer, PROQOL data correlates with locoregional control (8), disease-specific survival (9), and overall survival (9–12).
Prospective longitudinal studies of RT alone and CCRT for head-and-neck cancer have shown worsening PROQOL over the course of treatment (1,13). Although improvements have been made by employing intensity-modulated radiotherapy (IMRT), an advanced technology to conform radiation dose more closely to the specific area intended for treatment, substantial symptom burden persists (13–19). A wide range of symptoms, both physical and psychosocial, become progressively worse during the course of radiation with or without chemotherapy. Overall QOL, nausea, vomiting, pain, dysphagia, dysphonia, anorexia, and insomnia typically improve within 6 months after treatment, whereas physical functioning, cognitive functioning, xerostomia, fatigue, anosmia, dysgeusia, depression, and anxiety recover over a longer period (13,20). Overall symptom severity has been shown to be worse for CCRT than for RT alone, particularly for fatigue, drowsiness, anorexia, dysgeusia, and mucus production (1,21).
Real-time, electronic patient-reported outcomes (ePROs) collected via a web-based system have shown promise for clinical benefit in outpatient medical oncology practice (22). In outpatient radiation oncology practices, patients frequently interact with providers over the course of RT or CCRT, typically at weekly on-treatment visits (OTVs), which provide an opportunity to monitor AEs. Real-time ePROs are a novel means to systematically monitor and address the aforementioned symptom burden at OTVs and have the potential to be integrated into outpatient radiation oncology practice (23). However, the use of ePROs at several time points during head-and-neck RT has not been evaluated. Therefore, we aimed to characterize QOL, AEs, and supportive care interventions over the course of head-and-neck RT using ePROs.
Methods
Study Design
We analyzed the subset of primary head-and-neck cancer patients who were enrolled in a larger study (23) evaluating the clinical significance of ePROs during RT at a National Cancer Institute–designated comprehensive cancer center. Patients could not have evidence of distant metastasis, needed to have received at least 5 weeks of RT with or without chemotherapy, and had to be able to use a desktop computer to complete ePRO questionnaires in English. The study was approved by the Mayo Clinic Institutional Review Board. Informed consent was obtained from all individual participants included in the study.
Data Collection
QOL Measures
The linear analog self-assessment (LASA) was used to measure 12 health-related QOL domains (overall QOL, mental well-being [WB], physical WB, emotional WB, social activity, spiritual WB, pain frequency, pain severity, fatigue level, level of support, financial concerns, and legal concerns) (24–28). The 12 LASA single-item assessments ask patients to rate each specific QOL domain from 0 to 10 over the past week (0 being as bad as it can be, 10 being as good as it can be). Although scores on the 0 to 10 scale may clump around the middle and the quartiles (29), patients have been shown to score along the entire spectrum from 0 to 10 without ceiling or floor effects or restriction of range (28). The 12 single-item LASA domains assessed herein have been validated and standardized to give general measures of QOL for patients in numerous oncology settings (24–28).
All patients completed the LASA electronically in the radiation oncology examination room by using a web-based application—before starting RT, before biweekly OTVs (ie, weeks 1, 3, and 5), and at the last week of RT (Figure 1). As part of the larger study, providers were randomized to having the ePRO data available for review before OTVs. The clinicians could view the ePRO data in either tabular or bar-graph format on their office computer or with the patient in the examination room. Clinically meaningful changes were color-coded in the tabular format to capture the attention of the clinicians viewing the data (Figure 2). To assist clinical decision-making related to LASA outcomes, clinicians could view algorithms based on the National Comprehensive Cancer Network distress management guidelines via a hyperlink that was embedded in the table of results for each patient.
Figure 1.
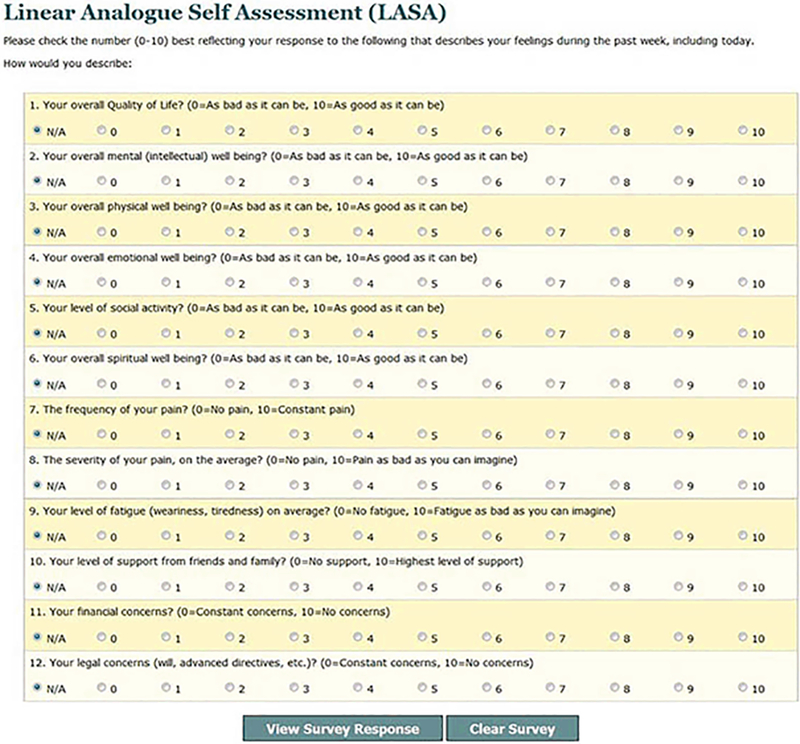
Electronic Collection of LASA Data. LASA indicates linear analog self-assessment.
Figure 2.
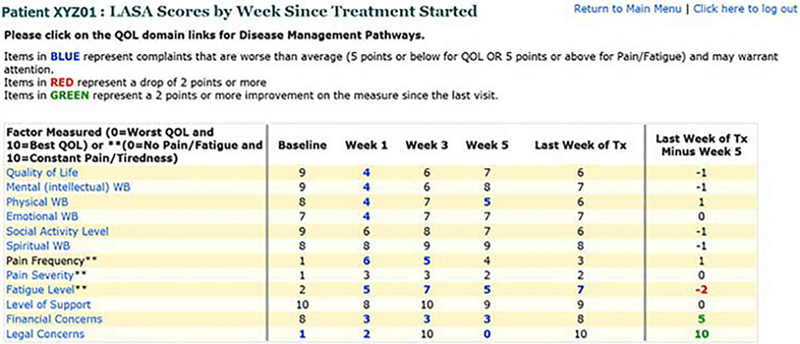
Data Display Provided to Clinicians. LASA indicates linear analog self-assessment; QOL, quality of life; WB, well-being.
Adverse Events
Toxicities and AEs, as detailed by providers in the institutional medical record, were collected for baseline, biweekly intervals (ie, weeks 1, 3, and 5), and the last week of RT. AEs were graded retrospectively by using the Common Terminology Criteria for Adverse Events (National Cancer Institute, version 4.0, May 28, 2009) (30).
Clinical Characteristics and Supportive Care Interventions
Institutional medical records were used to retrospectively review all patient charts and collect data on patient demographic characteristics, tumor characteristics (histologic diagnosis, TNM stage, primary tumor site), RT course, and chemotherapy. Patient weight was recorded before RT was started, before biweekly OTVs, and at the last week of RT. Events that occurred during RT, including intravenous (IV) hydration, transfusion, feeding-tube placement, an emergency department (ED) visit without hospitalization, and emergent hospitalization at our institution were noted.
Statistical Measures
Patient demographic characteristics, tumor characteristics, RT course, chemotherapy information, and patient weight were summarized and compared between cohorts by using Wilcoxon rank sum, χ2, or Fisher exact tests, as appropriate. All LASA item scores were transformed to a 0 to 100 point scale, with 100 being the best possible score. Area under the curve (AUC) summary statistics for each patient were calculated for each LASA item by using all available scores (31). The AUC was transformed to an average prorated AUC score, preserving the 0 to 100 range. Changes from baseline for each LASA item were also calculated at each time point. Prorated AUC scores, individual item scores at each time point, and all changes from baseline scores were compared between cohorts by using normality testing via the Shapiro-Wilk procedure followed by the Wilcoxon rank sum test for nonnormal distributions or the 2-sample t test for normal distributions (32,33). Comparison of the percentage of patients in each cohort who reported a clinically meaningful improvement or decrease (10 or more points on the 0 to 100 point scale) (34) was carried out by using χ2 tests (35). The Wilcoxon rank sum test was used to compare the AE grades between cohorts. All hypothesis testing was completed by using a 2-sided alternative hypothesis and a 5% type I error.
Results
Sixty-five patients met the inclusion criteria. The study population was primarily elderly (mean [range] age, 65.3 [32–89] years; SD, 12.6) white (92.3%), and male sex (80%). Patients who had CCRT (CCRT patients) were younger than patients who had RT alone (RT patients) (61.4 years, CCRT vs. 71.5 years, RT; P=.002). RT patients were more often treated in the adjuvant setting (80.0%, adjuvant RT vs 52.5%, adjuvant CCRT; P=.03). Table 1 displays patient characteristics of the CCRT cohort, the RT cohort, and the total population, including details of staging, the primary tumor site, histologic diagnosis, and type of systemic chemotherapy. Tumors were most commonly stage IV (59.9%) squamous cell carcinoma (78.5%).
Table 1.
Baseline Demographic and Clinical Characteristicsa
| Characteristic | CCRT (n=40) | RT Alone (n=25) | Total (N=65) | P Value |
|---|---|---|---|---|
| Age | 0.002b | |||
| Mean (SD) | 61.4 (11.2) | 71.5 (12.4) | 65.3 (12.6) | |
| Range | (32.0–83.0) | (43.0–89.0) | (32.0–89.0) | |
| Sex, No. (%) | 0.20c | |||
| Female | 6 (15.0) | 7 (28.0) | 13 (20.0) | |
| Male | 34 (85.0) | 18 (72.0) | 52 (80.0) | |
| Race (self-identified), No. (%) | >0.99d | |||
| American Indian/Alaska Native | 1 (2.5) | 0 (0.0) | 1 (1.5) | |
| Asian | 1 (2.5) | 0 (0.0) | 1 (1.5) | |
| Black | 1 (2.5) | 1 (4.0) | 2 (3.1) | |
| Pacific Islander | 1 (2.5) | 0 (0.0) | 1 (1.5) | |
| White | 36 (90.0) | 24 (96.0) | 60 (92.3) | |
| Radiotherapy, No. (%) | 0.03c | |||
| Adjuvant | 21 (52.5) | 20 (80.0) | 41 (63.1) | |
| Definitive | 19 (47.5) | 5 (20.0) | 24 (36.9) | |
| Dose of radiation | 0.05b | |||
| Median | 60.0 | 60.0 | 60.0 | |
| Range | (50.0–70.0) | (50.0–70.0) | (50.0–70.0) | |
| Staging, No. (%) | NA | |||
| Stage I | 0 (0.0) | 6 (24.0) | 6 (9.2) | |
| Stage II | 4 (10.0) | 5 (20.0) | 9 (13.8) | |
| Stage III | 7 (17.5) | 3 (12.0) | 10 (15.4) | |
| Stage IV | 29 (72.5) | 10 (40.0) | 39 (60.0) | |
| Recurrent | 5 (12.5) | 7 (28.0) | 12 (18.5) | |
| Primary Site, No. (%) | NA | |||
| Oral cavity/oropharynx | 23 (57.5) | 6 (24.0) | 29 (44.6) | |
| Larynx | 4 (10.0) | 4 (16.0) | 8 (12.3) | |
| Skin | 2 (5.0) | 6 (24.0) | 8 (12.3) | |
| Nasopharynx | 5 (12.5) | 0 (0.0) | 5 (7.7) | |
| Nasal cavity/paranasal sinus | 0 (0.0) | 4 (16.0) | 4 (6.2) | |
| Salivary | 1 (2.5) | 3 (12.0) | 4 (6.2) | |
| Other | 4 (10.0) | 3 (12.0) | 7 (10.8) | |
| Histologic diagnosis, No. (%) | NA | |||
| Squamous cell carcinoma | 36 (90.0) | 15 (60.0) | 51 (78.5) | |
| Spindle cell carcinoma | 0 (0.0) | 2 (8.0) | 2 (3.1) | |
| Papillary thyroid | 0 (0.0) | 2 (8.0) | 2 (3.1) | |
| Melanoma | 0 (0.0) | 2 (8.0) | 2 (3.1) | |
| Merkel cell | 2 (5.0) | 0 (0.0) | 2 (3.1) | |
| Adenocarcinoma | 1 (2.5) | 1 (4.0) | 2 (3.1) | |
| Other | 1 (2.5) | 3 (12.0) | 4 (6.2) | |
| Concurrent chemotherapy, No. (%) | NA | |||
| Cisplatin | 22 (55.0) | 0 (0.0) | 22 (33.8) | |
| Cetuximab | 7 (17.5) | 0 (0.0) | 7 (10.8) | |
| Carboplatin | 5 (12.5) | 0 (0.0) | 5 (7.7) | |
| Cisplatin after induction | 3 (7.5) | 0 (0.0) | 3 (4.6) | |
| Cetuximab after induction | 1 (2.5) | 0 (0.0) | 1 (1.5) | |
| Cetuximab, carboplatin, paclitaxel | 1 (2.5) | 0 (0.0) | 1 (1.5) | |
| Induction only | 1 (2.5) | 0 (0.0) | 1 (1.5) | |
| None | 0 (0.0) | 25 (100.0) | 25 (38.5) |
Abbreviations: CCRT, concurrent chemoradiotherapy; RT, radiotherapy.
Percentages do not add to 100 because of rounding.
Wilcoxon rank sum test.
χ2 text.
Fisher exact test.
Patient compliance with completing the ePROs averaged 93.8% (96.9% at baseline, 95.4% at week 1, 89.2% at week 3, and 93.8% at week 5). The patients completing 7 weeks of RT had a 94.4% compliance rate at week 7. At study completion, 94.7% of patients said they would participate in the study again.
Figure 3 shows the overall scores for each LASA item for the entire cohort over the course of treatment. During CCRT and RT alone, most patients had a clinically meaningful decrease (10 points from baseline on a 0–100 scale) in all QOL domains except for level of support, financial concerns, and legal concerns. The QOL domains for which patients most commonly experienced clinically meaningful decreases were fatigue (75.4% of patients; 95% CI, 62.9%−84.9%), social activity (70.8%; 95% CI, 58%−81.1%), and overall QOL (70.8%; 95% CI, 58.0%−81.1%). At the last week of CCRT or RT alone, the mean LASA score was worse than baseline in all QOL domains except level of support and financial concerns.
Figure 3.
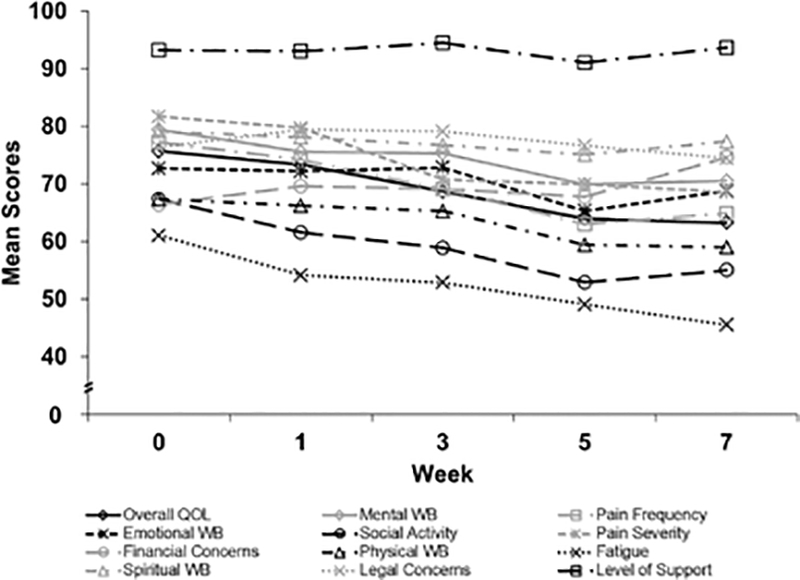
Overall LASA Scores (0 = Low QOL; 100 = High QOL). LASA indicates linear analog self-assessment; QOL, quality of life; WB, well-being.
Figure 4 presents all LASA items over the course of therapy for the CCRT and RT alone cohorts. The addition of systemic chemotherapy significantly impacted QOL domains. By week 3 of treatment, CCRT patients had a significantly worse change from baseline in pain frequency compared with RT patients (–15.1, CCRT vs +6.7, RT; P=.02) and in pain severity (–16.0, CCRT vs –0.5, RT; P=.04), with a nonsignificant tendency toward worse fatigue (–13.7, CCRT vs +3.3, RT; P=.09). By week 5, CCRT patients reported a significantly worse change from baseline in social activity than did RT patients (–21.9, CCRT vs –1.9, RT; P=.001). At the last week of treatment, the following 3 domains continued to have significantly worse changes from baseline for CCRT patients as compared with RT patients: social activity (–19.4, CCRT vs –0.9, RT; P=.006), pain frequency (–23.8, CCRT vs +1.7, RT; P=.009), and pain severity (–19.4, CCRT vs – 3.5, RT; P=.048). Over the course of treatment, CCRT (compared with RT) was associated with a statistically greater incidence of clinically meaningful, decreased overall QOL (80.0% [95% CI, 63.9%−90.4%] vs 56.0% [95% CI, 35.3%−75.0%], P=.02), decreased physical WB (80.0% [95% CI, 63.9%−90.4%] vs 48.0% [95% CI, 28.3%−68.3%], P=.004), and increased pain frequency (80.0% [95% CI, 63.9%−90.4%] vs 52.0% [95% CI, 31.8%−71.7%], P=.02).
Figure 4.
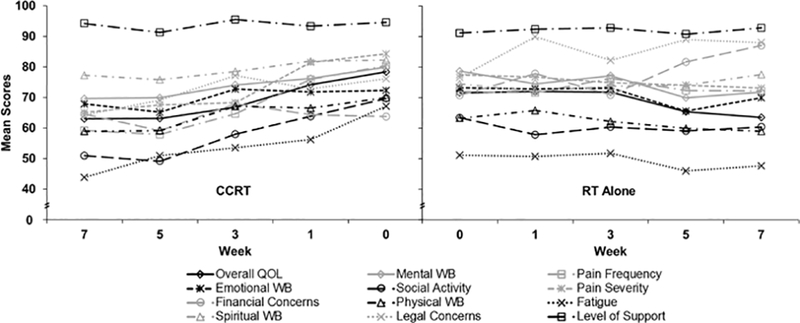
Butterfly Plot of LASA Scores by Treatment Status (0 = Low QOL; 100 = High QOL). CCRT indicates concurrent chemoradiotherapy; LASA, linear analog self-assessment; QOL, quality of life; RT, radiotherapy; WB, well-being.
Table 2 lists the maximum grade for each AE a patient experienced during the course of CCRT or RT alone and also summarizes the overall maximum AE grade each patient experienced. For brevity and relevance, Table 2 presents only AEs of grade 3 or grade 4 that occurred more than once or AEs of any grade that showed a statistically significant difference between CCRT and RT alone. Grade 3 AEs occurring once included dyspnea, pleuritic pain, and urinary tract infection among RT alone patients versus cardiomyopathy, delirium, port-a-cath infection, and soft-tissue infection among CCRT patients. All except 1 patient experienced dermatitis, with the majority of events being a grade 2. Grade 1 or 2 dysgeusia was diagnosed in 82.5% of CCRT patients vs 56.0% of RT patients (P=.09, not presented in Table 2). Mucositis occurred in 97.5% of CCRT patients vs 64.0% of RT patients (P<.001); nausea, 82.5% of CCRT patients vs 28.0% of RT patients (P<.001); odynophagia, 97.5% of CCRT patients vs 60.0% of RT patients (P<.001); and xerostomia, 80.0% of CCRT patients vs 48% of RT patients (P=.01). All patients experienced at least 1 grade 2 AE during treatment. Overall, 35.4% and 3.1% of patients experienced grade 3 and grade 4 AEs. One patient who had adjuvant CCRT had a grade 4 acneiform rash, and 1 patient who underwent definitive CCRT experienced grade 4 respiratory failure. As compared with RT patients, CCRT patients experienced significantly worse maximum-grade AEs (50.0%, grade 3 and 5%, grade 4) than RT patients (12.0%, grade 3 and 0, grade 4) (P=.002). Patients’ mean (range) weight loss was 5.5 kg (1.9–18.7) (SD, 4.4): 6.9 kg, CCRT and 2.8 kg, RT (P<.001). IV hydration was needed in 52.3% of patients: 77.5%, CCRT and 12.0%, RT (P<.001). Three CCRT patients required a transfusion of packed red blood cells (4.6% overall). At the discretion of the radiation oncologist, a feeding tube was placed in 40.0% of patients: 57.5%, CCRT and 12.0%, RT (P=.001). Of all patients, 10.8% had ED visits that did not require hospitalization. For the entire cohort, 37.5% of CCRT patients were admitted emergently to our hospital (5.0% hospitalized twice) versus 12.0% of RT patients (P=.04 for the difference between RT and CCRT hospitalization rates).
Table 2.
Summary of Maximum-Grade Adverse Events per Patient (Start to Completion of Radiotherapy)
| Adverse Event | CCRT (n=40) |
RT Alone (n=25) |
Wilcoxon P Value | ||
|---|---|---|---|---|---|
| Grade | No. (%) | Grade | No. (%) | ||
| Aspiration | 1 | 0 | 1 | 0 | .07 |
| 2 | 3 (7.5) | 2 | 0 | ||
| 3 | 2 (5.0) | 3 | 0 | ||
| 4 | 0 | 4 | 0 | ||
| Constipation | 1 | 14 (35.0) | 1 | 2 (8.0) | .005 |
| 2 | 4 (10.0) | 2 | 0 | ||
| 3 | 1 (2.5) | 3 | 1 (4.0) | ||
| 4 | 0 | 4 | 0 | ||
| Cough | 1 | 4 (10.0) | 1 | 3 (12.0) | .96 |
| 2 | 3 (7.5) | 2 | 2 (8.0) | ||
| 3 | 1 (2.5) | 3 | 0 | ||
| 4 | 0 | 4 | 0 | ||
| Dermatitis | 1 | 2 (5.0) | 1 | 2 (8.0) | .11 |
| 2 | 35 (87.5) | 2 | 22 (88.0) | ||
| 3 | 3 (7.5) | 3 | 0 | ||
| 4 | 0 | 4 | 0 | ||
| Diarrhea | 1 | 9 (22.5) | 1 | 4 (16.0) | .26 |
| 2 | 0 | 2 | 0 | ||
| 3 | 2 (5) | 3 | 0 | ||
| 4 | 0 | 4 | 0 | ||
| Dysphagia | 1 | 3 (7.5) | 1 | 1 (4.0) | .92 |
| 2 | 5 (12.5) | 2 | 5 (20.0) | ||
| 3 | 2 (5.0) | 3 | 0 | ||
| 4 | 0 | 4 | 0 | ||
| Lung infection | 1 | 0 | 1 | 0 | .07 |
| 2 | 1 (2.5) | 2 | 0 | ||
| 3 | 4 (10.0) | 3 | 0 | ||
| 4 | 0 | 4 | 0 | ||
| Mucositis | 1 | 9 (22.5) | 1 | 8 (32.0) | <.001 |
| 2 | 24 (60.0) | 2 | 8 (32.0) | ||
| 3 | 6 (15.0) | 3 | 0 | ||
| 4 | 0 | 4 | 0 | ||
| Nausea | 1 | 12 (30.0) | 1 | 4 (16.0) | <.001 |
| 2 | 13 (32.5) | 2 | 2 (8.0) | ||
| 3 | 8 (20.0) | 3 | 1 (4.0) | ||
| 4 | 0 | 4 | 0 | ||
| Odynophagia | 1 | 5 (12.5) | 1 | 6 (24.0) | <.001 |
| 2 | 29 (72.5) | 2 | 9 (36.0) | ||
| 3 | 5 (12.5) | 3 | 0 | ||
| 4 | 0 | 4 | 0 | ||
| Oral pain | 1 | 1 (2.5) | 1 | 6 (24.0) | .30 |
| 2 | 13 (32.5) | 2 | 3 (12.0) | ||
| 3 | 2 (5.0) | 3 | 0 | ||
| 4 | 0 | 4 | 0 | ||
| Rash acneiform | 1 | 3 (7.5) | 1 | 0 | .02 |
| 2 | 4 (10.0) | 2 | 0 | ||
| 3 | 0 | 3 | 0 | ||
| 4 | 1 (2.5) | 4 | 0 | ||
| Sinus crusting | 1 | 0 | 1 | 0 | .03 |
| 2 | 0 | 2 | 3 (12.0) | ||
| 3 | 0 | 3 | 0 | ||
| 4 | 0 | 4 | 0 | ||
| Somnolence | 1 | 0 | 1 | 0 | .27 |
| 2 | 1 (2.5) | 2 | 0 | ||
| 3 | 1 (2.5) | 3 | 0 | ||
| 4 | 0 | 4 | 0 | ||
| Thromboembolic event | 1 | 0 | 1 | 0 | .08 |
| 2 | 0 | 2 | 0 | ||
| 3 | 0 | 3 | 2 (8.0) | ||
| 4 | 0 | 4 | 0 | ||
| Xerostomia | 1 | 13 (32.5) | 1 | 6 (24.0) | .01 |
| 2 | 19 (47.5) | 2 | 6 (24.0) | ||
| 3 | 0 | 3 | 0 | ||
| 4 | 0 | 4 | 0 | ||
| Overall maximum grade | 1 | 0 | 1 | 0 | .002 |
| adverse event | 2 | 20 (50.0) | 2 | 22 (88.0) | |
| 3 | 18 (45.0) | 3 | 3 (12.0) | ||
| 4 | 2 (5.0) | 4 | 0 | ||
Abbreviations: CCRT, concurrent chemoradiotherapy; RT, radiotherapy.
Discussion
Over the course of head-and-neck cancer radiotherapy, we assessed a variety of PROQOL outcomes, recorded AEs, and found widespread, clinically meaningful decrements in fatigue, social activity, and overall QOL with frequent grade 3 AEs, weight loss, IV hydration, feeding tube placement, ED visits, and hospitalization, particularly among CCRT patients. Multiple previous studies have assessed PROQOL outcomes and AEs in head-and-neck cancer (1,13–16,36,37). However, the previous studies used paper-based assessments and did not include provider-reported AEs and supportive care interventions. In contrast, our study is unique in that we evaluated multiple time points during therapy with real-time, web-based ePROs and subsequently collected provider-reported AEs and objective measures, such as weight loss and the need for interventions (IV hydration, transfusion, feeding tube placement, ED visit, and hospitalization).
Collecting PROQOL data at multiple time points during therapy may create a concern regarding increased resource utilization. However, previous studies have shown the feasibility of incorporating PROQOL data into outpatient oncology practice without prolonging the clinical encounter or increasing the work burden of the care providers (4–6). In our institutional experience, collection of PROQOL data in a pilot setting only added an average of 2.9 additional minutes to the clinical encounter (M. Y. Halyard, MD, unpublished data, August 2016). Electronic web-based data collection is convenient and allows simultaneous data entry. By collecting data at multiple time points during therapy, providers can track outcomes over time and respond to issues in real-time (38). In our institution, one of the medical oncology departments assesses the LASA overall QOL and fatigue domains for every patient at every clinic visit. As a result, patient concerns that would otherwise be unrecognized have been identified in 25% to 40% of visits (4). Snyder et al (22) also reported using real-time ePROs in outpatient medical oncology. Our study adds to the existing literature by demonstrating the feasibility of real-time ePRO collection at multiple time points in a head-and-neck radiation oncology practice. Our data also provide a picture of how patient-reported outcomes and provider-documented toxicities progress over the course of head-and-neck cancer therapy and document the supportive care interventions patients may need. This knowledge may allow patients and providers to anticipate and proactively address problems before they arise, and in the end, may even improve resource utilization.
The characteristics of our cohort matched those of the predominant patient population in the literature for head-and-neck cancer: men with advanced squamous cell carcinoma of the oral cavity or oropharynx (Tables 1 and 2). However, the mean age of our cohort was 5 to 10 years older than that of previously studied groups (1,13,36,39). This difference may reflect the characteristics of the patient population at our institution. In our cohort, CCRT patients were younger than RT patients. This could be due to providers being more apt to offer chemotherapy to younger patients who may be fitter and have fewer comorbidities. Radiotherapy alone followed surgery in an adjuvant manner more often than CCRT, and the median RT regimen delivered 60 Gy in 30 fractions, reflective of the standard-of-care postoperative regimen (40,41). The patients included in this report were treated with IMRT based on multiple randomized controlled trials that showed improved PROQOL and less toxicity with IMRT versus other radiotherapeutic modalities such as 3-dimensional conformal radiotherapy (13–16).
Our overall cohort’s PROQOL data reflects the well-known, profound effects of head-and-neck cancer treatment on QOL (1,13–16,36,37). By the end of their radiotherapy, our patients’ average QOL was diminished across nearly all domains, but especially for fatigue, social activity, and overall QOL (Figure 3). Level of support and financial concerns were the only domains that were not worse than baseline by the end of therapy. This may be accounted for by the patient population at our institution, which typically has a high level of social support.
The ePROs showed that the CCRT patients experienced greater impact on QOL than the RT alone patients. The mean baseline QOL was better for CCRT patients in all LASA items except emotional WB and financial and legal concerns (Figure 4). Despite these better baseline QOL scores, at the last week of treatment, the CCRT patients reported worse average scores than RT patients for all LASA items except physical WB. Data on the change from baseline for individual LASA items provides insight into this role reversal. Three weeks into CCRT, patients began to report decrements in pain frequency, pain severity, and fatigue that eclipsed their RT counterparts. Week 5 brought diminished social activity from baseline for CCRT patients as compared with those who underwent RT alone. Changes from baseline that were statistically worse for CCRT than RT patients persisted into the last week of treatment for social activity, pain frequency, and pain severity. The CCRT patients also had more clinically meaningful worsening of overall QOL, physical WB, and pain frequency over the course of treatment. These findings reinforce those of other studies that reported increased symptom burden of CCRT as compared with RT alone (1,2,21). However, given the differences between the CCRT and RT alone groups in age, definitive versus adjuvant treatment, and radiation dose (Table 1), our findings must be weighed against these potential confounders.
Of particular interest, patients who underwent RT had significantly more fatigue at baseline (Figure 4). We hypothesize that this baseline difference between RT and CCRT can be attributed in part to the greater number of RT alone patients who had surgery before beginning their RT. Another possible contributory factor is that patients who received RT alone were also significantly older than patients who received CCRT (Table 1). This finding should be investigated further, because baseline fatigue level has been shown to predict overall survival among advanced head-and-neck cancer patients treated with RT (10).
In concert with the ePRO data, the provider-reported AEs again reflect the intense impact of head-and-neck cancer treatment on patients (Table 2). Grade 2 toxicities are ubiquitous. The patients who underwent CCRT experienced more grade 3 toxicities than RT patients and had 2 grade 4 toxicities (Table 2). Although a prior randomized phase III study of advanced head-and-neck cancer found no significant differences in PROQOL between RT alone and RT with cetuximab (37), 8 patients who underwent CCRT in our study experienced the acneiform rash classic for cetuximab, 1 of which was a grade 4. This serves as a reminder that although previous studies may show no statistical difference between 2 treatment regimens, providers must nonetheless be prepared for the side effects possible with each regimen. A previous retrospective study of hypopharyngeal cancer found increased dry mouth and problems with swallowing among CCRT patients (36), findings that were reinforced by our data showing that CCRT was associated with increased xerostomia and odynophagia (Table 2). We also describe statistically higher-grade mucositis and nausea among patients who underwent CCRT compared with RT alone (Table 2). The only occurrences of pleuritic pain (2 patients), sinus crusting (3 patients), and thromboembolic events (2 patients) were among the RT alone cohort. It is certainly possible that these AEs can be attributed to the surgical procedures performed before the start of RT.
As previously reported (36), we found that CCRT was associated with increased weight loss. In addition, a significant proportion of patients, especially those undergoing CCRT, required IV hydration and feeding tube placement. Higher-grade dry mouth, problems swallowing, dysgeusia, mucositis, and nausea could account for the greater weight loss and the need for IV hydration and feeding tubes among CCRT patients. These issues may also play a role in the difference in hospitalization rates between CCRT and RT alone. Understanding this potential for weight loss, IV hydration, feeding tubes, and hospitalization for patients during therapy is important for both patients and clinicians in decision-making and in working to prevent AEs.
Our study has several limitations. Because of its size (N=65), the head-and-neck subpopulation used for our study has limited power. Our assessment of differences between CCRT and RT alone is also an unplanned subgroup analysis. Therefore, the CCRT and RT alone groups were unbalanced, introducing potential confounders. Furthermore, we retrospectively collected and graded AEs by using our institution’s medical records. The AE data extraction was not double-coded, and a variety of providers contributed to the medical record, both of which potentially introduce ascertainment bias. Prior work has shown that AE reporting by cancer clinicians shows only moderate agreement between different clinicians (42). Moreover, physician- versus patient-reported AEs have shown only slight agreement (43). This emphasizes the need for patient-reported outcomes (PROs) in addition to clinician assessments to improve the ability to detect and subsequently address problems. Future studies that correlate PROs and AEs in head-and-neck RT will help to clarify the role PROs can play in addressing patient concerns and mitigating AEs.
To our knowledge, our study is the first reported use of real-time ePROs at multiple time points during the course of RT for patients with head-and-neck cancer. Real-time electronic collection of PROQOL data is feasible in RT for head-and-neck cancer and reveals QOL deficits that merit attention by providers. Given the significant impact of head-and-neck CCRT and RT on QOL, continued investigation for optimal incorporation of ePRO collection into the clinical practice should be a priority.
Acknowledgments
Funding: None.
Abbreviations
- AE
adverse event
- AUC
area under the curve
- CCRT
concurrent chemoradiotherapy ED, emergency department
- ePRO
electronic patient-reported outcome
- IMRT
intensity-modulated radiotherapy
- IV
intravenous
- LASA
linear analog self-assessment
- OTV
on-treatment visit
- PROs
patient-reported outcomes
- PROQOL
patient-reported quality of life
- QOL
quality of life
- RT
radiotherapy
- WB
well-being
Footnotes
Conflict of Interest: The authors declare that they have no conflict of interest.
Compliance With Ethical Standards
Ethical approval: All procedures performed in studies involving human participants were in accordance with the ethical standards of the institutional and/or national research committee and with the 1964 Helsinki declaration and its later amendments or comparable ethical standards.
Informed consent: Informed consent was obtained from all individual participants included in the study.
Publisher: To expedite proof approval, send proof via email to scipubs@mayo.edu.
Contributor Information
Joshua R. Niska, Department of Radiation Oncology Mayo Clinic Hospital, Phoenix, Arizona.
Michele Y. Halyard, Department of Radiation Oncology Mayo Clinic Hospital, Phoenix, Arizona.
Angelina D. Tan, Division of Biomedical Statistics and Informatics Mayo Clinic, Rochester, Minnesota
Pamela J. Atherton, Division of Biomedical Statistics and Informatics Mayo Clinic, Rochester, Minnesota
Samir H. Patel, Department of Radiation Oncology Mayo Clinic Hospital, Phoenix, Arizona.
Jeff A. Sloan, Division of Biomedical Statistics and Informatics Mayo Clinic, Rochester, Minnesota..
References
- 1.Rosenthal DI, Mendoza TR, Fuller CD, Hutcheson KA, Wang XS, Hanna EY, et al. Patterns of symptom burden during radiotherapy or concurrent chemoradiotherapy for head and neck cancer: a prospective analysis using the University of Texas MD Anderson Cancer Center Symptom Inventory-Head and Neck Module. Cancer. 2014. July 1;120(13):1975–84. Epub 2014 Apr 7. [DOI] [PMC free article] [PubMed] [Google Scholar]
- 2.Trotti A, Pajak TF, Gwede CK, Paulus R, Cooper J, Forastiere A, et al. TAME: development of a new method for summarising adverse events of cancer treatment by the Radiation Therapy Oncology Group. Lancet Oncol. 2007. July;8(7):613–24. [DOI] [PubMed] [Google Scholar]
- 3.Pulte D, Brenner H. Changes in survival in head and neck cancers in the late 20th and early 21st century: a period analysis. Oncologist. 2010;15(9):994–1001. Epub 2010 Aug 26. [DOI] [PMC free article] [PubMed] [Google Scholar]
- 4.Hubbard JM, Grothey AF, McWilliams RR, Buckner JC, Sloan JA. Physician perspective on incorporation of oncology patient quality-of-life, fatigue, and pain assessment into clinical practice. J Oncol Pract. 2014. July;10(4):248–53. Epub 2014 Mar 25. [DOI] [PMC free article] [PubMed] [Google Scholar]
- 5.Detmar SB, Aaronson NK. Quality of life assessment in daily clinical oncology practice: a feasibility study. Eur J Cancer. 1998. July;34(8):1181–6. [DOI] [PubMed] [Google Scholar]
- 6.Velikova G, Booth L, Smith AB, Brown PM, Lynch P, Brown JM, et al. Measuring quality of life in routine oncology practice improves communication and patient well-being: a randomized controlled trial. J Clin Oncol. 2004. February 15;22(4):714–24. [DOI] [PubMed] [Google Scholar]
- 7.Passik SD, Dugan W, McDonald MV, Rosenfeld B, Theobald DE, Edgerton S. Oncologists’ recognition of depression in their patients with cancer. J Clin Oncol. 1998. April;16(4):1594–600. [DOI] [PubMed] [Google Scholar]
- 8.Siddiqui F, Pajak TF, Watkins-Bruner D, Konski AA, Coyne JC, Gwede CK, et al. Pretreatment quality of life predicts for locoregional control in head and neck cancer patients: a radiation therapy oncology group analysis. Int J Radiat Oncol Biol Phys. 2008. February 1;70(2):353–60. Epub 2007 Sep 24. [DOI] [PubMed] [Google Scholar]
- 9.Grignon LM, Jameson MJ, Karnell LH, Christensen AJ, Funk GF. General health measures and long-term survival in patients with head and neck cancer. Arch Otolaryngol Head Neck Surg. 2007. May;133(5):471–6. [DOI] [PubMed] [Google Scholar]
- 10.Fang FM, Liu YT, Tang Y, Wang CJ, Ko SF. Quality of life as a survival predictor for patients with advanced head and neck carcinoma treated with radiotherapy. Cancer. 2004. January 15;100(2):425–32. [DOI] [PubMed] [Google Scholar]
- 11.Meyer F, Fortin A, Gelinas M, Nabid A, Brochet F, Tetu B, et al. Health-related quality of life as a survival predictor for patients with localized head and neck cancer treated with radiation therapy. J Clin Oncol. 2009. June 20;27(18):2970–6. Epub 2009 May 18. [DOI] [PubMed] [Google Scholar]
- 12.Yang CJ, Roh JL, Kim MJ, Lee SW, Kim SB, Choi SH, et al. Pretreatment quality of life as a prognostic factor for early survival and functional outcomes in patients with head and neck cancer. Qual Life Res. 2016. January;25(1):165–74. Epub 2015 Jul 9. [DOI] [PubMed] [Google Scholar]
- 13.Rathod S, Gupta T, Ghosh-Laskar S, Murthy V, Budrukkar A, Agarwal J. Quality-of-life (QOL) outcomes in patients with head and neck squamous cell carcinoma (HNSCC) treated with intensity-modulated radiation therapy (IMRT) compared to three-dimensional conformal radiotherapy (3D-CRT): evidence from a prospective randomized study. Oral Oncol 2013. June;49(6):634–42. Epub 2013 Apr 4. [DOI] [PubMed] [Google Scholar]
- 14.Pow EH, Kwong DL, McMillan AS, Wong MC, Sham JS, Leung LH, et al. Xerostomia and quality of life after intensity-modulated radiotherapy vs. conventional radiotherapy for early-stage nasopharyngeal carcinoma: initial report on a randomized controlled clinical trial. Int J Radiat Oncol Biol Phys. 2006. November 15;66(4):981–91. [DOI] [PubMed] [Google Scholar]
- 15.Kam MK, Leung SF, Zee B, Chau RM, Suen JJ, Mo F, et al. Prospective randomized study of intensity-modulated radiotherapy on salivary gland function in early-stage nasopharyngeal carcinoma patients. J Clin Oncol. 2007. November 1;25(31):4873–9. [DOI] [PubMed] [Google Scholar]
- 16.Nutting CM, Morden JP, Harrington KJ, Urbano TG, Bhide SA, Clark C, et al. ; PARSPORT trial management group. Parotid-sparing intensity modulated versus conventional radiotherapy in head and neck cancer (PARSPORT): a phase 3 multicentre randomised controlled trial. Lancet Oncol. 2011. February;12(2):127–36. Epub 2011 Jan 12. [DOI] [PMC free article] [PubMed] [Google Scholar]
- 17.Wan Leung S, Lee TF, Chien CY, Chao PJ, Tsai WL, Fang FM. Health-related quality of life in 640 head and neck cancer survivors after radiotherapy using EORTC QLQ-C30 and QLQ-H&N35 questionnaires. BMC Cancer. 2011. April 12;11:128. [DOI] [PMC free article] [PubMed] [Google Scholar]
- 18.Fang FM, Chien CY, Tsai WL, Chen HC, Hsu HC, Lui CC, et al. Quality of life and survival outcome for patients with nasopharyngeal carcinoma receiving three-dimensional conformal radiotherapy vs. intensity-modulated radiotherapy: a longitudinal study. Int J Radiat Oncol Biol Phys. 2008. October 1;72(2):356–64. Epub 2008 Mar 20. [DOI] [PubMed] [Google Scholar]
- 19.Vergeer MR, Doornaert PA, Rietveld DH, Leemans CR, Slotman BJ, Langendijk JA. Intensity-modulated radiotherapy reduces radiation-induced morbidity and improves health-related quality of life: results of a nonrandomized prospective study using a standardized follow-up program. Int J Radiat Oncol Biol Phys. 2009. May 1;74(1):1–8. Epub 2008 Dec 26. [DOI] [PubMed] [Google Scholar]
- 20.Neilson K, Pollard A, Boonzaier A, Corry J, Castle D, Smith D, et al. A longitudinal study of distress (depression and anxiety) up to 18 months after radiotherapy for head and neck cancer. Psychooncology. 2013. August;22(8):1843–8. Epub 2012 Dec 13. [DOI] [PubMed] [Google Scholar]
- 21.Murphy BA, Gilbert J, Cmelak A, Ridner SH. Symptom control issues and supportive care of patients with head and neck cancers. Clin Adv Hematol Oncol. 2007. October;5(10):807–22. [PubMed] [Google Scholar]
- 22.Snyder CF, Blackford AL, Wolff AC, Carducci MA, Herman JM, Wu AW; PatientViewpoint Scientific Advisory Board. Feasibility and value of PatientViewpoint: a web system for patient-reported outcomes assessment in clinical practice. Psychooncology. 2013. April;22(4):895–901. Epub 2012 Apr 30. [DOI] [PMC free article] [PubMed] [Google Scholar]
- 23.Halyard MY, Tan A, Callister MD, Ashman JB, Vora SA, Wong W, et al. Assessing the clinical significance of real-time quality of life (QOL) data in cancer patients treated with radiation therapy. J Clin Oncol, 2010;28:15s (suppl; abstr 9107). [Google Scholar]
- 24.Grunberg SM, Groshen S, Steingass S, Zaretsky S, Meyerowitz B. Comparison of conditional quality of life terminology and visual analogue scale measurements. Qual Life Res. 1996. February;5(1):65–72. [DOI] [PubMed] [Google Scholar]
- 25.Gudex C, Dolan P, Kind P, Williams A. Health state valuations from the general public using the visual analogue scale. Qual Life Res. 1996. December;5(6):521–31. [DOI] [PubMed] [Google Scholar]
- 26.Hyland ME, Sodergren SC. Development of a new type of global quality of life scale, and comparison of performance and preference for 12 global scales. Qual Life Res. 1996. October;5(5):469–80. [DOI] [PubMed] [Google Scholar]
- 27.Bretscher M, Rummans T, Sloan J, Kaur J, Bartlett A, Borkenhagen L, et al. Quality of life in hospice patients: a pilot study. Psychosomatics. 1999. Jul-Aug;40(4):309–13. [DOI] [PubMed] [Google Scholar]
- 28.Locke DE, Decker PA, Sloan JA, Brown PD, Malec JF, Clark MM, et al. Validation of single-item linear analog scale assessment of quality of life in neuro-oncology patients. J Pain Symptom Manage. 2007. December;34(6):628–38. [DOI] [PMC free article] [PubMed] [Google Scholar]
- 29.Norman GR, Sloan JA, Wyrwich KW. The truly remarkable universality of half a standard deviation: confirmation through another look. Expert Rev Pharmacoecon Outcomes Res. 2004. October;4(5):581–5. [DOI] [PubMed] [Google Scholar]
- 30.US Department of Health and Human Services, National Institutes of Health, National Cancer Institute [Internet]. Common terminology criteria for adverse events (CTCAE). Version 4.0; 2009. May 28 [updated 2010 Jun 14; cited 2014 Sep 17]. Available from: http://www.hrc.govt.nz/sites/default/files/CTCAE%20manual%20-%20DMCC.pdf.
- 31.Fairclough DL. Summary measures and statistics for comparison of quality of life in a clinical trial of cancer therapy. Stat Med. 1997. June 15;16(11):1197–209. [DOI] [PubMed] [Google Scholar]
- 32.Farrell PJ, Salibian-Barrera M, Naczk K. On tests for multivariate normality and associated simulation studies. J Statistic Comput Simulation. 2007. January 1;77(12):1065–80. [Google Scholar]
- 33.Blair RC, Higgins JJ . A comparison of the power of Wilcoxon’s rank-sum statistic to that of student’s t statistic under various nonnormal distributions. J Educ Statistic. 1980. winter;5(4):309–35. [Google Scholar]
- 34.Sloan J Asking the obvious questions regarding patient burden. J Clin Oncol. 2002. January 1;20(1):4–6. [DOI] [PubMed] [Google Scholar]
- 35.Sloan JA, Zhao X, Novotny PJ, Wampfler J, Garces Y, Clark MM, et al. Relationship between deficits in overall quality of life and non-small-cell lung cancer survival. J Clin Oncol. 2012. May 1;30(13):1498–504. Epub 2012 Mar 26. [DOI] [PMC free article] [PubMed] [Google Scholar]
- 36.Lee TL, Wang LW, Mu-Hsin Chang P, Chu PY. Quality of life for patients with hypopharyngeal cancer after different therapeutic modalities. Head Neck. 2013. February;35(2):280–5. Epub 2012 Feb 24. [DOI] [PubMed] [Google Scholar]
- 37.Curran D, Giralt J, Harari PM, Ang KK, Cohen RB, Kies MS, et al. Quality of life in head and neck cancer patients after treatment with high-dose radiotherapy alone or in combination with cetuximab. J Clin Oncol. 2007. June 1;25(16):2191–7. Erratum in: J Clin Oncol. 2007 Aug 20;25(24):3790. [DOI] [PubMed] [Google Scholar]
- 38.Aaronson N, Elliott T, Greenhalgh J, Halyard M, Hess R, Miller D, et al. User’s guide to implementing patient-reported outcomes assessment in clinical practice [Internet], Version 2: 2015. January [cited 2015 Sep 14]. Available from: http://www.isoqol.org/UserFiles/2015UsersGuide-Version2.pdf. [DOI] [PubMed]
- 39.Karnell LH, Funk GF, Christensen AJ, Rosenthal EL, Magnuson JS. Persistent posttreatment depressive symptoms in patients with head and neck cancer. Head Neck. 2006. May;28(5):453–61. [DOI] [PubMed] [Google Scholar]
- 40.Adjuvant chemotherapy for advanced head and neck squamous carcinoma: final report of the Head and Neck Contracts Program. Cancer. 1987. August 1;60(3):301–11. [DOI] [PubMed] [Google Scholar]
- 41.Laramore GE, Scott CB, al-Sarraf M, Haselow RE, Ervin TJ, Wheeler R, et al. Adjuvant chemotherapy for resectable squamous cell carcinomas of the head and neck: report on Intergroup Study 0034. Int J Radiat Oncol Biol Phys. 1992;23(4):705–13. [DOI] [PubMed] [Google Scholar]
- 42.Atkinson TM, Li Y, Coffey CW, Sit L, Shaw M, Lavene D, et al. Reliability of adverse symptom event reporting by clinicians. Qual Life Res. 2012. September;21(7):1159–64. [DOI] [PMC free article] [PubMed] [Google Scholar]
- 43.Fromme EK, Eilers KM, Mori M, Hsieh YC, Beer TM. How accurate is clinician reporting of chemotherapy adverse effects? A comparison with patient-reported symptoms from the Quality-of-Life Questionnaire C30. J Clin Oncol. 2004. September 1;22(17):3485–90. [DOI] [PubMed] [Google Scholar]