

Abstract
Non-heme iron homeostasis interacts with inflammation bidirectionally, and both contribute to age-related decline in brain structure and function via oxidative stress. Thus, individuals with genetic predisposition for inflammation may be at greater risk for brain iron accumulation during aging and more vulnerable to cognitive decline. We examine this hypothesis in a lifespan sample of healthy adults (N = 183, age 20-94 years) who underwent R2*-weighted magnetic resonance imaging to estimate regional iron content and genotyping of interleukin-1beta (I L-1β), a pro-inflammatory cytokine for which the T allelle of the single nucleotide polymorphism increases risk for chronic neuroinflammation. Older age was associated with greater striatal iron content that in turn accounted for poorer cognitive switching performance. Heterozygote IL-1β T-carriers demonstrated poorer switching performance in relation to striatal iron content as compared to IL-1β C/C counterparts, despite the two groups being of similar age. With increasing genetic inflammation risk, homozygote IL-1β T/T carriers had lesser age-related variance in striatal iron content as compared to the other groups but showed a similar association of greater striatal iron content predicting poorer cognitive switching. Non-heme iron and inflammation, although necessary for normal neuronal function, both promote oxidative stress that when accumulated in excess, drives a complex mechanism of neural and cognitive decline in aging.
Keywords: aging, iron, inflammation, structural equation modeling, task switching, R2* imaging
1.0. Introduction
Age-related changes in the human brain are cumulative and progressive across the lifespan and individuals differ in the pace and magnitude of change (Kirkwood et al., 2005; Raz et al., 2010). Typical aging is characterized by cortical thinning, regional brain shrinkage, loss of myelin, cognitive decline and general increase in frailty (Kennedy and Raz, 2015; Raz and Daugherty, 2018; Rockwood et al., 2004). Putative mechanisms of neural and ostensibly cognitive decline include disruption of mitochondrial function and fundamental energetic failure (Boumezbeur et al., 2010), oxidative stress (Dröge and Schipper, 2007), and chronic inflammation (Finch and Morgan, 2007; Franceschi and Campisi, 2014). These mechanisms of decline share a common antecedent in the accumulation and action of non-heme iron.
Non-heme iron is stored in cells to support fundamental metabolic action (Mills et al., 2010). Unlike heme iron that is present in hemoglobin wherever blood flows or accumulates, non-heme iron is strictly regulated within the cell by a host of transport proteins, chemical chaperones and ferritin molecules (Mills et al., 2010; Moos and Morgan, 2004). Mitochondria orchestrate cellular iron homeostasis and signal release of ferritin-bound stores as needed for metabolic function (Mills et al., 2010). Non-heme iron is necessary for adenosine triphosphate (ATP) production and DNA replication, as well as neurotransmission and myelinating processes within the brain (Mills et al., 2010; Todorich et al., 2009; Ward et al., 2014; Zecca et al., 2004). As a normal by-product of these metabolic functions, free-radicals are produced and are typically resolved by endogenous anti-oxidants (Ward et al., 2014).
In the course of aging, however, non-heme iron accumulates outside of binding complexes and produces excessive concentrations of free-radicals, which constitutes oxidative stress (Mills et al., 2010; Ward et al., 2014; Zecca et al., 2004). Oxidative stress, in turn, disrupts mitochondrial function, promotes inflammation, and accelerates apoptosis (Mills et al., 2010; Ward et al., 2014; Zecca et al., 2004). Dysfunctional mitochondria fail to correct iron homeostasis, increasing iron concentrations outside of binding complexes, and drives the cell to its catastrophic end (Mills et al., 2010; Ward et al., 2014; Zecca et al., 2004). The free-radical induced energetic decline in senescence (FRIENDS) model proposes that iron-related oxidative stress initiates a complex cascade of metabolic events that produces declines in brain structure and function typical of aging (Raz and Daugherty, 2018; also see Harman, 1956).
In line with observations of differential aging, iron concentrations vary across brain regions and age-related differences vary therein. The basal ganglia regions, red nucleus, substantia nigra, and thalamus have the largest concentrations of iron beginning in early childhood, and lesser iron content is observed in cortical gray matter and deep white matter (Brass et al., 2006; Daugherty and Raz, 2015; Hallgren and Sourander, 1958; Thomas et al., 1993). Older age positively correlates with greater regional brain iron content (Daugherty and Raz, 2015; Rodrigue et al., 2011; Thomas et al., 1993). A meta-analysis of multiple neuroimaging techniques, including R2* relaxometry, demonstrated that age differences in the caudate nucleus and putamen are larger than that in the globus pallidus, red nucleus and substantia nigra (Daugherty and Raz, 2013). Neuroimaging study estimates of iron content largely agree with histological reports of iron concentration from brains sampled across the lifespan (Daugherty and Raz, 2015; Haacke et al., 2005; Hallgren and Sourander, 1958; Thomas et al., 1993).
Greater iron content has been previously associated with smaller regional volumes and deficits in cognitive ability in the course of aging (Daugherty and Raz, 2015). For example, greater hippocampal iron is associated with smaller volumes, and both factors conjointly explain age-related deficits in episodic memory function (Rodrigue et al., 2013). Iron accumulation in the striatum (caudate nucleus and putamen) precedes and predicts regional shrinkage of these nuclei over 2 years (Daugherty et al., 2015) and up to 7 years (Daugherty and Raz, 2016). Striatal iron accumulation partially explains declines in working memory performance (Daugherty et al., 2015) and complex tasks that rely upon executive functions, such as spatial navigation (Daugherty and Raz, 2017). Thus, striatal iron content appears to increase preferentially in the course of typical aging and it predicts hallmark declines in regional volumetry and executive functions.
Importantly, the accumulation of iron and its action is reciprocally dependent upon inflammation. Iron-related oxidative stress triggers the inflammation cascade, which further compromises mitochondrial function and accelerates apoptosis (Williams et al., 2012). Expression of pro-inflammatory cytokines in human pulmonary cells is directly proportional to the concentration of iron outside of ferritin storage (O’Brien-Ladner et al., 2000). In reciprocate action, pro-inflammatory cytokines, in particular interleukin-1beta (IL-1β), modifies the expression and efficacy of iron-binding proteins. Exposing human pulmonary cells to IL-1β directly decreases transferrin-receptor expression and increases ferritin production (Smirnov et al., 1999), which are the primary homeostatic controls of unbound iron. Expression of IL-1β in human astrocytoma cells increases concentrations of unbound iron (Piñero et al., 2000) that, if unregulated, will lead to an increase in oxidative stress.
Under healthy conditions, the bidirectional relationship between non-heme iron concentration and IL-1β expression is expected to adaptively regulate the cell. However, in the course of aging, this system is hypothesized to shift towards accumulation of unbound iron, excessive oxidative stress, and chronic inflammation (Finch and Morgan, 2007; Franceschi and Campisi, 2014; Raz and Daugherty, 2018). Elevated IL-1β is associated with neurodegeneration (Di Bona et al., 2008; Kauffman et al., 2008) and it is implicated in the development of Alzheimer’s disease (Blasko et al., 2004). Circulating levels of IL-1β are regulated by the eponymous gene and the T allele of IL-1β C-511T single nucleotide polymorphism (SNP) predisposes the individual for increased expression of the pro-inflammatory cytokine (Hurme and Santtila, 1998). In typical aging, homozygote T carriers have larger white matter hyperintensity volumes (Raz et al., 2012), smaller hippocampal subfield volumes (Raz et al., 2015) and accelerated shrinkage of the parahippocampal gyrus (Persson et al., 2014) as compared to homozygote IL-1β C counterparts. Thus, it is plausible that individuals who are genetically predisposed for greater expression of IL-1β may be susceptible to greater iron accumulation. Several genetic markers for iron homeostasis have been identified and are speculated to play a role in neural cognitive declines (Andrews, 2000; Jahanshad et al., 2013; Lehmann et al., 2006), to our knowledge there has been no study of the effects of inflammation risk on regional iron content in the aging brain.
Iron homeostasis and pro-inflammatory cytokine expression is expected to exacerbate cognitive deficits through their mutual action on neurotransmission and synaptic plasticity, in addition to atrophy. For example, in rat hippocampi, IL-1β is released for the duration of longterm potentiation (LTP) of synaptic transmission (Schneider et al., 1998), a process considered to underlie learning and memory functions that is vulnerable to aging (Barnes, 2003). Free radicals play a paradoxical role in LTP—they are necessary for signal transduction but when accumulated in excess, oxidative stress impairs synaptic plasticity (Serrano and Klann, 2004). Neurotransmitter production and receptor expression, such as dopamine, are dependent upon non-heme iron (Youdim and Yehuda, 2000) and are vulnerable to oxidative stress and inflammation (Meiser et al., 2013). Exposing substantia nigra neurons to iron increases IL-1β expression by microglia (Wang et al., 2013) and treatment of iron-infused substantia nigra neurons with a drug that reduces blood glucose increases activated microglia and IL-1β mRNA expression, decreases iron-related peroxidation, and decreases depletion of dopamine (Yu et al., 2010). Indeed, treatment with an iron chelator in rodents reduced neuroinflammation, oxidative stress, and apoptosis, and improved memory function (Zhang et al., 2015). The combined preliminary evidence from animal models and in vitro study suggests that not only the isolated action of inflammation and iron accumulation, but their synergism, may exacerbate cognitive aging.
Therefore, the goals of the current study were to evaluate differences in striatal iron content by IL-1β genetic risk group in a lifespan sample of healthy adults (ages 20-94 years) and its impact on the relationship between iron content and task switching performance, a striatal-based cognitive ability. Human IL-1β does not pass the blood brain barrier (Banks, 2005; Banks et al., 1995) and thus peripheral measures are inaccurate estimates of its concentration in the brain. However, taking advantage of Mendelian randomization (Lawlor et al., 2008), carriage of the IL-1β T allele is associated with increased pro-inflammatory expression (Hurme and Santtila, 1998), including, presumably, in the brain. The striatum is ideal to test for the relationship of iron and IL-1β genetic risk because it is vulnerable to inflammation (e.g., Petrulli et al., 2017) and these regions demonstrate the greatest age-related differences in iron content (Daugherty and Raz, 2013). Moreover, the striatum support executive functions, including cognitive switching ability (Leh et al., 2010) that is sensitive to decline in aging (Wasylyshyn et al., 2011). Therefore, age-related differences in iron content were tested in relation to deficits in cognitive switching ability in a grouped structural equation model. We hypothesized that 1) individuals predisposed for greater inflammation (carriers of the IL-1β T allele) would have greater striatal iron content than individuals without this predisposition (C-homozygote carriers); and 2) IL-1β T inflammation risk would exacerbate age-related differences in striatal iron content and its effects on cognitive switching ability.
2.0. Methods
2.1. Participants
Participants included 183 healthy adults sampled across the lifespan (mean age = 53.68 ± 18.96; age range 20-94 years) for whom complete MRI, cognitive, and genetic data were collected (Table 1). Participants were collected as part of a larger sample of N = 190, of which 7 individuals were excluded from analysis due to incomplete genetic sampling. All participants were right-handed, fluent English speakers with normal or corrected-to-normal vision recruited from the Dallas-Fort Worth Metroplex. Participants were screened for a history of metabolic, neurological or psychiatric conditions, head trauma, drug or alcohol problems, significant cardiovascular disease, and MRI contraindications such as metallic implants or claustrophobia. Additional screening for depression and dementia, using the inclusion criteria from the Center for Epidemiologic Studies Depression Scale (CES-D) scores < 16 (Radloff, 1977) and Mini Mental State Exam (MMSE) scores ≥ 26 (Folstein et al., 1975), were included. MRI scanning took place on average within 50 days of neuropsychological data acquisition (M = 50.04, SD = 41.72 days). All participants provided written informed consent in accord with the local Institutional Review Boards.
Table 1.
Demographic profile of the sample and by IL-1β genotype.
| IL-1β Genetic Group |
||||
|---|---|---|---|---|
| Total Sample | C/C | C/T | T/T | |
| N | 183 | 73 | 87 | 23 |
| % female | 58.47% | 57.34% | 56.32% | 69.57% |
| Mean Age (years) | 53.68 ± 18.96 | 56.25 ± 19.75 | 53.79 ± 18.03 | 46.26 ± 18.66 |
| Age Range (years) | 20-94 | 20-94 | 21-86 | 20-82 |
| Education (years) | 15.49 ± 2.48 | 15.73 ± 2.46 | 15.40 ± 2.62 | 15.13 ± 2.16 |
| MMSE | 28.98 ± 0.88 | 28.89 ± 0.94 | 29.01 ± 0.82 | 29.09 ± 0.90 |
| CES-D | 4.20 ± 3.77 | 3.69 ± 3.84 | 4.63 ± 3.78 | 4.57 ± 3.48 |
| BMI | 27.51 ± 5.50 | 28.41 ± 5.35 | 26.93 ± 4.94 | 26.88 ± 7.54 |
| Systolic BP (mmHg) | 127.48 + 17.20 | 131.16 + 16.06 | 125.11 + 16.95 | 124.72 + 20.17 |
| Diastolic BP (mmHg) | 75.67 + 9.54 | 76.21 + 8.80 | 75.30 + 9.89 | 75.34 + 10.75 |
| % Hypertensive | 24.04 | 26.03 | 22.99 | 21.74 |
| % APOEɛ4+ | 18.54% | 16.43% | 20.69% | 13.04% |
Note: Means and standard deviations are reported for continuous variables. MMSE—Mini- Mental State Exam; CES-D—Center for Epidemiological Studies Depression Scale; BMI - Body Mass Index; BP - blood pressure.
2.2. Genetic Sequencing
DNA samples were collected using the Oragene Discover OGR-500 saliva collection kits and the prepIT-L2P purifier reagent (DNA Genotek, Ottawa, ON, Canada) during a neuropsychological testing visit (procedures described in detail in Kennedy et al., 2015). DNA extraction and genotyping were conducted at the University of Texas Southwestern Medical Center Microarray Core Facility. IL-1β C-511T information (rs16944) was acquired using TaqMan SNP Genotyping assays (Applied Biosystems). DNA genotyping reactions were carried out using the 0.5 x protocol with Applied Biosystem’s TaqMan Genotyping Master Mix. The observed genotype frequencies in this sample were 40% (n = 73) C/C homozygote, 48% (n = 87) C/T heterozygote, and 13% (n = 23) T/T homozygote. Hardy-Weinberg equilibrium for IL-1β C-511T was not violated: χ2 = 0.14, p = 0.71.
2.3. Imaging Protocol
Participants were scanned on a single Philips Achieva 3T whole-body scanner equipped with a 32-channel head coil (Philips Healthcare Systems, Best, Netherlands). The multi-echo susceptibility-weighted imaging (SWI) sequence used for iron estimation was collected as part of a larger neuroimaging protocol and included the following parameters: 65 axial slices, voxel size = 0.50 × 0.50 × 2.00 mm3, eight echo times: 5.68 ms +Δ 2.57 ms, flip angle = 15°, repetition time = 37 ms, field of view = 256 × 256, matrix = 512 × 512, 10:14 min in duration.
2.3.1. SWI Data Processing and Regional Iron Measurement.
SWI data were processed following previously described methods (Daugherty et al., 2015; Rodrigue et al., 2013). Images were analyzed with the Signal Processing in NMR software package (SPIN; MR Innovations, Inc., Detroit, MI, USA: http://mrinnovations.com/spin-lite; last accessed 06/27/18). A statistical threshold was applied during the creation of R2* maps using the extra-cranium space to filter noise and optimize signal. R2* relaxation rate is directly proportional to iron content (Haacke et al., 2005; Thomas et al., 1993). R2* was calculated as the inverse of T2* (R2* = 1/T2*), for which higher intensity values indicate relatively greater iron content.
Estimates of iron content in the caudate nucleus and putamen regions were sampled using masks of standardized size that were manually placed with the region of interest (ROI) on the R2* images (magnified ×4), using the first echo magnitude image as a guide. The circular mask sampled 24-pixels and four masks were placed within each ROI per hemisphere on each axial slice. The regions were measured on three (2-mm) contiguous, axial slices from a total of 12 masks in each region in each hemisphere of the brain. The masks were manually placed so to not overlap and to sample anterior and posterior portions of the ROI (two masks placed each in the anterior and posterior halves of the structures; Figure 1). Multiple masks were placed throughout the ROI in order to sample representative R2* signal. Measurements were averaged within hemisphere resulting in left and right average iron content estimates for the caudate nucleus and putamen. This manual procedure allowed the rater to place the masks to avoid measurement from vascular objects (i.e., heme iron), and partial voluming with surrounding white matter and cerebrospinal fluid, all of which would confound the interpretation of non-heme iron content from R2* relaxometry. High iron concentrations within the caudate nucleus and putamen bias regional segmentation (Lorio et al., 2014) and the use of circular masks minimized this source of bias. Reliability was established between two raters and tested using an intra-class correlation coefficient (Shrout and Fleiss, 1979). Using a sample of 10 participants, ICC(2) was greater than 0.90 for each region in each hemisphere.
Figure 1.
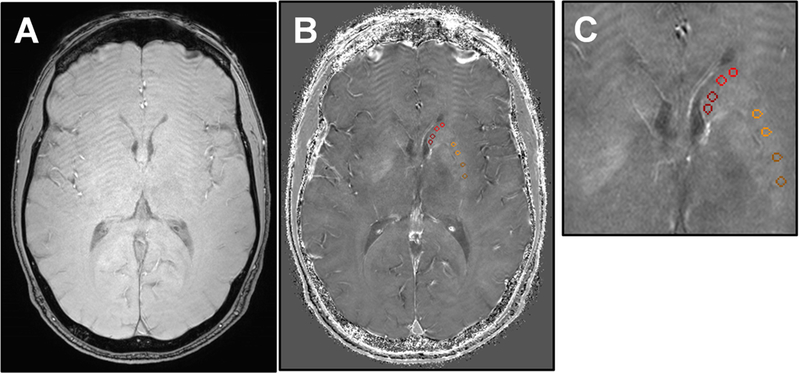
Example R2*-weighted imaging for the estimation of striatal iron content. R2*- weighted images were created from a multi-echo susceptibility weighted imaging sequence collected in the axial-plane with 0.5 × 0.5 × 2 mm3 voxels. (A) The first echo magnitude image served as an anatomical reference. (B) Estimates of iron content were taken from the R2*- weighted map via circular masks manually placed in each hemisphere of the caudate nucleus (red) and putamen (yellow) on three contiguous slices. On R2*-weighted images, brighter intensity values correspond to proportionally greater iron content. (C) The R2*-weighted image with regional masks is shown with x4 magnification.
2.4. Neuropsychological Testing
Participants completed a battery of neuropsychological tests to measure performance across a variety of cognitive domains. Aspects of executive function were measured from the Verbal Fluency and Color Word Interference subtests of the Delis-Kaplan Executive Function System test battery (D-KEFS; Delis et al., 2001). For the current study, the executive function domain of task switching was of primary interest. Three measures of cognitive switching ability were used to identify a latent construct: total correct responses for category switching on the Verbal Fluency subtest, and both self-corrected and uncorrected errors on the Color Word Interference subtest. These measures were selected because each is a validated assessment that provides a complementary evaluation of cognitive switching ability, and each measure is comparable with the other (i.e., number of correct response or errors).
2.5. Data Analysis.
Analyses were conducted in a structural equation modeling framework, estimated in MPlus (version 5.1, Muthén and Muthén, 2008). First, a structural equation model was constructed to test the effects of age on cognitive switching ability, mediated by striatal iron content, and included sex as a covariate. A latent construct was created for striatal iron content using the four R2* measurements (average left and right caudate nucleus and putamen). Measurement variance was freely estimated and hemispheric measures were allowed to correlate within each region. The cognitive switching latent construct was identified by the three cognitive variables (category switching correct responses, uncorrected and self-corrected color- word switching errors), for which higher values indicate better cognitive ability. Mediation was tested as significance of the indirect effect (p < 0.05; James and Brett, 1984) and the model was bootstrapped with bias-correction (5000 draws; Hayes and Scharkow, 2013) to produce 95% confidence intervals (BS 95% CI) of all effect estimates. This model was first fit in the entire sample. In a follow-up analysis, the latent construct values for striatal iron content and cognitive switching ability were extracted and tested for IL-1β genetic group differences in a general linear model, including age and sex as covariates.
In the second stage of analysis, a grouped structural equation model was fit by the three IL-1β genetic groups, which provided a test of genetic inflammation risk moderating the complex relationship between age, striatal iron content and cognitive switching ability. In the SEM framework, the covariance observed in the entire sample is used to inform the model estimation in each group separately, but simultaneously. This allows specifying constraints for measurement invariance across groups simultaneous to the estimation of group-specific paths and differences therein, which obviates the need for multiple comparison correction. Model constraints for equal factor loadings across groups were included, but the observed measurement means and variances were free to vary between groups. Group differences in the path coefficients were tested with an approximate z-test, with significance evaluated at p < 0.05. Model fit was evaluated by accepted indices (Raykov and Marcoulides, 2006): non-significant theory-weighted chi-square (Χ2, p > 0.05); Comparative Fit Index (CFI) ≥ 0.90 indicates excellent fit; root mean square error of approximation (RMSEA) < 0.08 indicates good fit, and standardized root mean residual (SRMR) < 0.08 indicates good fit. Measurement invariance across groups was evaluated following a step-wise procedure that introduced increasingly stringent equality constraints, and adequate fit of each model and change in CFI (ΔCFI) less than 0.01 in successive steps indicated that the degree of invariance was met (Cheung and Rensvold, 2002). For all models, unstandardized coefficients are reported, unless otherwise noted.
3.0. Results
3.1. Model Specification and Measurement Invariance Across Groups
Prior to hypothesis testing, the model construction was evaluated for the assumption of measurement invariance across groups. In the entire sample, the factor loadings of the four measures of striatal iron were significant (standardized loadings = 0.56-0.94, all p < 0.001), as were the three cognitive switching measures (standardized loadings: category switching correct = 0.49, p = 0.007, uncorrected color-word switching errors = −0.25, p = 0.025, self-corrected color-word switching errors = −0.50, p = 0.007). Compared between groups, measurement invariance was evaluated. The striatal iron latent construct met the assumption of strong factorial invariance, equal factor loadings and means (Χ2 = 14.65, p = 0.26, CFI = 0.99, RMSEA = 0.06 90% CI: 0.00/0.15, SRMR = 0.07), but not strict (ΔCFI = 0.02). The cognitive switching latent construct also met the assumptions of strong factorial invariance (Χ2 = 10.34, p = 0.24, CFI = 0.89, RMSEA = 0.07 90% CI: 0.00/0.17, SRMR = 0.08), but not strict (ΔCFI = 0.65). Therefore, model constraints for strong factorial invariance were included when testing hypotheses.
3.2. Age-Related Differences
Age-related differences in cognitive switching ability, mediated by striatal iron content, were first tested in a structural equation model estimated in the entire sample (see Figure 2). (See Table 2 for Pearson correlations among observed variables.) Older age was positively associated with greater striatal iron content [b = 0.21 (standardized = 0.73), p < 0.001; BS 95% CI: 0.16/0.29], which in turn predicted poorer cognitive switching ability [b = −0.26 (standardized = −0.72), p < 0.001; BS 95% CI: −0.45/−0.17], as illustrated in Figure 3. Importantly, the indirect effect of age on cognitive switching ability via striatal iron content was significant: indirect path = −0.06 (standardized = −0.52), p < 0.001; BS 95% CI: −0.08/−0.04. Women had better cognitive switching ability than men [b = 1.07 (standardized = 0.26), p = 0.01; BS 95% CI: 0.23/1.91], but there were no sex-related differences in striatal iron content [b = −1.43 (standardized = −0.13), p = 0.09; BS 95% CI: −3.40/0.02]. This model had excellent fit: Χ2 (23) = 34.84, p = 0.05; CFI = 0.98; RMSEA = 0.05 (90% CI: 0.00/0.09); SRMR = 0.04.
Figure 2.
A depiction of the structural equation model that estimated age-related differences in cognitive switching ability, mediated by striatal iron content, in the entire sample. Standardized coefficients are reported with significance indicated, * p < 0.05, and unstandardized coefficients are reported in italics in parentheses (unstandardized). Parameters for measurement model specification are illustrated; factor loadings for cognitive switching ability that are labeled as negative were specified in order for higher values to indicate better ability. Older age was associated with greater striatal iron content that, in turn, predicted poorer cognitive switching ability.
Table 2.
Bivariate correlations among observed variables.
| 1 | 2 | 3 | 4 | 5 | 6 | 7 | 8 | ||
|---|---|---|---|---|---|---|---|---|---|
| 1 | Age | 1.00 | |||||||
| 2 | Caudate R2*, Left | 0.45 | 1.00 | ||||||
| 3 | Caudate R2*, Right | 0.39 | 0.86 | 1.00 | |||||
| 4 | Putamen R2*, Left | 0.47 | 0.48 | 0.53 | 1.00 | ||||
| 5 | Putamen R2*, Right | 0.51 | 0.48 | 0.48 | 0.86 | 1.00 | |||
| 6 | Category Switch (total correct) | −0.37 | −0.24 | −0.26 | −0.26 | −0.30 | 1.00 | ||
| 7 | Color-Word Switch Error (uncorrected) | 0.19 | 0.14 | 0.13 | 0.23 | 0.21 | −0.13 | 1.00 | |
| 8 | Color-Word Switch Error (self-corrected) | 0.28 | 0.16 | 0.16 | 0.12 | 0.09 | −0.26 | 0.13 | 1.00 |
Note: Pearson correlations are reported, bolding indicates p < 0.05. Observed measures were used to specify a structural equation model, including latent constructs of striatal iron content and cognitive switching ability (see Methods section).
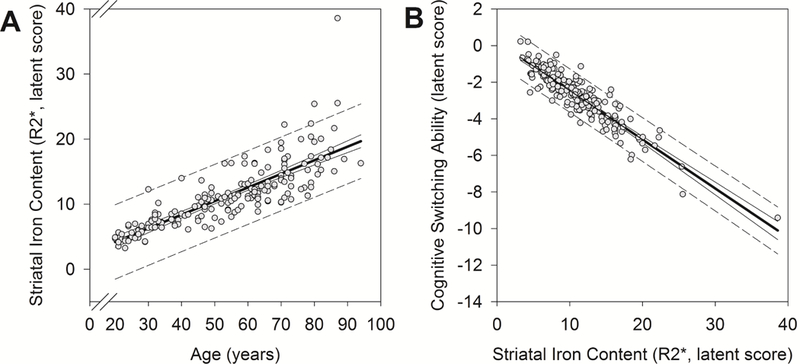
Figure 3.
Average effects of age and striatal iron content as estimated in the total sample. Regression lines (solid, bold line) are shown with 95% confidence intervals (solid line) and predictive intervals (broken line). (A) Older age was associated with greater latent striatal iron content: b = 0.21 (standardized = 0.73), p < 0.001. (B) Greater latent striatal iron content, in turn, predicted poorer cognitive switching ability: b = −0.26 (standardized = −0.72), p < 0.001.
3.3. IL-1β Genetic Group Differences
Comparing the demographic features of the IL-1β genetic groups (Table 1), C/C and C/T groups were of similar ages (t(158) = 0.93, p = 0.36), whereas T/T carriers were on average younger than C/C counterparts (t(94) = 2.14, p = 0.04). Accounting for age and sex, IL-1β genetic groups were statistically similar in average striatal iron content (F(2,178) = 0.02, p = 0.98) and cognitive switching ability (F(2,178) = 0.87, p = 0.42). IL-1β genetic groups were similar in body mass index (F(2, 180) = 1.61, p = 0.20), average systolic (F(2, 180) = 2.85, p = 0.06) and diastolic blood pressure (F(2, 180) = 0.20, p = 0.82), and each group presented with a similar frequency of hypertension diagnosis (F(2, 180) = 0.14, p = 0.87) and APOEɛ4 genotype (X2 (4) = 1.80, p = .77; see Table 1).
In the grouped structural equation model (Figure 4), the magnitude of the associations between age, striatal iron content and cognitive switching ability were tested for differences between IL-1 p genetic groups. The grouped model had acceptable fit: Χ2 (71) = 106.34, p = 0.004 (group Χ2 contribution, C/C = 46.25, C/T = 36.94, T/T = 23.14), CFI = 0.95, RMSEA = 0.09 (90% CI: 0.05/0.12), SRMR = 0.11. Sex was tested as a covariate in the grouped model, but was not significant in any group (all p’s = 0.06-0.76) and because its inclusion diminished model fit it was removed from the grouped model.
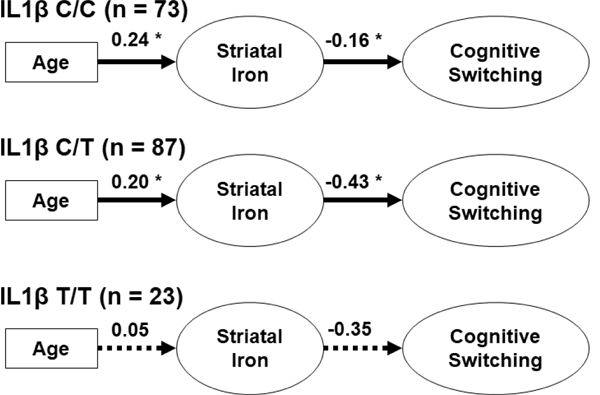
Figure 4.
A depiction of the grouped structural equation model that estimated age-related differences in cognitive switching ability, mediated by striatal iron content, in each IL-1β genetic group. Unstandardized coefficients are reported and significant effects are indicated with a solid line (*p < 0.05), and non-significant effects with a broken line. Carriage of the IL-1β T allele was associated with greater consequence of striatal iron content on cognitive switching ability as compared to IL-1β C-homozygote counterparts.
A similar pattern of effects was identified in the IL-1β C/C and C/T groups (see Figure 4) but the magnitude of effects differed. Whereas both groups had similar age-related differences in striatal iron content (difference = 0.04, z = 0.74, p = 0.46; BS 95% CI: −0.06/0.21), the IL-1β C/T group demonstrated poorer cognitive switching ability in relation to iron content (difference = 0.26, z = 2.32, p = 0.02; BS 95% CI: 0.00/0.68; see Figure 5B). Effects within the IL-1β T/T group failed to reach significance (all p’s > 0.25; see Figure 4), but the effect magnitudes of each path can be compared between groups. The IL-1β T/T carriers showed a lesser effect of age on striatal iron content as compared to the C/C (difference = 0.19, z = 3.03, p = 0.002; BS 95% CI: 0.06/0.37) and C/T carriers (difference = 0.15, z = 3.04, p = 0.002; BS 95% CI:0.07/0.27; see Figure 5A). Yet, the relationship between striatal iron content and cognitive switching ability was similar to the other groups (vs. C/C difference = 0.19, BS 95% CI: - 0.42/7.72, z = 0.11, p = 0.80; vs. C/T difference = −0.07 BS 95% CI: −0.76/5.87, z = −0.10, p = 0.92). In summary, the IL-1β T/T homozygote carriers demonstrated similar striatal iron content and cognitive switching ability as the other genetic groups, despite being, on average, younger. When IL-1β C/T and T/T carriers were combined into a single risk group, the effects of age on striatal iron content (z = 0.60, p = 0.55) and iron content on switching ability (z = 0.04, p = 0.97) were similar to those in the C/C homozygote group. This model had reasonable fit: Χ2 (42) = 79.28, p = 0.0004 (group x2 contribution, C/C = 38.51, combined C/T+T/T = 40.70), CFI = 0.95, RMSEA = 0.10 (90% CI: 0.06/0.13), SRMR = 0.09.
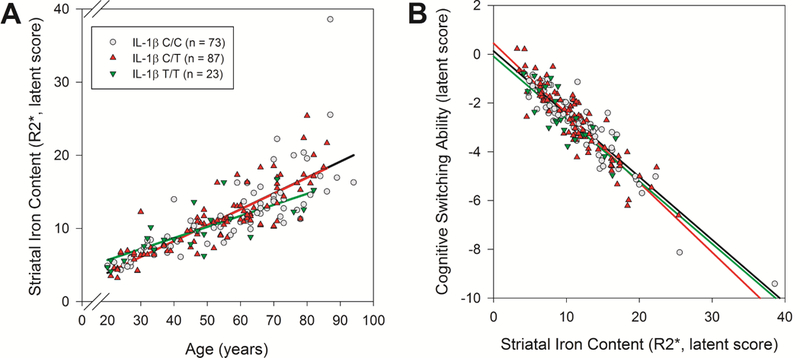
Figure 5.

IL-1β genetic group differences in the magnitude of the effects of age and striatal iron content. (A) IL-1β T/T carriers demonstrated lesser age-related differences in striatal iron content as compared to the other groups. (B) IL-1β C/T carriers demonstrated poorer cognitive switching ability in relation to striatal iron content than IL-1β C/C carriers.
4.0. Discussion
The dependency between inflammation and iron homeostasis has been proposed to mutually drive neurodegeneration (Finch and Morgan, 2007; Franceschi and Campisi, 2014; Raz and Daugherty, 2018), and here we provide evidence of genetic inflammation risk exacerbating the cognitive consequences of age-related brain iron accumulation. Older age was positively associated with greater striatal iron content that in turn, predicted worse cognitive switching ability. The risky IL-1β T allele predisposes individuals for greater pro-inflammatory cytokine expression (Hurme and Santtila, 1998), and IL-1β T carriers demonstrated greater negative effects of striatal iron content on cognitive switching ability. Despite being on average younger, IL-1β T/T homozygotes had similar average striatal iron content and cognitive switching ability as the other groups. Taken together, our findings suggest that IL-1β genetic risk for inflammation may be associated with a shift in striatal iron homeostasis towards accumulation and exacerbate iron-related cognitive deficits.
Iron accumulation contributes to neural and cognitive decline via a mechanism of oxidative stress and energetic deficit. Accumulation of iron outside of binding complexes produces excessive oxidative stress that interferes with mitochondrial function, accelerates apoptosis and compromises neurotransmission (Mills et al., 2010; Ward et al., 2014). The cumulative effect over time is global structural and functional alterations that can be detected with MRI and behavioral assessment (Harman, 1956; Raz and Daugherty, 2018). Accumulation of striatal iron predicts regional shrinkage over 2 years (Daugherty et al., 2015) and up to 7 years later (Daugherty and Raz, 2016). Moreover, greater striatal iron content is associated with decreased executive function performance (Ghadery et al., 2015), working memory span (Bartzokis et al., 2011), and psychomotor ability (Adamo et al., 2014; Sullivan et al., 2009). Independent of regional shrinkage, longitudinal accumulation of iron in the striatum over 2 years predicts declines in working memory (Daugherty et al., 2015) and spatial navigation ability that relies on procedural skill (Daugherty and Raz, 2017). In line with the reviewed evidence, the current study finds that older age was positively associated with greater striatal iron content (estimated from R2* relaxometry) and this predicted poorer cognitive switching performance.
Several factors have been proposed to interact with iron-related oxidative stress in the aging brain (Daugherty and Raz, 2015; Raz and Daugherty, 2018), but none as intriguing as inflammation. Similar to non-heme iron accumulation, chronic inflammation encourages the production of oxidative stress and disrupts mitochondrial function to produce neural and cognitive deficits (Finch and Morgan, 2007; Franceschi and Campisi, 2014; Williams et al., 2012). The interdependency between pro-inflammatory IL-1β expression and iron homeostasis has been observed in animal and in vitro studies (e.g., O’Brien-Ladñer et al., 2000; Pinero et al., 2000) and, to the best of our knowledge, this is the first report of IL-1β genetic risk and brain iron synergy in human cognitive aging. IL-1β C/T carriers demonstrated a greater negative association between striatal iron content and cognitive switching ability as compared to IL-1β C/C counterparts. Critically, the C/C and C/T groups were statistically similar in average age and striatal iron content, thus the risky IL-1β T allele was associated with greater consequence of striatal iron content on cognitive switching ability.
Inflammation and iron-related oxidative stress are both implicated in mechanisms of neurodegeneration, including Alzheimer’s disease (Finch and Morgan, 2007; Franceschi and Campisi, 2014; Harman, 1956; Raz and Daugherty, 2018). Brain iron accumulates at a faster rate in the progression of neurodegenerative disease (Ulla et al., 2013; Walsh et al., 2014) and there is mixed evidence of greater concentrations present in Alzheimer’s disease as compared to healthy adults (Langkammer et al., 2014; Quintana et al., 2006; Schrag et al., 2011). In parallel, increased inflammation is observed in regions vulnerable in the progression of Alzheimer’s disease, and the accumulation of beta amyloid plaques and tau tangles propagates local inflammation (Akiyama et al., 2000). Here we provide evidence of the synergism between genetic inflammation risk and brain iron content exacerbating cognitive deficits in ostensibly healthy aging and a similar mechanism may drive part of the decline observed in Alzheimer’s disease (Raz and Daugherty, 2018).
In this study we find no evidence of genetic inflammation risk exacerbating age-related differences in striatal iron content. Considering that IL-1β T/T carriers were on average younger than the other groups, it is noteworthy that these individuals had similar average iron content and showed a similar magnitude of its effect on cognitive switching. Indeed, age explained comparatively less variance in striatal iron content within the IL-1β T/T group. This observation may merely reflect a sample selection bias—individuals at increased risk for inflammation may develop health conditions in later life that would disqualify them from this study. Yet, it is plausible that individuals who are genetically predisposed for greater IL-1β expression may demonstrate iron accumulation and related cognitive deficits independent of chronological age effects. Due to the cross-sectional design of the current study and the relatively smaller group of IL-1β T/T homozygote individuals, we cannot disambiguate these two interpretations and this is an intriguing question for future studies to address.
The reported results should be interpreted with consideration of their strengths and limitations. First, cross-sectional estimates of aging and its mediation are biased (Lindenberger et al., 2011; Maxwell and Cole, 2007) and the study design precludes tests of causality. Through a regression-based analysis, we have identified a compelling set of associations but we cannot determine the temporal ordering of effects without longitudinal follow-up. Second, the size of the IL-1β genetic groups was relatively small, although representative of the population as they were in Hardy-Weinberg equilibrium. Yet, tests of the effects estimated within the IL-1β T/T group may have been underpowered. Third, as this is an in vivo study, our measures of inflammation and brain iron are proxy variables and indirect assessments. We did not measure circulating IL-1β levels and we can only infer genotypic risk for inflammation. R2* relaxometry is not a specific measure of non-heme iron; magnetic susceptibility from heme iron within blood vessels and myelinated fibers will also increase R2* (Daugherty and Raz, 2015; Glasser and Van Essen, 2011; Haacke et al., 2005). However, R2* is a well-validated measure of brain iron (Thomas et al., 1993; Vymazal et al., 1995) and the use of circular masks that were placed manually to exclude measurement from vascular objects, and partial voluming of white matter and cerebrospinal fluid greatly mitigated these sources of confound. Greater iron content can bias the boundary segmentation of the striatal regions (Lorio et al., 2014) and the use of circular masks avoided this source of bias as well, although variability of effects within a region is unknown (Li et al., 2011). Fourth, the selected measures of cognitive switching ability provide a validated assessment, but a limited one. Future studies should consider additional assessments and cognitive abilities. Finally, the reported structural equation models present a focused, a priori selected account of the myriad factors relevant to brain and cognitive aging—regional volumetry, cardiovascular health and other cognitive abilities, for example, may further modify the effects we report here. The striatal regions are constituents of a larger network that supports executive functions and the sensitivity of other relevant brain regions to these factors may further explain age-related deficits in cognitive switching ability. The smaller genetic group sizes restricted the number of parameters that could be estimated and future studies with larger samples should consider additional covariates and brain regions.
4.1. Conclusion
Brain iron accumulation and chronic inflammation are hypothesized to mutually drive neural and cognitive declines in aging and related disease (Finch and Morgan, 2007; Franceschi and Campisi, 2014; Harman, 1956; Raz and Daugherty, 2018). Here we present evidence of genetic inflammation risk interacting with striatal iron content to exacerbate age- related deficits in cognitive switching ability. Critically, inflammation is a modifiable health factor that may serve as a promising therapeutic target to promote cognitive maintenance into senium.
Acknowledgments
Acknowledgments
This work was supported, in part, by grants from National Institutes of Health: R00 AG-03618, R00 AG-03648 and R01 AG-056535, as well as support from BvB Dallas and AWARE. The authors would like to thank Colleen McNamee for assistance with the R2* measurements.
Footnotes
Publisher's Disclaimer: This is a PDF file of an unedited manuscript that has been accepted for publication. As a service to our customers we are providing this early version of the manuscript. The manuscript will undergo copyediting, typesetting, and review of the resulting proof before it is published in its final citable form. Please note that during the production process errors may be discovered which could affect the content, and all legal disclaimers that apply to the journal pertain.
References
- Adamo DE, Daugherty AM, Raz N, 2014. Grasp force matching and brain iron content estimated in vivo in older women. Brain Imaging Behav. 8, 579–587. https://doi.org/10.1007/s11682-013-9284-6 [DOI] [PubMed] [Google Scholar]
- Akiyama H, Barger S, Barnum S, Bradt B, Bauer J, Cole GM, Cooper NR, Eikelenboom P, Emmerling M, Fiebich BL, Finch CE, Frautschy S, Griffin WST, Hampel H, Hull M, Landreth G, Lue L, Mrak R, Mackenzie IR, McGeer PL, O’Banion MK, Pachter J, Pasinetti G, Plata-Salaman C, Rogers J, Rydel R, Shen Y, Streit W, Strohmeyer R, Tooyoma I, Van Muiswinkel FL, Veerhuis R, Walker D, Webster S, Wegrzyniak B, Wenk G, Wyss-Coray T, 2000. Inflammation and Alzheimer’s disease. Neurobiol. Aging 21, 383–421. [DOI] [PMC free article] [PubMed] [Google Scholar]
- Andrews NC, 2000. Iron homeostasis: Insights from genetics and animal models. Nat. Rev. Genet. 1, 208–217. [DOI] [PubMed] [Google Scholar]
- Banks WA, 2005. Blood-Brain Barrier Transport of Cytokines: A Mechanism for Neuropathology [WWW Document]. Curr. Pharm. Des. URL http://www.eurekaselect.com/60690/article (accessed 6.25.18). [DOI] [PubMed] [Google Scholar]
- Banks WA, Kastin AJ, Broadwell RD, 1995. Passage of Cytokines across the Blood-Brain Barrier. Neuroimmunomodulation 2, 241–248. 10.1159/000097202, [DOI] [PubMed] [Google Scholar]
- Barnes CA, 2003. Long-term potentiation and the ageing brain. Philos. Trans. R. Soc. B Biol.Sci. 358, 765–772. 10.1098/rstb.2002.1244 [DOI] [PMC free article] [PubMed] [Google Scholar]
- Bartzokis G, Lu PH, Tingus K, Peters DG, Amar CP, Tishler TA, Finn JP, Villablanca P, Altshuler LL, Mintz J, Neely E, Connor JR, 2011. Gender and Iron Genes May Modify Associations Between Brain Iron and Memory in Healthy Aging. Neuropsychopharmacology 36, 1375–1384. 10.1038/npp.2011.22 [DOI] [PMC free article] [PubMed] [Google Scholar]
- Blasko I, Stampfer-Kountchev M, Robatscher P, Veerhuis R, Eikelenboom P, Grubeck- Loebenstein B, 2004. How chronic inflammation can affect the brain and support the development of Alzheimer’s disease in old age: the role of microglia and astrocytes. Aging Cell 3, 169–176. [DOI] [PubMed] [Google Scholar]
- Boumezbeur F, Mason GF, de Graaf RA, Behar KL, Cline GW, Shulman GI, Rothman DL, Petersen KF, 2010. Altered brain mitochondrial metabolism in healthy aging as assessed by in vivo magnetic resonance spectroscopy. J. Cereb. Blood Flow Metab. Off. J. Int. Soc. Cereb. Blood Flow Metab. 30, 211–221. 10.1038/jcbfm.2009.197 [DOI] [PMC free article] [PubMed] [Google Scholar]
- Brass SD, Benedict RH, Weinstock-Guttman B, Munschauer F, Bakshi R, 2006. Cognitive impairment is associated with subcortical magnetic resonance imaging grey matter T2 hypointensity in multiple sclerosis. Mult. Scler. J. 12, 437–444. 10.1191/135248506ms1301oa [DOI] [PubMed] [Google Scholar]
- Cheung GW, Rensvold RB, 2002. Evaluating goodness-of-fit indexes for testing measurement invariance. Struct. Equ. Model. 9, 233–255. 10.1207/S15328007SEM0902_5 [DOI] [Google Scholar]
- Daugherty A, Raz N, 2013. Age-related differences in iron content of subcortical nuclei observed in vivo: A meta-analysis. NeuroImage 70, 113–121. 10.1016/j.neuroimage.2012.12.040 [DOI] [PMC free article] [PubMed] [Google Scholar]
- Daugherty AM, Haacke EM, Raz N, 2015. Striatal Iron Content Predicts Its Shrinkage and Changes in Verbal Working Memory after Two Years in Healthy Adults. J. Neurosci. 35, 6731–6743. 10.1523/JNEUR0SCI.4717-14.2015 [DOI] [PMC free article] [PubMed] [Google Scholar]
- Daugherty AM, Raz N, 2017. A virtual water maze revisited: Two-year changes in navigation performance and their neural correlates in healthy adults. NeuroImage 146, 492–506. 10.1016/j.neuroimage.2016.09.044 [DOI] [PMC free article] [PubMed] [Google Scholar]
- Daugherty AM, Raz N, 2016. Accumulation of iron in the putamen predicts its shrinkage in healthy older adults: A multi-occasion longitudinal study. NeuroImage 128, 11–20. 10.1016/j.neuroimage.2015.12.045 [DOI] [PMC free article] [PubMed] [Google Scholar]
- Daugherty AM, Raz N, 2015. Appraising the Role of Iron in Brain Aging and Cognition: Promises and Limitations of MRI Methods. Neuropsychol. Rev. 25, 272–287. 10.1007/s11065-015-9292-y [DOI] [PMC free article] [PubMed] [Google Scholar]
- Di Bona D, Plaia A, Vasto S, Cavallone L, Lescai F, Franceschi C, Licastro F, Colonna-Romano G, Lio D, Candore G, Caruso C, 2008. Association between the interleukin-1β polymorphisms and Alzheimer’s disease: A systematic review and meta-analysis. Brain Res. Rev. 59, 155–163. 10.1016/j.brainresrev.2008.07.003 [DOI] [PubMed] [Google Scholar]
- Dröge W, Schipper HM, 2007. Oxidative stress and aberrant signaling in aging and cognitive decline. Aging Cell 6, 361–370. 10.1111/j.1474-9726.2007.00294.x [DOI] [PMC free article] [PubMed] [Google Scholar]
- Finch CE, Morgan TE, 2007. Systemic Inflammation, Infection, ApoE Alleles, and Alzheimer Disease: A Position Paper [WWW Document]. Curr. Alzheimer Res. URL http://www.eurekaselect.com/78011/article (accessed 6.24.18). [DOI] [PubMed] [Google Scholar]
- Franceschi C, Campisi J, 2014. Chronic Inflammation (Inflammaging) and Its Potential Contribution to Age-Associated Diseases. J. Gerontol. A. Biol. Sci. Med. Sci. 69, S4–S9. 10.1093/gerona/glu057 [DOI] [PubMed] [Google Scholar]
- Ghadery C, Pirpamer L, Hofer E, Langkammer C, Petrovic K, Loitfelder M, Schwingenschuh P, Seiler S, Duering M, Jouvent E, Schmidt H, Fazekas F, Mangin J-F, Chabriat H, Dichgans M, Ropele S, Schmidt R, 2015. R2* mapping for brain iron: associations with cognition in normal aging. Neurobiol. Aging 36, 925–932. 10.1016/j.neurobiolaging.2014.09.013 [DOI] [PubMed] [Google Scholar]
- Glasser MF, Van Essen DC, 2011. Mapping Human Cortical Areas In Vivo Based on Myelin Content as Revealed by T1- and T2-Weighted MRI. J. Neurosci. 31, 11597–11616. 10.1523/JNEUR0SCI.2180-11.2011 [DOI] [PMC free article] [PubMed] [Google Scholar]
- Haacke EM, Cheng NYC, House MJ, Liu Q, Neelavalli J, Ogg RJ, Khan A, Ayaz M, Kirsch W, Obenaus A, 2005. Imaging iron stores in the brain using magnetic resonance imaging. Magn. Reson. Imaging 23, 1–25. 10.1016/j.mri.2004.10.001 [DOI] [PubMed] [Google Scholar]
- Hallgren B, Sourander P, 1958. The Effect of Age on the Non-Haemin Iron in the Human Brain. J. Neurochem. 3, 41–51. 10.1111/j.1471-4159.1958.tb12607.x [DOI] [PubMed] [Google Scholar]
- Harman D, 1956. Aging: A Theory Based on Free Radical and Radiation Chemistry. J. Gerontol. 11, 298–300. 10.1093/geronj/113.298 [DOI] [PubMed] [Google Scholar]
- Hayes AF, Scharkow M, 2013. The Relative Trustworthiness of Inferential Tests of the Indirect Effect in Statistical Mediation Analysis: Does Method Really Matter? Psychol. Sci. 24, 1918–1927. 10.1177/0956797613480187 [DOI] [PubMed] [Google Scholar]
- Hurme M, Santtila S, 1998. IL-1 receptor antagonist (IL-1Ra) plasma levels are co-ordinately regulated by both IL-1Ra and IL-1β genes. Eur. J. Immunol. 28, 2598–2602. [DOI] [PubMed] [Google Scholar]
- Jahanshad N, Rajagopalan P, Thompson PM, 2013. Neuroimaging, nutrition, and iron- related genes. Cell. Mol. Life Sci. 70, 4449–4461. 10.1007/s00018-013-1369-2 [DOI] [PMC free article] [PubMed] [Google Scholar]
- James LR, Brett JM, 1984. Mediators, Moderators, and Tests for Mediation. J. Appl. Psychol. 69, 307–321. [Google Scholar]
- Kauffman MA, Moron DG, Consalvo D, Bello R, Kochen S, 2008. Association study between interleukin 1ß gene and epileptic disorders: a HuGe review and meta-analysis. Genet. Med. 10, 83–88. 10.1097/GIM.0b013e318161317c [DOI] [PubMed] [Google Scholar]
- Kennedy KM, Raz N, 2015. Normal Aging of the Brain, in: Toga AW (Ed): Brain Mapping: An Encyclopedia Reference. Elsevier. [Google Scholar]
- Kirkwood TBL, Feder M, Finch CE, Franceschi C, Globerson A, Klingenberg CP, LaMarco K, Omholt S, Westendorp RGJ, 2005. What accounts for the wide variation in life span of genetically identical organisms reared in a constant environment? Mech. Ageing Dev. 126, 439–443. 10.1016/j.mad.2004.09.008 [DOI] [PubMed] [Google Scholar]
- Langkammer C, Ropele S, Pirpamer L, Fazekas F, Schmidt R, 2014. MRI for Iron Mapping in Alzheimer’s Disease. Neurodegener. Dis. 13, 189–191. 10.1159/000353756 [DOI] [PubMed] [Google Scholar]
- Lawlor DA, Harbord RM, Sterne JAC, Timpson N, Davey Smith G, 2008. Mendelian randomization: using genes as instruments for making causal inferences in epidemiology. Stat. Med. 27, 1133–1163. 10.1002/sim.3034 [DOI] [PubMed] [Google Scholar]
- Leh SE, Petrides M, Strafella AP, 2010. The Neural Circuitry of Executive Functions in Healthy Subjects and Parkinson’s Disease. Neuropsychopharmacology 35, 70–85. 10.1038/npp.2009.88 [DOI] [PMC free article] [PubMed] [Google Scholar]
- Lehmann DJ, Worwood M, Ellis R, Wimhurst VLJ, Merryweather-Clarke AT, Warden DR, Smith AD, Robson KJH, 2006. Iron genes, iron load and risk of Alzheimer’s disease. J. Med. Genet. 43, e52–e52. 10.1136/jmg.2006.040519 [DOI] [PMC free article] [PubMed] [Google Scholar]
- Li W, Wu B, Liu C, 2011. Quantitative susceptibility mapping of human brain reflects spatial variation in tissue composition. NeuroImage 55, 1645–1656. 10.1016/j.neuroimage.2010.11.088 [DOI] [PMC free article] [PubMed] [Google Scholar]
- Lindenberger U, von Oertzen T, Ghisletta P, Hertzog C, 2011. Cross-sectional age variance extraction: What’s change got to do with it? Psychol. Aging 26, 34–47. 10.1037/a0020525 [DOI] [PubMed] [Google Scholar]
- Lorio S, Lutti A, Kherif F, Ruef A, Dukart J, Chowdhury R, Frackowiak RS, Ashburner J, Helms G, Weiskopf N, Draganski B, 2014. Disentangling in vivo the effects of iron content and atrophy on the ageing human brain. NeuroImage 103, 280–289. 10.1016/j.neuroimage.2014.09.044 [DOI] [PMC free article] [PubMed] [Google Scholar]
- Maxwell SE, Cole DA, 2007. Bias in cross-sectional analyses of longitudinal mediation. Psychol. Methods 12, 23–44. 10.1037/1082-989X.12.123 [DOI] [PubMed] [Google Scholar]
- Meiser J, Weindl D, Hiller K, 2013. Complexity of dopamine metabolism. Cell Commun. Signal. CCS 11, 34 [DOI] [PMC free article] [PubMed] [Google Scholar]
- Mills E, Dong X, Wang F, Xu H, 2010. Mechanisms of brain iron transport: insight into neurodegeneration and CNS disorders. Future Med. Chem. 2, 51–64. 10.4155/fmc.09.140 [DOI] [PMC free article] [PubMed] [Google Scholar]
- Moos T, Morgan EH, 2004. The Metabolism of Neuronal Iron and Its Pathogenic Role in Neurological Disease: Review. Ann. N. Y. Acad. Sci. 1012, 14–26. 10.1196/annals.1306.002 [DOI] [PubMed] [Google Scholar]
- O’Brien-Ladner AR, Nelson SR, Murphy WJ, Blumer BM, Wesselius LJ, 2000. Iron Is a Regulatory Component of Human IL-1. Production 23, 8. [DOI] [PubMed] [Google Scholar]
- Persson N, Ghisletta P, Dahle CL, Bender AR, Yang Y, Yuan P, Daugherty AM, Raz N, 2014. Regional brain shrinkage over two years: Individual differences and effects of pro-inflammatory genetic polymorphisms. NeuroImage 103, 334–348. 10.1016/j.neuroimage.2014.09.042 [DOI] [PMC free article] [PubMed] [Google Scholar]
- Petrulli JR, Kalish B, Nabulsi NB, Huang Y, Hannestad J, Morris ED, 2017. Systemic inflammation enhances stimulant-induced striatal dopamine elevation. Transl. Psychiatry 7, e1076 10.1038/tp.2017.18 [DOI] [PMC free article] [PubMed] [Google Scholar]
- Piñero DJ, Hu J, Cook BM, Scaduto RC, Connor JR, 2000. Interleukin-1beta increases binding of the iron regulatory protein and the synthesis of ferritin by increasing the labile iron pool. Biochim. Biophys. Acta 1497, 279–288. [DOI] [PubMed] [Google Scholar]
- Quintana C, Bellefqih S, Laval JY, Guerquin-Kern JL, Wu TD, Avila J, Ferrer I, Arranz R, Patino C, 2006. Study of the localization of iron, ferritin, and hemosiderin in Alzheimer’s disease hippocampus by analytical microscopy at the subcellular level. J. Struct. Biol. 153, 42–54. 10.1016/jjsb.2005.11.001 [DOI] [PubMed] [Google Scholar]
- Raykov T, Marcoulides GA, 2006. A first course in structural equation modeling, 2nd ed, A first course in structural equation modeling, 2nd ed Lawrence Erlbaum Associates Publishers, Mahwah, NJ, Us. [Google Scholar]
- Raz N, Daugherty AM, 2018. Pathways to Brain Aging and Their Modifiers: Free-Radical- Induced Energetic and Neural Decline in Senescence (FRIENDS) Model - A Mini-Review. Gerontology 64, 49–57. 10.1016/jjsb.2005.11.001 [DOI] [PMC free article] [PubMed] [Google Scholar]
- Raz N, Daugherty AM, Bender AR, Dahle CL, Land S, 2015. Volume of the hippocampal subfields in healthy adults: differential associations with age and a pro- inflammatory genetic variant. Brain Struct. Funct. 220, 2663–2674. [DOI] [PMC free article] [PubMed] [Google Scholar]
- Raz N, Ghisletta P, Rodrigue KM, Kennedy KM, Lindenberger U, 2010. Trajectories of brain aging in middle-aged and older adults: Regional and individual differences. NeuroImage 51, 501–511. https://doi.org/10.1016Zj.neuroimage.2010.03.020 [DOI] [PMC free article] [PubMed] [Google Scholar]
- Raz N, Yang Y, Dahle CL, Land S, 2012. Volume of white matter hyperintensities in healthy adults: Contribution of age, vascular risk factors, and inflammation-related genetic variants. Biochim. Biophys. Acta BBA - Mol. Basis Dis. 1822, 361–369. 10.1016/j.bbadis.2011.08.007 [DOI] [PMC free article] [PubMed] [Google Scholar]
- Rockwood K, Mogilner A, Mitnitski A, 2004. Changes with age in the distribution of a frailty index. Mech. Ageing Dev. 125, 517–519. 10.1016/j.mad.2004.05.003 [DOI] [PubMed] [Google Scholar]
- Rodrigue KM, Daugherty AM, Haacke EM, Raz N, 2013. The Role of Hippocampal Iron Concentration and Hippocampal Volume in Age-Related Differences in Memory. Cereb. Cortex 23, 1533–1541. 10.1093/cercor/bhs139 [DOI] [PMC free article] [PubMed] [Google Scholar]
- Rodrigue KM, Haacke EM, Raz N, 2011. Differential effects of age and history of hypertension on regional brain volumes and iron. NeuroImage 54, 750–759. 10.1016/j.neuroimage.2010.09.068 [DOI] [PMC free article] [PubMed] [Google Scholar]
- Schneider H, Pitossi F, Balschun D, Wagner A, del Rey A, Besedovsky HO, 1998. A neuromodulatory role of interleukin-1β in the hippocampus. Proc. Natl. Acad. Sci. U. S.A. 95, 7778–7783. [DOI] [PMC free article] [PubMed] [Google Scholar]
- Schrag M, Mueller C, Oyoyo U, Kirsch WM, 2011. Iron, zinc and copper in the Alzheimer’s disease brain: a quantitative meta-analysis. Some insight on the influence of citation bias on scientific opinion. Prog. Neurobiol. 94, 296–306. 10.1016/j.pneurobio.2011.05.001 [DOI] [PMC free article] [PubMed] [Google Scholar]
- Serrano F, Klann E, 2004. Reactive oxygen species and synaptic plasticity in the aging hippocampus. Ageing Res. Rev., Synaptic Function and Behavior During Normal Ageing 3, 431–443. 10.1016/j.arr.2004.05.002 [DOI] [PubMed] [Google Scholar]
- Shrout PE, Fleiss JL, 1979. Intraclass Correlations: Uses in Assessing Rater Reliability. Psychol. Bull. 86, 420–428. [DOI] [PubMed] [Google Scholar]
- Smirnov IM, Bailey K, Flowers CH, Garrigues NW, Wesselius LJ, 1999. Effects of TNF- alpha and IL-1beta on iron metabolism by A549 cells and influence on cytotoxicity. Am. J. Physiol. 277, L257–263. [DOI] [PubMed] [Google Scholar]
- Sullivan EV, Adalsteinsson E, Rohlfing T, Pfefferbaum A, 2009. Relevance of Iron Deposition in Deep Gray Matter Brain Structures to Cognitive and Motor Performance in Healthy Elderly Men and Women: Exploratory Findings. Brain Imaging Behav. 3, 167–175. 10.1007/s11682-008-9059-7 [DOI] [PMC free article] [PubMed] [Google Scholar]
- Thomas LO, Boyko OB, Anthony DC, Burger PC, 1993. MR detection of brain iron. AJNR Am. J. Neuroradiol. 14, 1043–1048. [PMC free article] [PubMed] [Google Scholar]
- Todorich B, Pasquini JM, Garcia CI, Paez PM, Connor JR, 2009. Oligodendrocytes and myelination: The role of iron. Glia 57, 467–478. 10.1002/glia.20784 [DOI] [PubMed] [Google Scholar]
- Ulla M, Bonny JM, Ouchchane L, Rieu I, Claise B, Durif F, 2013. Is R2* a New MRI Biomarker for the Progression of Parkinson’s Disease? A Longitudinal Follow-Up. PLoS ONE 8, e57904 10.1371/journal.pone.0057904 [DOI] [PMC free article] [PubMed] [Google Scholar]
- Vymazal J, Brooks RA, Patronas N, Hajek M, Bulte JWM, Di Chiro G, 1995. Magnetic resonance imaging of brain iron in health and disease. J. Neurol. Sci. 134, 19–26. 10.1016/0022-510X(95)00204-F [DOI] [PubMed] [Google Scholar]
- Walsh AJ, Blevins G, Lebel RM, Seres P, Emery DJ, Wilman AH, 2014. Longitudinal MR Imaging of Iron in Multiple Sclerosis: An Imaging Marker of Disease. Radiology 270, 186–196. 10.1148/radiol.13130474 [DOI] [PubMed] [Google Scholar]
- Wang Jia, Song, Jiang H, Wang Jun, Xie J., 2013. Pro-inflammatory cytokines modulate iron regulatory protein 1 expression and iron transportation through reactive oxygen/nitrogen species production in ventral mesencephalic neurons. Biochim. Biophys. Acta BBA - Mol. Basis Dis. 1832, 618–625. 10.1016/j.bbadis.2013.01.021 [DOI] [PubMed] [Google Scholar]
- Ward RJ, Zucca FA, Duyn JH, Crichton RR, Zecca L, 2014. The role of iron in brain ageing and neurodegenerative disorders. Lancet Neurol. 13, 1045–1060. 10.1016/S1474-4422(14)70117-6 [DOI] [PMC free article] [PubMed] [Google Scholar]
- Wasylyshyn C, Verhaeghen P, Sliwinski MJ, 2011. Aging and Task Switching: A Meta-Analysis. Psychol. Aging 26, 15–20. 10.1037/a0020912 [DOI] [PMC free article] [PubMed] [Google Scholar]
- Williams R, Buchheit CL, Berman NEJ, LeVine SM, 2012. Pathogenic implications of iron accumulation in multiple sclerosis. J. Neurochem. 120, 7–25. 10.1111/j.1471-4159.2011.07536.x [DOI] [PMC free article] [PubMed] [Google Scholar]
- Youdim MB, Yehuda S, 2000. The neurochemical basis of cognitive deficits induced by brain iron deficiency: involvement of dopamine-opiate system. Cell. Mol. Biol. Noisy--Gd. Fr. 46, 491–500. [PubMed] [Google Scholar]
- Yu HC, Feng SF, Chao PL, Lin AMY, 2010. Anti-inflammatory effects of pioglitazone on iron-induced oxidative injury in the nigrostriatal dopaminergic system. Neuropathol. Appl. Neurobiol. 36, 612–622. 10.1111/j.1365-2990.2010.01107.x [DOI] [PubMed] [Google Scholar]
- Zecca L, Youdim MBH, Riederer P, Connor JR, Crichton RR, 2004. Iron, brain ageing and neurodegenerative disorders. Nat. Rev. Neurosci. 5, 863–873. 10.1038/nrn1537 [DOI] [PubMed] [Google Scholar]
- Zhang X-Y, Cao J-B, Zhang L-M, Li Y-F, Mi W-D, 2015. Deferoxamine attenuates lipopolysaccharide-induced neuroinflammation and memory impairment in mice. J. Neuroinflammation 12 10.1186/s12974-015-0238-3 [DOI] [PMC free article] [PubMed] [Google Scholar]