

Abstract
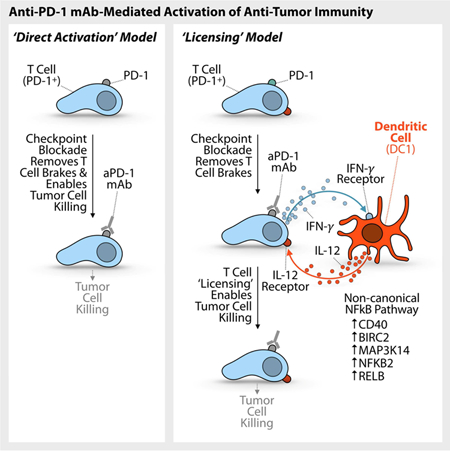
Anti-PD-1 immune checkpoint blockers can induce sustained clinical responses in cancer but how they function in vivo remains incompletely understood. Here, we combined intravital real-time imaging with single cell RNA sequencing analysis and mouse models to uncover anti-PD-1 pharmacodynamics directly within tumors. We showed that effective antitumor responses required a subset of tumor-infiltrating dendritic cells (DCs), which produced interleukin 12 (IL-12). These DCs did not bind anti-PD-1 but produced IL-12 upon sensing interferon γ (IFN-γ) that was released from neighboring T cells. In turn, DC-derived IL-12 stimulated antitumor T cell immunity. These findings suggest that full-fledged activation of antitumor T cells by anti-PD-1 is not direct, but rather involves T cell:DC crosstalk and is licensed by IFN-γ and IL-12. Furthermore, we found that activating the non-canonical NFkB transcription factor pathway amplified IL-12-producing DCs and sensitized tumors to anti-PD-1 treatment, suggesting a therapeutic strategy to improve responses to checkpoint blockade.
eTOC Blurb
Anti-PD-1 mAbs can induce sustained clinical responses in cancer but how they function in vivo remains incompletely understood. Garris et al. show that effective anti-PD-1 immunotherapy requires intratumoral dendritic cells (DCs) producing IL-12. Anti-PD-1 indirectly activates DCs through IFN-γ released from drug-activated T cells. Furthermore, agonizing the non-canonical NFkB pathway activates DCs and enhances aPD-1 therapy in an IL-12-dependent manner.
Graphical Abstract
Introduction
Immune checkpoint blockade has emerged as a critical treatment against various cancer types (Topalian et al., 2012). Currently approved immune checkpoint blockers are monoclonal antibodies that target the cytotoxic T lymphocyte-associated protein 4 (CTLA-4) or programmed cell death protein 1 (PD-1) pathways. These inhibitory pathways are important because they protect the host from uncontrolled immune activation (Keir et al., 2008) but they can also be co-opted by tumors, which make them resist immune attack (Wherry, 2011). For instance, tumor-infiltrating cytotoxic CD8+ T cells often express PD-1 that renders them ineffective against tumors. Consequently, anti-PD-1 (aPD-1) mAbs, or anti-PDL1 mAbs, are designed to antagonize the PD-1 inhibitory pathway in T cells and potentiate CD8+ T cell-mediated tumor destruction.
To date, FDA-approved therapeutics targeting the PD-1-PDL1 signaling axis, in particular aPD-1 mAbs, have proved efficacious in the clinic among immune checkpoint blockade therapies. The ability of these drugs to drive sustained tumor control depends on several variables, including tumor infiltration by CD8+ T cells (Galon et al., 2013; Huang et al., 2017), interferon γ (IFN-γ) production (Schreiber et al., 2011; Ayers et al., 2017), neoantigen abundance (Rizvi et al., 2015), MHC class I expression (Marty et al., 2017; McGranahan et al., 2017), CD28 co-stimulatory signals (Hui et al., 2017; Kamphorst et al., 2017), patient microbiota (Matson et al., 2018; Routy et al., 2018) and antibody composition (Arlauckas et al., 2017; Dahan et al., 2015). However, we still have a limited understanding of how immune checkpoint blockers engage complex tumor microenvironments and which mechanisms define treatment success during the time when tumor rejection occurs.
To address these knowledge gaps, we sought to track key readouts of immunotherapy function in vivo at single cell resolution (Pittet et al., 2018) and during tumor rejection, and decipher how immune-mediated tumor control is achieved. Considering that IFN-γ and interleukin 12 (IL-12) are key immune players in tissue-specific destruction (Galon et al., 2013; Nastala et al., 1994), we used intravital imaging to track these factors within tumors following aPD-1 treatment. Complementing single cell imaging, we also used single cell RNA sequencing (scRNAseq) to provide an unbiased view of immunotherapeutic responses across the tumor immune microenvironment.
These approaches, further combined with manipulations of the IFN-γ and IL-12 pathways in vivo, indicated that aPD-1 drove IL-12 production by a subset of tumor-infiltrating dendritic cells (DCs). Our imaging platform identified that DC activation was indirect (the drug did not detectably bind these cells in vivo) but required DC sensing of IFN-γ, which was produced by aPD-1-activated T cells. In turn, IL-12 produced by DCs licensed effector T cell responses. We further report that the non-canonical nuclear factor kappa-light-chain-enhancer of activated B cells (NFkB) pathway was enriched within IL-12-producing DCs. This pathway was required for response to aPD-1, and agonizing it in a therapeutic setting enhanced IL-12 production by tumor-infiltrating DCs.
Results
Successful aPD-1 treatment triggers endogenous IFN-γ and IL-12 responses within tumors
To image key readouts of immunotherapy function, we assessed IFN-γ and IL-12p40, a protein subunit of IL-12 and IL-23, production using IFN-γ-internal ribosome entry site-yellow fluorescent protein (IFN-γ-IRES-YFP) and IL-12p40-IRES-YFP reporter mice, hereafter referred to as IFN-γ-eYFP and IL-12p40-eYFP, respectively (Figure 1A). Intravital imaging detects YFP, which is expressed by cells that have turned on IFN-γ or IL-12p40 production (Reinhardt et al., 2015; Reinhardt et al., 2006). YFP remains detectable even after cytokine production is turned off, which makes intravital imaging a particularly useful tool to detect the activation of molecules with rapid on/off cycling, such as IFN-γ (Slifka et al., 1999). We tracked IFN-γ and IL-12p40 in vivo during rejection of aPD-1 treatment-sensitive MC38 tumor cells, which were labeled with H2B-mApple. We also tracked macrophages, which were tagged with Pacific-blue-dextran nanoparticles (Weissleder et al., 2014), as these cells are often abundant in tumors (Engblom et al., 2016).
Figure 1. Successful aPD-1 treatment triggers endogenous IFN-γ and IL-12 responses within tumors.
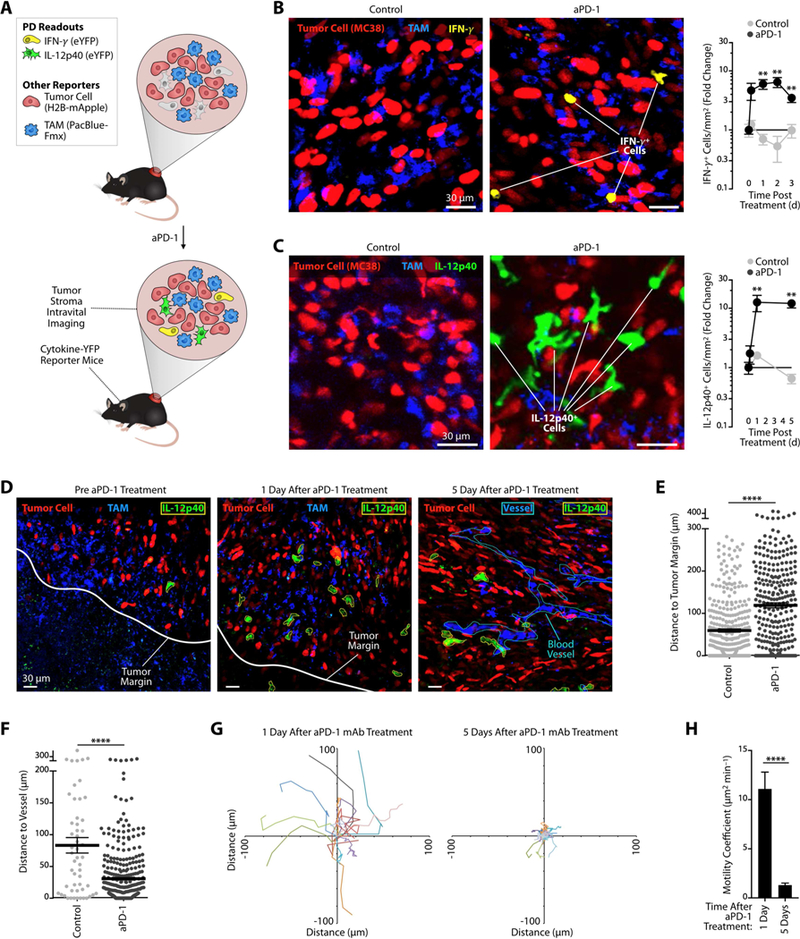
(A) Diagram describing intravital imaging of MC38-H2B-mApple tumors implanted in cytokine-reporter mice for tracking lymphoid and my eloidcell pharmacody namics (PD) after aPD-1 treatment. (B) Left: Intravital micrographs of MC38 tumors in IFN-γ -eYFP reporter mice treated or not with aPD-1 mAb (n = 3 mice/group). Yellow, IFN-γ-eYFP expressing cells; red, tumor cells; blue, PacificBlueFMX-labeled tumor-associated macrophages (TAM). Right: Fold change of IFN-γ + cells in both groups at different times after treatment and compared to baseline. (C) Same as in (B) but in IL-12p40-eYFP reporter mice (n = 5 mice/group). Green, IL-12p40-eYFP expressing cells; red, tumor cells; blue, TAM. (D) Representative intravital micrographs of H2B-mApple MC38 tumor edge or core obtained in IL-12p40 reporter mice before (left), one dayafter (middle) and 5 days after (right) aPD-1 treatment. PacBlue-labeled dextran was used to locate tumor vessels. Tumor cells, red; tumor-associated macrophages (TAM), blue; IL-12+ cells, green with yellow contours; tumor margin, white; blood vessels, cyan. Scale bars represent 30 µm. (E) Distance between IL-12p40+ cells and the tumor margin measured by intravital imaging. Each point represents a single cell (n = 8 control and 5 aPD-1- treated mice). (F) Distance between IL-12p40+ cells and closest tumor vessel measured by intravital imaging. Each point represents a single cell (n = 5 mice/group). (G) In vivo time-lapse microscopy of IL-12p40 reporter mice tracking IL-12+ cell motility after aPD-1 treatment. Track plots represent displacement from origin of IL-12+ cells in the tumor microenvironment. (H) Motility coefficient was calculated for each IL-12+ cell at both time points. n.s. = not significant, ** p < 0.01,**** p < 0.0001. Values represent SEM. Data are representative of at least two independent experiments. For comparisons between two groups, Student’s two-tailed t-test was used. See also Figure S1.
Intravital imaging of the tumor microenvironment revealed a 6.0 ± 1.1 (mean ± SEM) fold expansion of IFN-γ- eYFP+ cells one day after a single aPD-1 injection; this increase was sustained for up to 3 days post treatment (Figure 1B and S1A). IFN-γ-eYFP+ cells accumulated within the tumor stroma and were mostly CD8+ T cells (Figure S1B). Intravital imaging further revealed a 12.1 ± 3.7 fold increase of IL-12p40-eYFP+ cells on day one post treatment, which persisted for at least five days (Figure 1C and S1C). IL-12p40-eYFP+ cells displayed a branched morphology (mean circularity index: 0.54 ± 0.4), suggesting they were DCs. In comparison to the few IL-12+ cells detected before aPD-1 treatment, those present after treatment accumulated in deeper regions of the tumor (Figure 1D, E) and closer to vessels (Figure 1F). The ability for IL-12+ cells to accumulate within tumors was supported by the real-time imaging observation that these cells were motile one day after aPD-1 treatment (motility coefficient: ~10 µm2/min; Figure 1G-H and Supplemental Video 1) and much less so on day five (<1 µm2/min; Figure 1G-H and Supplemental Video 2). These findings indicate that aPD-1 delivery to tumors functionally impacts at least two non-overlapping cell populations, which respond differently to treatment: CD8+ T cells that activate the IFN- γ signaling pathway , and DC-like cells that turn on IL-12 production.
scRNAseq shows DC-restricted IL-12 production
We next sought to further characterize the aPD-1-induced IL-12+ DC-like cells. Flow cytometry analysis confirmed these cells to be MHC class II+ F4/80– (Figure S1D), and parabiosis of tumor-bearing mice indicated that these cells could derive from a blood circulating precursor (Figure S1E). To provide a more comprehensive and unbiased view of immunotherapeutic responses across the tumor immune microenvironment, including all myeloid cell types, we performed scRNAseq analysis on CD45+ cells isolated from untreated (n = 1,154 cells sequenced) or aPD-1-treated (n = 2,941 cells sequenced) tumors. All cells (n = 4,095) were clustered into unbiased cell type classifications using the Seurat single cell analysis R package (Macosko et al., 2015). The cell clusters, visualized with t-stochastic neighbor embedding (t-SNE; Figure 2A and Figure S2A) or force-directed graph layouts (SPRING (Weinreb et al., 2017); Figure S2B), identified the following populations: conventional T (Tconv) cells expressing Cd3e, regulatory T (Treg) cells expressing the transcription factor forkhead box P3 (Foxp3), natural killer (NK) cells expressing natural cytotoxicity triggering receptor 1(Ncr1) and killer cell lectin-like receptor subfamily B member 1c (Klrb1c), neutrophils (Neu) expressing C-X-C motif chemokine receptor 2 (Cxcr2) and G0/G1 switch 2 (G0s2), monocytes (Mo) and macrophages (Mø) expressing colony stimulating factor 1 receptor (Csf1r), and two DC subsets, referred to as DC1 and DC2.
Figure 2. IL-12 is produced by DC1s and is necessary for treatment efficacy.
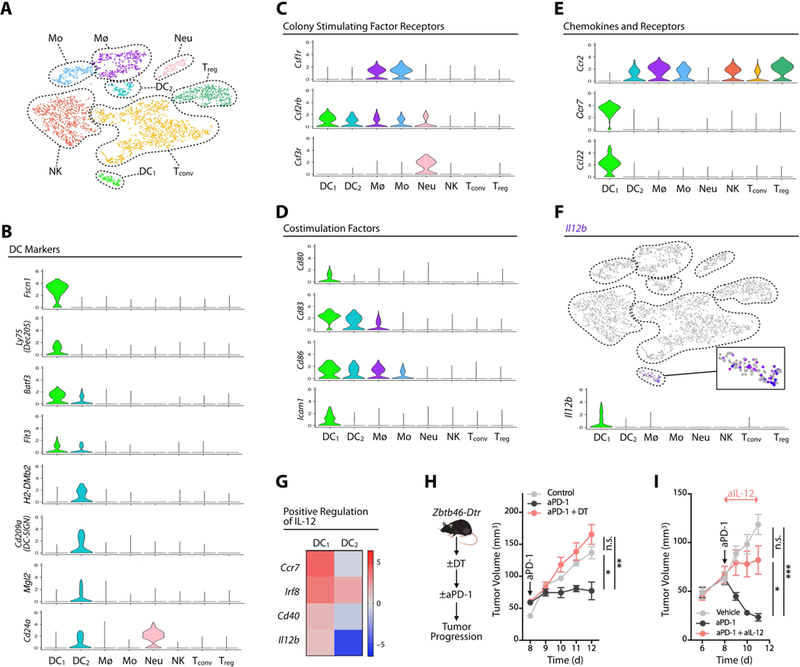
(A) t-SNE plot using scRNAseq data from CD45+ cells sorted from MC38 tumors 3 days after aPD-1 treatment. Untreated mice served as control. Control and aPD-1 samples are pooled. (B-E) Violin plots showing the gene expression probability distribution of various dendritic cell markers (B), colony stimulating factor receptors (C), costimulation factors (D), and chemokine and chemokine receptors (E), in DC1, DC2 and other immune cell clusters (Mø, macrophages; Mo, monocytes; Neu, neutrophils; NK, natural killer cells; Tconv, conventional T cells; Treg, regulatory T cells). (F) Feature plot of Il12b expression across cell clusters identified in A. (G) Expression in DC1 and DC2 of genes associated with IL-12 production. (H) MC38 tumor volumes in Zbtb46-DTR bone marrow chimeras treated or not with diphtheria toxin (DT) to deplete DCs prior to aPD-1 or control treatment. (I) MC38 tumor volume in mice treated with aPD-1 (black), aPD-1 and aIL-12 (red), or vehicle (gray); n = 15 mice/group. Data are representative of at least two independent experiments. Arrows indicate duration of treatment. n.s. = not significant, * p < 0.05, *** p < 0.001. Values represent SEM. For comparisons between three or more groups, One way ANOVA with multiple comparisons was used. See also Figure S2.
Both DC1s and DC2s expressed the DC markers Batf3, Flt3, H2-Dmb2 and Zbtb46 (Meredith et al., 2012; Hildner et al., 2008;); DC1 expressed Fscn1 and Ly 75 (DEC-205) whereas DC2s expressed CD209a (DC- SIGN), Mgl2 (CD301b) and Cd24a (Figure 2B and Figure S2B). Both DC subsets were largely negative for the macrophage colony-stimulating factor receptor Csf1r (Figure 2C), although some DC2s expressed this receptor (Figure S2A), similarly to a subset of intratumoral DCs previously reported (Broz et al., 2014). DC1s had higher expression of the granulocyte/macrophage colony-stimulating factor receptor Csf2rb compared to DC2s, and neither DC1s nor DC2s expressed the granulocyte colony-stimulating factor receptor Csf3r (Figure 2C). Additionally , DC1s were enriched for the T cell co-stimulatory factors Cd80, Cd83, Cd86 and Icam1 (Figure 2D), and DC1s and DC2s expressed distinct chemokines and chemokine receptors (Figure 2E).
IL-12p40 (also known as IL12b) expression was contained exclusively within the DC1 population (Figure 2F). Curating genes defined from gene ontology for positive regulation of IL-12 signaling and synthesis (GO:0045084; GO:0032735), we found that DC1s were enriched in IL-12-related production factors such as Cd40 and Irf8 (Figure 2G). IL-12+ DCs in MC38 tumors did not express Itgae (the gene encoding the integrin CD103) (Figure S2C), although previous studies identified CD103+ DCs as important cells for immune responses to tumors (Salmon et al., 2016; Spranger et al., 2015; Ruffell et al., 2014; Broz et al., 2014). This discrepancy may be due to tissue location, as we found that IL-12+ DCs expressed CD103 in lung tumor models (Figure S2D). scRNAseq analysis confirmed the expansion of IL-12+ DCs after aPD-1 treatment (Figure S2E). Collectively , these data demonstrate a distinct population of IL-12-producing DCs in the tumor microenvironment.
DCs and IL-12 are relevant to aPD-1 therapy
To assess whether DCs are relevant to aPD-1 treatment, we generated Zbtb46-DTR bone marrow chimeras (Meredith et al., 2012), which allowed us to deplete DCs selectively and do so after tumors were established, but before aPD-1 treatment was initiated. Mice lacking DCs failed to reject tumors in response to aPD-1 (Figure 2H), indicating that these cells were required at the time when aPD-1-mediated tumor rejection occurs. To define whether IL-12 contributes to aPD-1 therapeutic efficacy , we studied DC-sufficient MC38 tumor- bearing mice that received aPD-1 in the presence or absence of neutralizing IL-12 mAbs. Mice in which IL-12 was neutralized failed to reject tumors, indicating that IL-12 production following aPD-1 treatment was necessary for achieving tumor control (Figure 2I). Collectively , these data indicate that aPD-1 treatment induces IL-12 production by DCs, and that both DCs and IL-12 critically regulate aPD-1 treatment potency . The results accord with previous findings that tumor-infiltrating DCs can foster T cell immunity (Broz et al., 2014; Salmon et al., 2016) and immunotherapeutic responses (Alloatti et al., 2017), and here we show that DCs assist antitumor responses by providing cytokine support to the tumor immune microenvironment.
IFN-γ sensing by DCs controls IL-12 production
To define how aPD-1 treatment activates DCs, we asked initially whether the antibody binds to these cells directly. Some myeloid cells have been proposed to express PD-1 (Gordon et al., 2017); however, both flow cytometry and scRNAseq analyses indicated that IL-12+ DCs did not express the PD-1 receptor at both transcript (Figure S2A) and protein (Figure 3A) levels. We further tested whether aPD-1 antibodies bind IL- 12+ DCs independently of PD-1. Indeed, aPD-1 mAbs initially accumulate on PD-1+ T cells but can then be gradually taken up by tumor-associated macrophages (TAMs) in a FcγR-dependent manner (Arlauckas et al., 2017). However, IL-12+ DCs did not express detectable levels of FcγR transcripts, in contrast to TAMs (Figure S3A). Also, when tracking the drug’s pharmacokinetics by intravital imaging in MC38 tumor-bearing IL-12- reporter mice, we confirmed aPD-1 accumulation in TAMs but not in IL-12+ DCs 24 hours after aPD-1 administration (Figure 3B and Figure S3B). The DCs also failed to bind aPD-1 early after drug administration, i.e. before uptake by TAMs (Figure S3C). Based on these data we concluded that it was unlikely for aPD-1 to bind and activate IL-12+ DCs directly .
Figure 3. DC-mediated IL-12 production requires IFN-γ sensing.
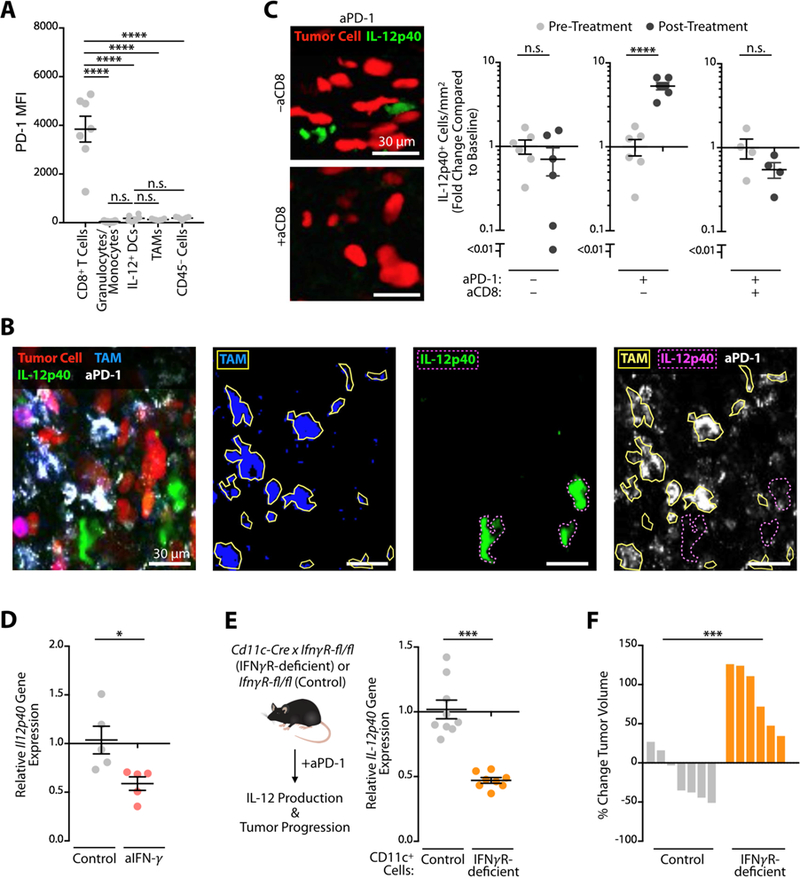
(A) Flow cytometry measurement of PD-1 expression across cell types in the MC38 tumor microenvironment. (B) Intravital micrographs of the MC38 tumor microenvironment in an IL12 reporter mouse five days after AF647-aPD-1 treatment. Tumor cells (red), TAM (blue), IL-12p40 (green), aPD-1 (white). (C) Intravital micrographs and quantification of IL-12p40 signal two days after aPD-1 treatment in the tumor microenvironment after CD8 depletion. Tumor cells (red), IL-12p40 (green). Data plotted as fold change in IL-12p40 from baseline levels. (D) MC38 tumors were harvested at 3 days post- treatment with aPD-1 in combination with aIFN-γ or control, and processed for RNA isolation. Quantitative PCR for IL12p40 gene expression data are normalized with control sample values set to 1. (E) Relative IL-12p40 gene expression in MC38 tumors from CD11c-cre (Itgax-cre) x IFNγ R1fl/fl (IFN.R-deficient) or control (IFNγ R1fl/fl) mice three days after aPD-1 treatment. (F) Change in MC38 tumor volume on day six after aPD-1 treatment in IFN. R-deficient or control mice. Data are relative to pre-treatment tumor volumes. Data are representative of at least two independent experiments. n.s. = not significant, * p < 0.05, ** p < 0.01, *** p < 0.001, **** p < 0.0001. For comparisons between two groups, Student’s two- tailed t-test was used. For comparisons between three or more groups, One way ANOVA with multiple comparisons was used. See also Figure S3.
As aPD-1 mAbs physically bind to tumor-infiltrating CD8+ T cells (Arlauckas et al., 2017), we hypothesized that these cells, once activated by aPD-1, could promote IL-12 production by DCs. To address this possibility , we used intravital imaging to track IL-12 expression in mice depleted of CD8+ T cells prior to administration of aPD-1. Absence of CD8+ T cells abrogated IL-12 production (Figure 3C). We further reasoned that IFN-γ could mediate IL-12 production by DCs, since this cytokine was produced by aPD-1-activated CD8+ T cells (Figure 1B) and can enhance IL-12 responses (Ma et al., 1996). To test this hypothesis, we assessed mice in which IFN-γ was neutralized during aPD-1 treatment. We found that IFN-γ blockade reduced IL-12 production within the tumor microenvironment (Figure 3D). Decreased IL-12 production by DCs (Figure S3D) and decreased numbers of IL-12+ DCs (Figure S3E, F) both contributed to this reduction. Consequently , IFN-γ blockade prevented aPD-1-mediated MC38 tumor control (Figure S3G).
The above results suggest that IFN-γ sensing by DCs fosters IL-12 production and results in tumor control. To test this hypothesis directly , we eliminated DC sensing of IFN-γ by crossing Itgax-cre with Ifngr1fl/fl mice (Lee et al., 2013). Tumors from these mice showed impaired IL-12p40 production (Fig. 3E) and were unresponsive to aPD-1 treatment (Figure 3F), underscoring the importance of IFN-y sensing by DCs, and potentially other CD11c expressing cells, during aPD-1 therapy . Prior studies of Ifngr1-deficient DCs (Nirschl et al., 2017) described down-regulation of genes such as Fscn1, Ccr7, and Icam1, which we identified as IL-12+ DC distinguishers by scRNAseq analysis (Figure 2B, D, E). Together, we find an indirect aPD-1 effect on DCs; this effect was mediated through IFN-γ and is critical for IL-12 induction and, consequently , treatment response.
IL-12 activates tumor-infiltrating lymphocyte effector functions in mice
Our investigations indicated that aPD-1 treatment elicits both IFN-γ and IL-12 responses at the tumor site. By contrast, we did not find evidence of IFN-γ or IL-12 induction by aPD-1 in the local draining lymph node (Figure S4A and B), suggesting that the checkpoint blockade response occurs within tumors. Consistent with this notion, scRNAseq data indicated that aPD-1 treatment triggered the proliferation of tumor-infiltrating CD8+ T cells (Figure S4C). Furthermore, blocking lymphocyte recirculation through treatment with the trafficking inhibitor FTY 720 did not affect the antitumor response to aPD-1 treatment (Figure S4D and E). These data suggest that pre-existing tumor-infiltrating T cells are sufficient for driving the response to aPD-1 at least in this model.
We next examined the downstream effects of IL-12 production within the tumor microenvironment. Initially we used intravital microscopy to assess the effects of recombinant IL-12 administered to tumors in IFN-γ reporter mice (in the absence of aPD-1). We found that intratumoral IL-12 substantially expanded IFN-γ-eYFP+ cells (5.9 ± 0.7 fold increase by day four; Figure 4A). Consistent with previous reports (Nastala et al., 1994), IL-12 administration to MC38 tumors produced robust antitumor responses (Figure 4B). To test further whether IL-12 can activate tumor-infiltrated CD8+ T cells directly , we isolated these cells from MC38 tumors and subjected them to aCD3/CD28 stimulation with or without IL-12. Stimulated CD8+ T cells substantially increased IFN-γ production in the presence of IL-12 (Figure 4C), indicating that tumor-infiltrating T cells can respond to IL-12 directly. The requirement for both T cell co-stimulation and IL-12 to achieve maximal IFN-γ response likely reflected the need of CD28 to rescue exhausted CD8+ T cells, and possibly also the role of PD-1 in limiting CD28-mediated co-stimulation (Kamphorst et al., 2017; Hui et al., 2017).
Figure 4. IL-12 activates TILs directly in mice.
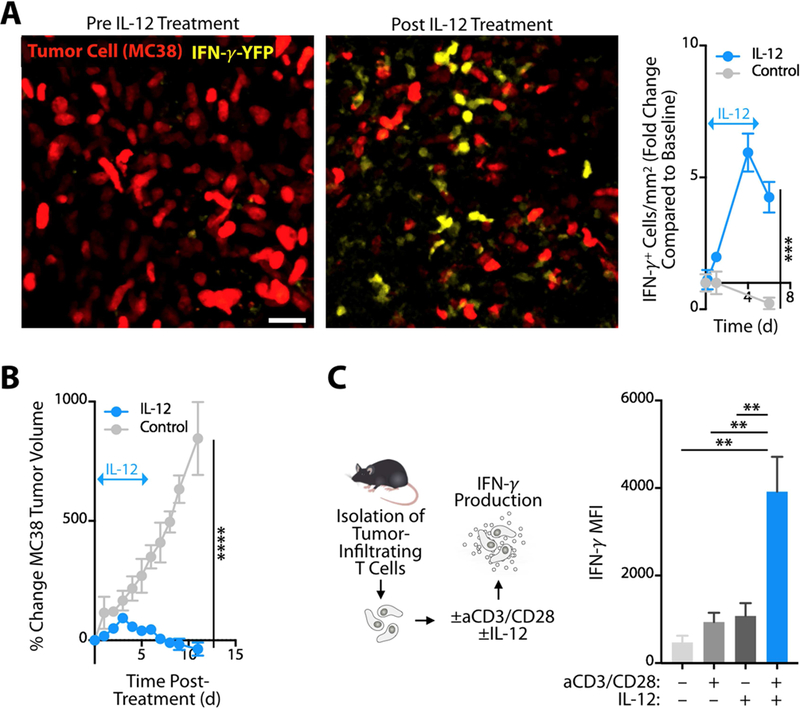
(A) Left: Intravital micrographs of MC38 tumors in IFN-γ-eYFP reporter mice before or four days after treatment with recombinant IL-12. Yellow, IFN-γ-eYFP expressing cells; red, MC38 tumor cells. Right: Fold change of IFN-γ + cells in treated and untreated groups compared to baseline. Arrow indicates duration of IL-12 treatment. (B) MC38 tumor growth monitored after mice bearing established tumors were treated with recombinant IL-12 (blue line) or control (grayline) for 5 days; n ≥ 3 per group. (C) Tumor-infiltrating CD8+ T cells isolated from MC38 tumors, stimulated in vitro with anti- CD3/CD28 and/or IL-12, and assessed by flow cytometry for intracellular IFN-γ production. Data show IFN-γ mean fluorescent intensity (MFI; n = 3 per group). Data are representative of at least two independent experiments. ** p < 0.01, *** p < 0.001, **** p < 0.0001. For comparisons between two groups, Student’s two-tailed t-test was used. For comparisons between three or more groups, One way ANOVA with multiple comparisons was used. See also Figure S4.
IL-12 activates tumor-infiltrating lymphocyte effector functions in cancer patients
We next addressed the downstream effects of IL-12 in cancer patients using two clinical cohorts. First, to assess IL-12’s effects within tumors, we collected skin tumor biopsies from 19 melanoma patients both before and after intratumoral treatment with ImmunoPulse tavokinogene telseplasmid, an electroporation method that delivers plasmid IL-12 directly to tumors (Daud et al., 2008). Comparison of pre- and post-treatment samples revealed that IL-12 delivery enhanced expression of core cytolytic genes (Rooney et al., 2015) within tumors (Figure 5A, B). These genes, namely CD2, CD3E, CD274, GZMA, GZMH, GZMK, NKG7 and PRF1, are associated with immunoediting and antitumor immune responses (Rooney et al., 2015) and tumors enriched with these genes are more likely to respond to aPD-1 immunotherapy (Riaz et al., 2017). Accordingly, we observed a positive association between enhanced cytolytic gene signature and therapeutic response in these patients (Figure 5C). IFNG was not detectably increased in the post-treatment samples, which is expected from the timing of tissue collection and rapid on/off cycling of IFN-γ production by T cells (Slifka et al., 1999). These observations indicated that IL-12 can induce cytolytic activity in human tumors.
Figure 5. IL-12 activates TILs directly in cancer patients.
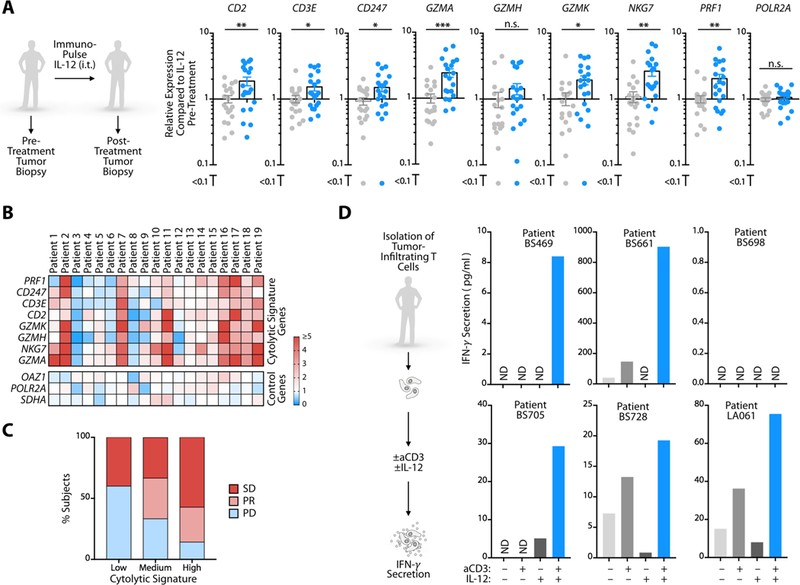
(A) Relative expression levels of cytolytic signature genes measured by Nanostring in skin tumor biopsies from 19 melanoma patients both before (gray dots) and after (blue dots) intratumoral treatment with ImmunoPulse IL-12. Data are normalized to pre-treatment biopsy expression levels; POL2RA is a control gene. (B) Heat map of individual patient gene expression from melanoma biopsies from (A). Cytolytic signature genes are displayed as fold change over pre-treatment levels for each individual patient. OAZ1, POLR2A, and SDHA are control genes. (C) Clinical outcomes data from patients receiving ImmunoPulse treatment. SD, stable disease; PR, partial response; PD, progressive disease. Cytolytic signature was calculated as the sum of total cytolytic gene signature expression from (B). Values were stratified by the top, middle, and bottom third, and then associated to patient response status. (D) IFN-γ production by tumor-infiltrating CD8+ T cells isolated from six cancer patients, stimulated ex vivo with aCD3 and/or IL-12, and measured by ELISA. n.s. = not significant, ND = not detected, * p < 0.05, ** p < 0.01, *** p < 0.001. For comparisons between two groups, Student’s two- tailed t-test was used. See also Figure S5.
To define whether IL-12 can directly activate human tumor-infiltrating CD8+ T cells upon isolation of these cells, we collected fresh tumor tissue from six cancer patients, which included two lung adenocarcinomas (patients BS728 and LA061), three lung squamous cell carcinomas (patients BS469, BS698 and BS705) and one synovial sarcoma (patient BS661). CD8+ T cells were purified from all tumors ex vivo (Figure S5) and subjected to aCD3 stimulation with or without IL-12. The presence of IL-12 increased IFN-γ production by CD8+ T cells in five out of six patients (Figure 5D). Collectively, these patient data recapitulate our observations in mice that IL-12 can directly stimulate tumor-infiltrating T cell antitumor activity. They also support previous evidence that CD8+ T cell activation within tumors is critical to antitumor activity (Broz et al., 2014; Spranger et al., 2014).
Activation of the non-canonical NFkB pathway amplifies IL-12-producing DCs
On account of IL-12’s ability to license antitumor T cell immunity , we further asked whether agonizing IL-12- producing cells could augment response to aPD-1 therapy . We examined the non-canonical NFkB pathway as a therapeutic target, considering its relevance for priming cytotoxic T cells (Katakam et al., 2015; Lind et al., 2008) and because key non-canonical NFkB pathway genes, namely Cd40, Birc2 (Ciap1), Map3k14 (Nik), Nfkb2 (p100) and Relb, were all selectively up-regulated in the IL-12+ tumor-infiltrating DC subset (Figure 6A). We confirmed that IL-12+ cells had more cell surface CD40 than their IL-12– counterparts (Figure S6A) and that IL-12+ DCs expressed more CD40 than tumor-associated macrophages (Figure S6B).
Figure 6. Molecular targeting of the non-canonical NFkB pathway stimulates IL12-producing DCs.
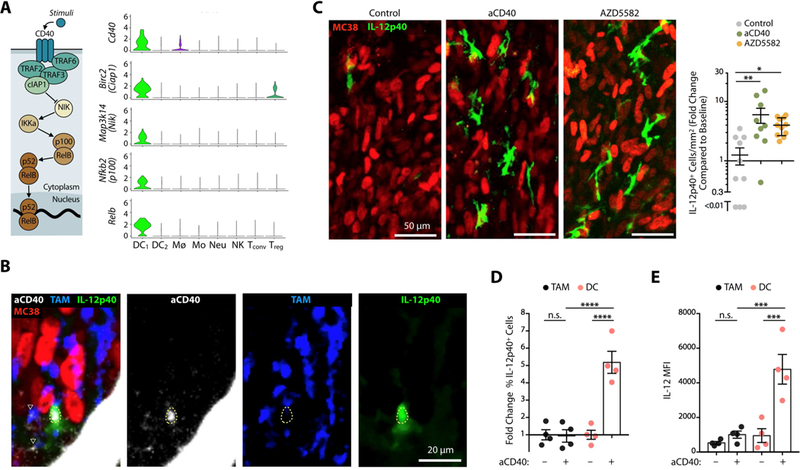
(A) Expression of non-canonical NFkB pathway components (illustrated on the left) across immune populations. (B) Intravital micrographs of a MC38 tumor in an IL-12p40 reporter mouse treated with AF647-aCD40 mAbs. Tumor cells (red), AF647-aCD40 (white), IL-12p40 (green), TAM (blue). Dashed yellow line highlights the location of an IL-12p40+ cell; ▽ show TAM overlay ing with aCD40 mAbs. (C) Left: Intravital micrographs of MC38 tumors in IL-12p40-eΓ FP reporter mice treated with aCD40 or AZD5582. Untreated mice were used as controls. Green, IFN-γ -eYFP expressing cells; red, tumor cells. Right: Fold change of IL-12p40+ cells in each group after 48 hours and compared to baseline. (D-E) Ex vivo flow cytometry analysis of MC38 tumors in IL-12p40 reporter mice treated or not 48 hprior with agonistic aCD40 mAbs. CD45+ F4/80+ TAMs (black) and CD45+ F4/80– CD11chi MHCIIhi DCs (red). (D) Fold change of IL-12p40+ cells normalized to untreated mice (E) MFI of IL-12 reporter signal from TAM or DC. Data are representative of at least two independent experiments. n.s. = not significant, * p < 0.05, ** p < 0.01, *** p < 0.001, **** p < 0.0001, One way ANOVA with multiple comparisons. See also Figure S6.
We sought to activate the non-canonical NFkB pathway in two different ways: with agonistic CD40 mAbs that have previously shown antitumor activity (Beatty et al., 2011; Byrne and Vonderheide, 2016) or with the small molecule inhibitor AZD5582 that targets cellular inhibitor of apoptosis protein (cIAP) 1 and 2 (Hennessy et al., 2013). Agonistic aCD40 mAbs were labeled with a fluorescent dye and tracked by intravital microscopy within tumors of IL-12 reporter mice. This imaging approach not only showed the drug’s ability to interact directly with IL-12+ tumor-infiltrating cells, and some macrophages, in vivo (Figure 6B) but further identified that the treatment induced a 6.6 ± 1.2-fold increase of tumor-infiltrating IL-12+ cells (Figure 6C). Flow cy tometry measurements indicated that IL-12 was produced by DCs but not TAMs (Figure 6D, E). These findings align with previous evidence that aCD40 therapy relies upon Batf3-dependent DCs (Byrne and Vonderheide, 2016), although macrophages can also contribute to aCD40 therapy in some settings, which may be independent of IL-12 (Hoves et al., 2018; Beatty et al., 2011).
CD40, in addition to activating myeloid cells, is also a well-known activator of B cells. Therefore, we tested if B cells were important for aCD40 therapy response. We found that B cell depletion had no effect on aCD40 therapy , suggesting that B cells are not necessary for aCD40 treatment in this experimental model (data not shown).
Treating tumors with the cIAP antagonist AZD5582 induced a 4.0 ± 1.3-fold increase of IL-12+ tumor-infiltrating cells (Figure 6C), similar to the effects observed with agonistic CD40 mAbs. Furthermore, stimulation of Flt3L- derived bone marrow DCs with AZD5582 potently enhanced IL-12 production in vitro (Figure S6C). These results not only confirm previous evidence that CD40 agonism is a stimulatory signal for DCs (Cella et al., 1996; Ngiow et al., 2016) but also indicate that triggering the non-canonical NFkB pathway , through CD40 agonism or cIAP inhibition, can amplify IL-12+ tumor-infiltrating DCs.
Amplification of IL-12+ DCs improves cancer immunotherapy in an IL-12-dependent manner
The antitumor activity of agonistic CD40 mAbs (aCD40) has been shown to depend upon IFN-γ (Byrne and Vonderheide, 2016). We evaluated aCD40 in IFN-γ reporter animals and indeed found that aCD40 treatment potently enhanced intratumoral IFN-γ levels (Figure 7A). The IFN-γ induction by aCD40 likely occurred indirectly as T cells did not express CD40 (Figure 6A). Furthermore, treatment with either agonistic aCD40 mAbs or AZD5582 provided antitumor effects in vivo (Figure 7B). To test the relevance of IL-12 following treatments with aCD40 or AZD5582, we compared their effects in MC38 tumor-bearing mice that were administered or not with IL-12 neutralizing mAbs. These studies showed that IL-12 induction was a primary mechanism for these treatments because tumor control was lost in animals receiving IL-12 neutralizing mAbs (Figure 7B). To further assess the requirement of non-canonical NFkB signaling to aPD-1 treatment efficacy, we compared aPD-1 responses in mice that were reconstituted with either Map3k14 (NIK) deficient or wild-type bone marrow. NIK chimeras failed to respond to aPD-1 (Figure S7A). Taken together, these data linked the non-canonical NFkB pathway to antitumor intratumoral DCs and to aPD-1 treatment efficacy , and indicated that targeting non-canonical NFkB components can be therapeutic in cancer.
Figure 7. Amplification of IL12-producing DCs improves cancer immunotherapy in an IL-12-dependent manner.
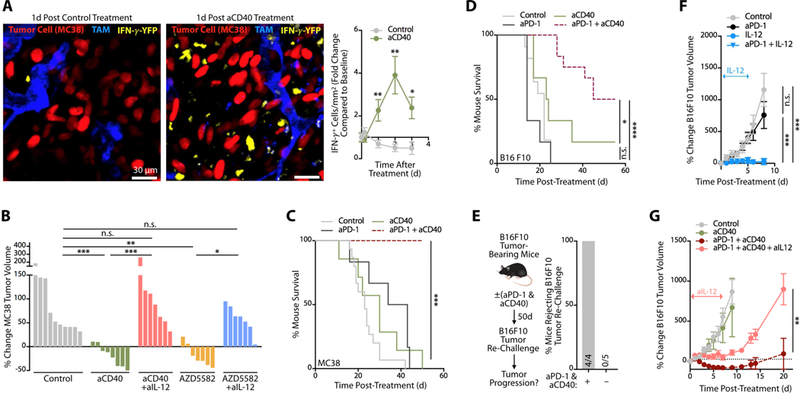
(A) Intravital images of MC38 tumors in IFN-γ reporter mice treated with control mAb (left panel) or agonistic aCD40 mAb (middle panel). Images were recorded one day after treatment. Red, MC38 tumor cells; blue, tumor-associated macrophages (TAM); y ellow, IFN-γ -producing cells. Scale bars represent 30 µm. Longitudinal imaging of control or aCD40-treated mice was used to quantitate the change in density of IFN-γ -expressing cells compared to pre-treatment (right panel). For both mouse cohorts, at least 10 fields of view per time-point were used. (B) MC38 tumor volume change after aCD40 or AZD5582 treatment in MC38 tumor-bearing mice with or without neutralizing IL-12 mAbs (aIL-12). Data are normalized to pre-treatment tumor volumes for individual mice, n = 7–9 mice/group. (C) Survival of MC38 tumor- bearing mice treated with aCD40 (green), aPD-1 (black) or aPD-1 + aCD40 (red). Untreated mice served as controls (grey), n ≥ 6 mice/group. (D) Survival of B16F10 melanoma tumor-bearing mice treated with aCD40 (green), aPD-1 (black) or aPD-1 + aCD40 (red). Untreated mice served as controls (grey ), n = 7–12 mice/group. (E) Mice cured with aPD- 1 + aCD40 (see panel F) were re-challenged ~50 d later with B16F10 melanoma cells. Naive mice challenged at the same time served as positive controls. Data show the percent of mice rejecting B16F10 tumor re-challenge in each group. (F) Change in B16F10 tumor volume following treatment with aPD-1 (black circles), IL-12 (blue circles) or both (blue triangles). Untreated mice served as controls (grey circles), n ≥ 5 mice/group. (G) Change in B16F10 tumor volume following treatment with aCD40 (green line), aPD-1 + aCD40 (red dashed line) or aPD-1 + aCD40 + aIL-12 (pink line). Untreated mice served as controls (grey circles), n ≥ 5 mice/group. Data are representative of at least two independent experiments. n.s. = not significant, * p < 0.05, ** p < 0.01, *** p < 0.001, **** p < 0.0001. For comparisons between two groups, Student’s two-tailed t-test was used. For comparisons between three or more groups, One way ANOVA with multiple comparisons was used. See also Figure S7.
Next we defined whether agonizing IL-12+ cells could augment response to aPD-1 therapy . To this end, we assessed MC38 tumor progression in mice treated with antagonist aPD-1, agonist aCD40 or both. We found that monotherapies incompletely controlled tumor growth, whereas the combination treatment produced a complete, durable response in most animals treated (Figure 7C and Figure S7B and C). Mice that received combination treatment further resisted tumor re-challenge 8 weeks after the primary tumor rejection (Figure S7D); this indicated that the treatment had triggered antitumor memory .
Because the MC38 tumor model responds––though not completely ––to aPD-1 monotherapy , we also tested the B16F10 melanoma model, which resists aPD-1 treatment. We found that combining aPD-1 with aCD40 mAbs controlled B16F10 tumor growth (Figure S7E and F) and resulted in increased mouse survival (Figure 7D), when compared to aPD-1 or aCD40 monotherapies. The combination treatment rejected tumors in 50% (6 of 12) mice; these mice resisted secondary tumor challenge (Figure 7E), indicating that the treatment had also triggered antitumor memory in this model.
Considering that recombinant IL-12 administered to B16F10 melanoma-bearing mice also produced a substantial antitumor effect (Figure 7F), we tested whether the aPD-1+aCD40 therapeutic combination relied upon IL-12 for activity . We administered the combination immunotherapy to B16F10-bearing mice in the presence or absence of IL-12 neutralizing mAbs, and found that blocking IL-12 signaling prevented the combination treatment’s therapeutic activity (Figure 7G and Figure S7G). These data indicate that DC targeting can augment immunotherapy efficacy and sensitize tumors to aPD-1 treatment in an IL-12-dependent manner.
Discussion
We used single cell resolution readouts, including intravital microscopy and scRNAseq, to discover cancer immunotherapy pharmacody namics within tumors and better define in vivo mechanisms of tumor rejection. We found that the antitumor cytokines IFN-γ and IL-12 were mutually induced by immunotherapy and further distinguished direct and indirect mechanisms of activation for these respective cytokines. Principally , we identified that aPD-1 directly induced IFN-γ production by activated T cells, but indirectly induced IL-12 production by a subset of intratumoral DCs. IL-12 production required DC sensing of IFN-γ , and, in turn, licensed effector T cell responses in both mice and cancer patients. We also showed that IL-12-producing DCs were enriched for non-canonical NFkB signaling pathway components, that the critical non-canonical NFkB kinase NIK was required for aPD-1 response, and that agonism of the non-canonical NFkB pathway in a therapeutic setting produced an IL-12-dependent antitumor response. Furthermore, triggering the T cell:DC crosstalk through non-canonical NFkB agonism in combination with aPD1 treatment could potently enhance antitumor immunity . These data support an IL-12-driven “licensing” model of aPD-1 therapy , in which aPD-1 mAb targeting of T cells leads to tumor elimination only after successful crosstalk between these T cells and DCs. We suggest further that responses to immunotherapy can be improved through rational drug combinations that accentuate the crosstalk between lymphoid and myeloid immune compartments.
Real-time in vivo imaging allows one to identify not only primary targets of immunotherapeutics (drug pharmacokinetics) (Arlauckas et al., 2017) but also how the tumor microenvironment responds to treatment (drug pharmacody namics). Consequently , this type of imaging complements the use of gene-deficient mouse models to stud cancer treatments: whereas gene-deficient models can establish the relevance of particular genes in immunotherapy , imaging provides molecular dynamics at single cell and spatial resolutions and over a longitudinal course of therapeutic response. Caveats still exist with this imaging approach however as distribution and effector functions of antibodies may differ between species and antibody compositions. It is also worth noting that the investigations presented in this study used cytokine reporter animals for readout of immune cells’ functional attributes, as opposed to immune cells’ identities. We believe this is important because antitumor immune functions may not necessarily be cell type-dependent, so in theory different cell types can be imaged but the functional readout still remains. For example, in the experimental setups used in this study we found that CD8+ T cells and DCs are the primary producers of IFN-γ and IL-12, respectively; however, under different experimental contexts it is possible that NK cells may also produce IFN-γ and macrophages may also produce IL-12. It should also be noted that the present report focuses on pharmacody namic imaging of aPD-1 and aCD40, although our imaging platform can in principle be used to interrogate any immune drug or other therapeutic agent, and further be expanded to additional functional readouts.
There is increasing support for DCs taking a center stage in checkpoint immunotherapies in cancer. In particular, the cDC1 subtype of DCs, which resembles the DC1 subtype presented here, is adept at cross- presenting antigens (Schlitzer and Ginhoux, 2014) and appears essential for T cell-driven antitumor immunity (Hildner et al., 2008) Interestingly , these DCs may be involved at different stages during the tumor rejection process: besides their critical role for priming T cells in lymph nodes (Martin-Fontecha et al., 2003), recent studies demonstrated that DCs can be found in tumors, where they recruit T cells and stimulate tumor-reactive T cell responses locally (Spranger et al., 2014; de Mingo Pulido et al., 2018). The findings presented here align with the notion that intratumoral DCs can exhibit key antitumor functions and promote aPD-1 immunotherapy. Systemic involvement of immunotherapy responses could also be relevant. For example, in the context of a longer duration of response, it is possible that aPD-1’s antitumor activity is promoted initially by intratumoral DCs and T cells, and later by an additional pool of cells that are recruited from outside the tumor microenvironment (perhaps from the bone marrow or even from tumor-draining lymph nodes).
We found that IL-12+ DCs do not alway s express the marker CD103 (encoded by Itgae), which is often used to define antitumor DCs. It is possible that CD103 is not required for DCs’ antitumor functions and that its expression depends at least in part on the tissue where the DCs reside. In contrast, IL-12 may be both a marker and functional feature of immunostimulatory tumor DCs, based on our findings that i) IL-12+ DCs share many features with cross-presenting DC1 cells, including expression of Batf3, Irf8, Flt3, and Ly 75 (DEC205), and ii) IL-12 is required for immunotherapy efficacy . This notion further accords with prior evidence that cross- presenting tumor DCs have elevated IL-12 expression (Broz et al., 2014; Ruffell et al., 2014). Our data further indicate that IL-12-producing DCs can be generated by circulating precursors, although future studies should aim to precisely determine the ontogeny of these cells.
The findings presented here show that IL-12 cy tokine signals supplied by intratumoral DCs assist antitumor immunity. It will be interesting to further investigate the interactions between IL-12+ DCs, IFN-γ + T cells and immunotherapeutics. For example, considering that DCs can express PD-L1 and that PD-1 is activated upon binding to PDL1, it should be helpful to elucidate the function and fate of PDL1 expressed by intratumoral DCs following aPD(L)1 treatment. Also, since IL-12+ DCs express the highest levels of CD28’s co-stimulatory ligands, CD80 and CD86, it is possible that these ligands contribute to an aPD-(L)1 antitumor response. Furthermore, IL-12 produced by intratumoral DCs may mediate antitumor effects through regulation of transcription factors such as T-bet and Eomes in effector T cells. Indeed, IL-12 may activate T-bet (Joshi et al., 2007; Szabo et al., 2000) and in doing so subvert exhaustion phenotypes (Kao et al., 2011). IL-12 may also repress Eomes (Takemoto et al., 2006), which is a major regulator of T cell exhaustion (Paley et al., 2012). Further study of cells responding to IL-12 could define additional avenues to reverse T cell exhaustion and potentiate antitumor immunity.
By looking at direct versus indirect effects of immunotherapy in the tumor microenvironment we can start to better understand the mechanisms of tumor rejection in vivo, and, by extension, to rationally design combination therapeutic strategies. Here, we initially used the MC38 mouse tumor model because it is sensitive to aPD-1 treatment and thus is relevant to define mechanisms dictating treatment success. Furthermore, recapitulation of IFN-γ /IL-12 positive feedback mechanisms, through combination therapy, enables tumor control in harder-to-treat cancer models. Specifically , our analysis demonstrated that activating the non-canonical NFkB pathway in intratumoral DCs through either CD40 agonism or cIAP inhibition, can potently enhance aPD-1-mediated tumor control.
Treatments combining CD40 agonists with PD-1 pathway inhibitors (NCT03123783, NCT02376699), and cIAP inhibitors with aPD-L1 (NCT03270176), are currently in clinical trials. We suggest that both treatment strategies may rely upon the non-canonical NFkB pathway and DCs. Further, since our studies indicated that non-canonical NFkB-targeting drugs depend upon IL-12 for mediating antitumor activity , we speculate that introduction of IL-12 could potently enhance aPD-1 immunotherapy . Previous attempts to develop IL-12-based therapies for human use had severely toxic consequences (Lasek et al., 2014) likely due to systemic administration routes. However, targeted intratumoral delivery of IL-12 encoding plasmids is safe and has already demonstrated antitumor efficacy as monotherapy (Daud et al., 2008). We suggest that further clinical studies should test whether rationally designed therapeutic strategies that accentuate T cell:DC crosstalk can enforce tumor-eliminating positive feedback mechanisms and expand the proportion of cancers sensitive to immunotherapy .
STAR METHODS
CONTACT FOR REAGENT AND RESOURCE SHARING
Further information and requests for resources or reagents should be directed to the corresponding author and Lead Contact, Mikael J. Pittet (mpittet@mgh.harvard.edu).
EXPERIMENTAL MODEL AND SUBJECT DETAILS
Mice
All animals were bred and housed under specific pathogen free conditions at the Massachusetts General Hospital. Experiments were approved by the MGH Institutional Animal Care and Use Committee (IACUC) and were performed in accordance with MGH IACUC regulations. The following mouse strains were used in this study : Female C57BL6/J mice (8 – 12 week old) were purchased from Jackson Laboratories (Bar Harbor, ME). REAT (IFN- -IRES-eYFP Cat #017581), IL-12p40-IRES-eYFP (Cat #006412), CD11c-cre (Cat #007567), Ifngr1fl/fl (Cat #025394), and Zbtb46-DTR (Cat# 025394) were obtained from Jackson Laboratories.
Human Samples
Fresh tumor specimens were obtained from 6 adult cancer patients undergoing tumor resections at University Hospital Basel, Switzerland. Tissues were used for in vitro re-stimulation and analysis. The study was approved by the local Ethical Review Board (Ethikkommission Nordwestschweiz) and University Hospital Basel, Switzerland. All patients consented in writing to the analysis of their tumor samples.
| Patient | Gender | Health Status | Age |
|---|---|---|---|
| BS-661 | M | Cancer | 55 |
| BS-728 | M | Cancer | 77 |
| LA-061 | N/A | Cancer | 73 |
| BS-705_T | M | Cancer | 74 |
| BS-698_T | F | Cancer | 78 |
| BS-469_T | M | Cancer | 83 |
ImmunoPulse IL-12 treated tumor tissue samples were obtained from 19 melanoma patients from clinical trial NCT01502293. All biopsies were from University of California, San Francisco Medical Center-Mt. Zion, San Francisco, and Huntsman Cancer Institute, Salt Lake City , Utah, and were approved by each organization’s institutional review board.
| Patient | Gender | Disease Status |
Age |
|---|---|---|---|
| 1 | M | Stage III c | 66 |
| 2 | M | Stage III b | 88 |
| 3 | M | Stage IV M1c | 80 |
| 4 | F | Stage III c | 56 |
| 5 | M | Stage IV M1a | 65 |
| 6 | F | Stage III b | 89 |
| 7 | M | Stage IV M1a | 59 |
| 8 | M | Stage III c | 56 |
| 9 | M | Stage III c | 55 |
| 10 | M | Stage IV M1a | 63 |
| 11 | M | Stage IV M1a | 56 |
| 12 | M | Stage IV M1a | 44 |
| 13 | M | Stage IV M1a | 82 |
| 14 | M | Stage IV M1b | 74 |
| 15 | M | Stage IV M1b | 88 |
| 16 | M | Stage IV M1c | 58 |
| 17 | M | Stage III c | 61 |
| 18 | M | Stage III c | 59 |
| 19 | M | Stage III b | 65 |
Tumor Models
MC38 tumor cell lines were obtained from Dr. Mark Smyth (QIMR Berghofer). MC38 cells were implanted at 2 × 10⁶ cells in the flank. B16F10 cell lines were obtained from ATCC. B16F10 cells were implanted intradermally at 0.5 × 10⁶ cells in the flank. All tumor models were allowed to grow for one week prior to therapy . Tumor sizes were approximately 75 mm3 before treatment initiation, and starting tumor volumes were normalized between treatment groups. Percent tumor changes were calculated as percent difference of mouse tumor volume from pre-treatment baseline, measured using digital caliper. Lung seeding B16F10 models received 0.5 × 10⁶ cells intravenously and were allowed to grow for 10 days from the point of implantation. Mouse tumors were allowed to grow to a maximum of 2 cm in diameter, or until tumor ulceration occurred. These were considered as endpoints for survival experiments in accordance with MGH IACUC regulations.
METHOD DETAILS
Immunotherapy Treatment and Cytokine Modulation
Tumor bearing mice, with a tumor size of approximately 75 mm3, were treated with 200 µg of aPD-1 and/or 100 µg of aCD40 intraperitoneally for immunotherapy studies. For combination treatment studies, both aPD-1 and aCD40 were administered at the same time. For IL-12 neutralization studies, mice were dosed with 500 µg of anti-IL-12p40 Clone 17.8 daily for 5–7 days following aPD-1 therapy. Neutralization of IFN-.in vivo was performed by administering 1 mg of anti-IFN- -Clone XMG1.2 initially with 500 µg of anti-IFN- -dosed daily intraperitoneally for days 1–3. The cIAP1/2 inhibitor AZD5582 (Hennessy et al., 2013) was purchased from Selleck Chem and was resuspended in sterile saline. Mice received a single dose of AZD5582 at 10 mg/kg, intraperitoneally . For IL-12 supplementation studies, recombinant IL-12 (1 µg in 100 µL saline) was delivered peritumorally and intraperitoneally , half dose each, for 5 consecutive days when indicated.
Tumor Re-Challenge
Long-term surviving mice from aPD-1 and aCD40 combination therapy were re-challenged with either MC38 or B16F10 tumors at 50 days following primary tumor rejection. MC38 and B16F10 re-challenge doses were 2 × 10⁶ cells and 0.5 × 10⁶ cells respectively in the contralateral flank. Naive C57BL/6J mice were implanted alongside re-challenge mice, and these mice were monitored for tumor growth for 2 weeks following implantation.
Bone Marrow Chimeras
For bone marrow chimera studies, recipient C57BL/6J mice were irradiated (10 Gray dose) in one session, and mice were injected intravenously with 5 × 10⁶ or 3 × 10⁶ whole bone marrow cells from B6(Cg)-Zbtb46tm1(HBEGF)Mnz/J (Zbtb46-DTR) or B6N.129-Map3k14tm1Rds/J (Nik-/-) respectively. Control mice were irradiated and re-constituted with C57BL/6J whole bone marrow (5 × 10⁶ cells). Mice were then left to reconstitute for 8 weeks before tumor growth experiments. Mice receiving diphtheria toxin (DT) (Sigma-Aldrich) were dosed at 10 ng of DT per gram of body weight to initiate depletion and then maintained at 4 ng of DT per gram of body weight every 3 days following initial depletion.
Single Cell RNA Sequencing
MC38 tumors were implanted into the flanks of C57BL6/J mice and allowed to grow for 7 days before immunotherapy treatment. Mice were untreated or aPD-1 treated. Tumors were harvested 3 days after initiation of therapy . Tumors were digested using collagenase II (Worthington) and CD45+ cells were sorted from single cell suspensions using a BD FACSAria sorter. Cells were manually counted with a hemocy tometer and try pan blue viability stain, and 3132 cells from the control treated and 8178 cells from the aPD-1 treated tumors were recovered directly in PBS with 0.04% BSA (400 µg/ml) without centrifugation and kept on ice. Live cells were single cell sorted into GEMS (Gel Bead in EMulsion) using the 10X Genomics Chromium system provided by the HMS Biopolymers core. GEMS were processed and libraries were prepared according to the Chromium Single Cell 3’ Reagent Kit v2 User guide (10X Genomics). Library QC was done by the HMS Biopolymers core and the libraries were sequenced on an Illlumina NextSeq at an average of 29,000 reads per cell. In total, 4095 cells (1154 untreated and 2941 aPD-1 treated cells) passed QC and were sequenced. 10X Cell Ranger 2.1.0 software was used for generation of fastq files and gene-barcode matrices. Loupe Cell Browser 2.0.0 and the Seurat R package (Satija et al., 2015) and SPRING (Weinreb et al., 2017) were used for clustering and analysis.
Parabiosis
CD45.3 and B6.129-Il12btm1Lky /J (IL-12 reporter) mice were placed under anesthesia (2% isoflurane) shaved on their sides and elbows and knees were stitched together with a black monofilament nylon suture (Ethicon). Animals were provided with buprenorphine as an analgesic for 3 days following surgery . After a 3 week recovery period, both mice from the parabiotic pair were challenged with MC38 tumors on the outer flank. Tumors were allowed to grow for 7 days before treatment with aPD-1 immunotherapy , and tumors were harvested 2 days following immunotherapy to analyze IL-12 dendritic cell populations by flow cytometry .
FTY 720 Treatments
Mice were implanted with MC38 tumors in the flank and cohorts of mice were sorted into groups of similar tumor size before treatment initiation. Tumors were allowed to grow for 7 days before treatments. Mice were treated or not with 1.25 mg/kg of FTY 720 (Cayman Chemical) i.p. 2 hours before aPD-1 treatment, and were maintained daily on 1.25 mg/kg FTY 720 throughout the duration of the experiment. Blood from mice was used to confirm lymphocyte trafficking defects.
Flow Cytometry - Mouse
Tumor tissue or tumor draining lymph nodes were isolated from mice and minced using surgical scissors. Tissues were then digested using 0.2 mg/ml Collagenase II (Worthington) in RPMI 1640 media (CellGro) at 37ºC for 30 minutes and then strained through a 40 µm filter (BD Falcon). Cell suspensions were incubated with Fc Block TruStain FcX Clone 93 (Biolegend) in PBS containing 0.5% BSA and 2 mM EDTA before staining with fluorochrome labeled antibodies. Antibodies against CD11b (M1/70, Biolegend), CD8a (53–6.7, Biolegend), CD45 (30-F11, BD), F4/80 (BM8, Biolegend), CD11c (N418, Biolegend), MHC II I-A/I-E (M5/114.15.2, Biolegend), CD103 (2E7, Biolegend), IFN-
ERROR: undefinedresource
OFFENDING COMMAND: findresource
STACK:
/ADBCFF+STIXGeneral
/CIDFont
/ADBCFF+STIXGeneral [0 −1000 250 0 ]
1
Supplementary Material
Highlights.
Effective anti-PD-1 anti-tumor responses require IL-12-producing dendritic cells
Anti-PD-1 indirectly activates IL-12 through IFN-γ produced from CD8+ T cells
Agonizing the non-canonical NFkB pathway enhances dendritic cell IL-12 production
Combining aPD-1 with non-canonical NFkB agonism enhances checkpoint immunotherapy
Acknowledgements
We thank S. Agarwala, K. Lewis and S. Bhatia for contributing to the ImmunoPulse IL-12 studies; K. King, A. Klein, and C. Weinreb for assistance with single cell analysis; S. He and C. Chan for help with bone marrow chimera experiments; the Harvard Biopoly mers Core for help with single cell library generation. This work was supported in part by the Samana Cay MGH Research Scholar Fund, the Robert Wenner Award from the Swiss Cancer League and NIH grants R01-AI084880, R01-CA218579, and R01-AI123349 (to M.J.P.), NIH grant R01-CA206890 (to M.J.P. and R.W.); NIH grants R33-CA202064 and U01CA206997 (to R.W.), NIH grant P01 AI056299 and P50CA101942 (to G.J.F) and Swiss National Cancer Foundation grant 320030_162575 (to A.Z). CSG was supported by NIH grant F31-CA196035; SPA and SG were supported by NIH grant T32-CA79443, C.Pf was supported by the MGH ECOR Tosteson Postdoctoral Fellowship.
M.J.P. has served as a consultant for Baxalta, Deciphera Pharmaceuticals, FORMA Therapeutics, Incyte Pharmaceuticals, Jounce Therapeutics, KSQ Therapeutics, Secarna, Siamab, and Syndax; these commercial relationships are unrelated to the current study . G.J.F. has patents/pending royalties on the PD-1 pathway from Roche, Merck, BMS, EMD-Serono, Boehringer-Ingelheim, AstraZeneca, Dako, and Novartis, he has also served on advisory boards for Roche, BMS, Xios, and Origimed. S.E.W. and S.O. are employees and stockholders in NanoString Technologies. E.B. and C.G.T. are employees and shareholders of OncoSec Inc. R.H.P., M.H.L., and A.P.A. have stock options in OncoSec Inc. A.P.A. has served as a consultant for OncoSec Inc and Valitor Bio, and has research funding from Merck, BMS, AstraZeneca, MedImmune, Acerta, Incyte, Genentech, Idera, Dynavax, Tessa, Plexxicon, Checkmate, Regeneron, Novartis, and Amgen. A.D.I. has consulted for OncoSec Inc, Merck, and BMS. A.Z. has received research funding from Roche. R.W. is a cofounder of T2 Biosystems, Lumicell, Accure Health, VisEn Medical (acquired by Perkin Elmer), and advises Moderna, Alivio Therapeutics, Tarveda Therapeutics, and BioAnalytix; these relationships are unrelated to the current study.
Footnotes
Publisher's Disclaimer: This is a PDF file of an unedited manuscript that has been accepted for publication. As a service to our customers we are providing this early version of the manuscript. The manuscript will undergo copyediting, typesetting, and review of the resulting proof before it is published in its final citable form. Please note that during the production process errors may be discovered which could affect the content, and all legal disclaimers that apply to the journal pertain.
Declaration of Interests
References
- Alloatti A, Rookhuizen DC, Joannas L, Carpier JM, Iborra S, Magalhaes JG, Yatim N, Kozik P, Sancho D, Albert ML et al. (2017). Critical role for Sec22b-dependent antigen cross-presentation in antitumor immunity. J Exp Med 214, 2231–2241. [DOI] [PMC free article] [PubMed] [Google Scholar]
- Arlauckas SP, Garris CS, Kohler RH, Kitaoka M, Cuccarese MF, Yang KS, Miller MA, Carlson JC, Freeman GJ, Anthony RM et al. (2017). In vivo imaging reveals a tumor-associated macrophage-mediated resistance pathway in anti-PD-1 therapy. Sci Transl Med 9, eaal3604. [DOI] [PMC free article] [PubMed] [Google Scholar]
- Ayers M, Lunceford J, Nebozhyn M, Murphy E, Loboda A, Kaufman DR, Albright A, Cheng JD, Kang SP, Shankaran V et al. (2017). IFN-γ-related mRNA profile predicts clinical response to PD-1 blockade. J Clin Invest 127, 2930–2940. [DOI] [PMC free article] [PubMed] [Google Scholar]
- Beatty GL, Chiorean EG, Fishman MP, Saboury B, Teitelbaum UR, Sun W, Huhn RD, Song W, Li D, Sharp LL et al. (2011). CD40 agonists alter tumor stroma and show efficacy against pancreatic carcinoma in mice and humans. Science 331, 1612–1616. [DOI] [PMC free article] [PubMed] [Google Scholar]
- Broz ML, Binnewies M, Boldajipour B, Nelson AE, Pollack JL, Erle DJ, Barczak A, Rosenblum MD, Daud A, Barber DL et al. (2014). Dissecting the tumor myeloid compartment reveals rare activating antigen-presenting cells critical for T cell immunity. Cancer Cell 26, 638–652. [DOI] [PMC free article] [PubMed] [Google Scholar]
- Byrne KT, and Vonderheide RH (2016). CD40 stimulation obviates innate sensors and drives T cell immunity in cancer. Cell reports 15, 2719–2732. [DOI] [PMC free article] [PubMed] [Google Scholar]
- Cella M, Scheidegger D, Palmer-Lehmann K, Lane P, Lanzavecchia A, and Alber G (1996). Ligation of CD40 on dendritic cells triggers production of high levels of interleukin-12 and enhances T cell stimulatory capacity : T-T help via APC activation. J Exp Med 184, 747–752. [DOI] [PMC free article] [PubMed] [Google Scholar]
- Dahan R, Sega E, Engelhardt J, Selby M, Korman AJ, and Ravetch JV (2015). FcyRs Modulate the Anti-tumor Activity of Antibodies Targeting the PD-1/PD-L1 Axis. Cancer Cell 28, 285–295. [DOI] [PubMed] [Google Scholar]
- Daud AI, DeConti RC, Andrews S, Urbas P, Riker AI, Sondak VK, Munster PN, Sullivan DM, Ugen KE, Messina JL et al. (2008). Phase I trial of interleukin-12 plasmid electroporation in patients with metastatic melanoma. J Clin Oncol 26, 5896–5903. [DOI] [PMC free article] [PubMed] [Google Scholar]
- de Mingo Pulido Á, Gardner A, Hiebler S, Soliman H, Rugo HS, Krummel MF, Coussens LM, and Ruffell B (2018). TIM-3 Regulates CD103+ Dendritic Cell Function and Response to Chemotherapy in Breast Cancer. Cancer cell 33, 60–74. e6. [DOI] [PMC free article] [PubMed] [Google Scholar]
- Engblom C, Pfirschke C, and Pittet MJ (2016). The role of myeloid cells in cancer therapies. Nat Rev Cancer 16, 447–462. [DOI] [PubMed] [Google Scholar]
- Galon J, Angell HK, Bedognetti D, and Marincola FM (2013). The continuum of cancer immunosurveillance: prognostic, predictive, and mechanistic signatures. Immunity 39, 11–26. [DOI] [PubMed] [Google Scholar]
- Gordon SR, Maute RL, Dulken BW, Hutter G, George BM, McCracken MN, Gupta R, Tsai JM, Sinha R, Corey D et al. (2017). PD-1 expression by tumour-associated macrophages inhibits phagocytosis and tumour immunity. Nature 545, 495–499. [DOI] [PMC free article] [PubMed] [Google Scholar]
- Hennessty EJ, Adam A, Aquila BM, Castriotta LM, Cook D, Hattersley M, Hird AW, Huntington C, Kamhi VM, Laing NM et al. (2013). Discovery of a novel class of dimeric Smac mimetics as potent IAP antagonists resulting in a clinical candidate for the treatment of cancer (AZD5582). J Med Chem 56, 9897–9919. [DOI] [PubMed] [Google Scholar]
- Hildner K, Edelson BT, Purtha WE, Diamond M, Matsushita H, Kohyama M, Calderon B, Schraml BU, Unanue ER, Diamond MS et al. (2008). Batf3 deficiency reveals a critical role for CD8alpha+ dendritic cells in cytotoxic T cell immunity. Science 322, 1097–1100. [DOI] [PMC free article] [PubMed] [Google Scholar]
- Hoves S, Ooi C-H, Wolter C, Sade H, Bissinger S, Schmittnaegel M, Ast O, Giusti AM, Wartha K, and Runza V (2018). Rapid activation of tumor-associated macrophages boosts preexisting tumor immunity. Journal of Experimental Medicine jem 20171440. [DOI] [PMC free article] [PubMed]
- Huang AC, Postow MA, Orlowski RJ, Mick R, Bengsch B, Manne S, Xu W, Harmon S, Giles JR, Wenz B et al. (2017). T-cell invigoration to tumour burden ratio associated with anti-PD-1 response. Nature 545, 60–65. [DOI] [PMC free article] [PubMed] [Google Scholar]
- Hui E, Cheung J, Zhu J, Su X, Taylor MJ, Wallweber HA, Sasmal DK, Huang J, Kim JM, Mellman I et al. (2017). T cell costimulatory receptor CD28 is a primary target for PD-1-mediated inhibition. Science 355, 1428–1433. [DOI] [PMC free article] [PubMed] [Google Scholar]
- Joshi NS, Cui W, Chandele A, Lee HK, Urso DR, Hagman J, Gapin L, and Kaech SM (2007). Inflammation directs memory precursor and short-lived effector CD8(+) T cell fates via the graded expression of T-bet transcription factor. Immunity 27, 281–295. [DOI] [PMC free article] [PubMed] [Google Scholar]
- Kamphorst AO, Wieland A, Nasti T, Yang S, Zhang R, Barber DL, Konieczny BT, Daugherty CZ, Koenig L, and Yu K (2017). Rescue of exhausted CD8 T cells by PD-1–targeted therapies is CD28-dependent. Science 355, 1423–1427. [DOI] [PMC free article] [PubMed] [Google Scholar]
- Kao C, Oestreich KJ, Pale MA, Crawford A, Angelosanto JM, Ali MA, Intlekofer AM, Boss JM, Reiner SL, Weinmann AS et al. (2011). Transcription factor T-bet represses expression of the inhibitory receptor PD-1 and sustains virus-specific CD8+ T cell responses during chronic infection. Nat Immunol 12, 663–671. [DOI] [PMC free article] [PubMed] [Google Scholar]
- Katakam AK, Brightbill H, Franci C, Kung C, Nunez V, Jones C, Peng I, Jeet S, Wu LC, and Mellman I (2015). Dendritic cells require NIK for CD40-dependent cross-priming of CD8+ T cells. Proceedings of the National Academy of Sciences 112, 14664–14669. [DOI] [PMC free article] [PubMed] [Google Scholar]
- Keir ME, Butte MJ, Freeman GJ, and Sharpe AH (2008). PD-1 and its ligands in tolerance and immunity. Annu. Rev. Immunol 26, 677–704. [DOI] [PMC free article] [PubMed] [Google Scholar]
- Lasek W, Zagożdżon R, and Jakobisiak M (2014). Interleukin 12: still a promising candidate for tumor immunotherapy. Cancer Immunol Immunother 63, 419–435. [DOI] [PMC free article] [PubMed] [Google Scholar]
- Lee SH, Carrero JA, Uppaluri R, White JM, Archambault JM, Lai KS, Chan SR, Sheehan KC, Unanue ER, and Schreiber RD (2013). Identifying the initiating events of anti-Listeria responses using mice with conditional loss of IFN-γ receptor subunit 1 (IFNGR1). J Immunol 191, 4223–4234. [DOI] [PMC free article] [PubMed] [Google Scholar]
- Lind EF, Ahonen CL, Wasiuk A, Kosaka Y, Becher B, Bennett KA, and Noelle RJ (2008). Dendritic cells require the NF-κB2 pathway for cross-presentation of soluble antigens. The Journal of Immunology 181, 354–363. [DOI] [PubMed] [Google Scholar]
- Ma X, Chow JM, Gri G, Carra G, Gerosa F, Wolf SF, Dzialo R, and Trinchieri G (1996). The interleukin 12 p40 gene promoter is primed by interferon gamma in monocytic cells. J Exp Med 183, 147–157. [DOI] [PMC free article] [PubMed] [Google Scholar]
- Macosko EZ, Basu A, Satija R, Nemesh J, Shekhar K, Goldman M, Tirosh I, Bialas AR, Kamitaki N, Martersteck EM et al. (2015). Highly Parallel Genome-wide Expression Profiling of Individual Cells Using Nanoliter Droplets. Cell 161, 1202–1214. [DOI] [PMC free article] [PubMed] [Google Scholar]
- Martin-Fontecha A, Sebastiani S, Höpken UE, Uguccioni M, Lipp M, Lanzavecchia A, and Sallusto F (2003). Regulation of dendritic cell migration to the draining lymph node: impact on T lymphocyte traffic and priming. J Exp Med 198, 615–621. [DOI] [PMC free article] [PubMed] [Google Scholar]
- Marty R, Kaabinejadian S, Rossell D, Slifker MJ, van de Haar J, Engin HB, de Prisco N, Ideker T, Hildebrand WH, Font-Burgada J et al. (2017). MHC-I Genotype Restricts the Oncogenic Mutational Landscape. Cell 171, 1272–1283.e15. [DOI] [PMC free article] [PubMed] [Google Scholar]
- Matson V, Fessler J, Bao R, Chongsuwat T, Zha Y, Alegre ML, Luke JJ, and Gajewski TF (2018). The commensal microbiome is associated with anti-PD-1 efficacy in metastatic melanoma patients. Science 359, 104–108. [DOI] [PMC free article] [PubMed] [Google Scholar]
- McGranahan N, Rosenthal R, Hiley CT, Rowan AJ, Watkins TBK, Wilson GA, Birkbak NJ, Veeriah S, Van Loo P, Herrero J et al. (2017). Allele-Specific HLA Loss and Immune Escape in Lung Cancer Evolution. Cell 171, 1259–1271.e11. [DOI] [PMC free article] [PubMed] [Google Scholar]
- Meredith MM, Liu K, Darrasse-Jeze G, Kamphorst AO, Schreiber HA, Guermonprez P, Idoyaga J, Cheong C, Yao KH, Niec RE et al. (2012). Expression of the zinc finger transcription factor zDC (Zbtb46, Btbd4) defines the classical dendritic cell lineage. J Exp Med 209, 1153–1165. [DOI] [PMC free article] [PubMed] [Google Scholar]
- Nastala CL, Edington HD, McKinney TG, Tahara H, Nalesnik MA, Brunda MJ, Gately MK, Wolf SF, Schreiber RD, and Storkus WJ (1994). Recombinant IL-12 administration induces tumor regression in association with IFN-gamma production. J Immunol 153, 1697–1706. [PubMed] [Google Scholar]
- Ngiow SF, Young A, Blake SJ, Hill GR, Yagita H, Teng MW, Korman AJ, and Smyth MJ (2016). Agonistic CD40 mAb-Driven IL12 Reverses Resistance to Anti-PD1 in a T-cell-Rich Tumor. Cancer Res 76, 6266–6277. [DOI] [PubMed] [Google Scholar]
- Nirschl CJ, Suárez-Fariñas M, Izar B, Prakadan S, Dannenfelser R, Tirosh I, Liu Y, Zhu Q, Devi KSP, Carroll SL et al. (2017). IFNγ-Dependent Tissue-Immune Homeostasis Is Co-opted in the Tumor Microenvironment. Cell 170, 127–141.e15. [DOI] [PMC free article] [PubMed] [Google Scholar]
- Paley MA, Kroy DC, Odorizzi PM, Johnnidis JB, Dolfi DV, Barnett BE, Bikoff EK, Robertson EJ, Lauer GM, Reiner SL et al. (2012). Progenitor and terminal subsets of CD8+ T cells cooperate to contain chronic viral infection. Science 338, 1220–1225. [DOI] [PMC free article] [PubMed] [Google Scholar]
- Pittet MJ, Garris CS, Arlauckas SP, and Weissleder R (2018). Recording the wild lives of immune cells. Sci Immunol 3, eaaq0491. [DOI] [PMC free article] [PubMed] [Google Scholar]
- Reinhardt RL, Liang H-E, Bao K, Price AE, Mohrs M, Kelly BL, and Locksley RM (2015). A novel model for IFN-γ–mediated autoinflammatory syndromes. The Journal of Immunology 194, 2358–2368. [DOI] [PMC free article] [PubMed] [Google Scholar]
- Reinhardt RL, Hong S, Kang S-J, Wang Z.-e., and Locksley RM (2006). Visualization of IL-12/23p40 In Vivo Reveals Immunostimulatory Dendritic Cell Migrants that Promote Th1 Differentiation. The Journal of Immunology 177, 1618–1627. [DOI] [PubMed] [Google Scholar]
- Riaz N, Havel JJ, Makarov V, Desrichard A, Urba WJ, Sims JS, Hodi FS, Martín-Algarra S, Mandal R, and Sharfman WH (2017). Tumor and microenvironment evolution during immunotherapy with nivolumab. Cell 171, 934–949. e15. [DOI] [PMC free article] [PubMed] [Google Scholar]
- Rizvi NA, Hellmann MD, Snyder A, Kvistborg P, Makarov V, Havel JJ, Lee W, Yuan J, Wong P, Ho TS et al. (2015). Cancer immunology . Mutational landscape determines sensitivity to PD-1 blockade in non-small cell lung cancer. Science 348, 124–128. [DOI] [PMC free article] [PubMed] [Google Scholar]
- Rooney MS, Shukla SA, Wu CJ, Getz G, and Hacohen N (2015). Molecular and genetic properties of tumors associated with local immune cytolytic activity. Cell 160, 48–61. [DOI] [PMC free article] [PubMed] [Google Scholar]
- Routy B, Le Chatelier E, Derosa L, Duong CPM, Alou MT, Daillère R, Fluckiger A, Messaoudene M, Rauber C, Roberti MP et al. (2018). Gut microbiome influences efficacy of PD-1-based immunotherapy against epithelial tumors. Science 359, 91–97. [DOI] [PubMed] [Google Scholar]
- Ruffell B, Chang-Strachan D, Chan V, Rosenbusch A, Ho CM, Pryer N, Daniel D, Hwang ES, Rugo HS, and Coussens LM (2014). Macrophage IL-10 blocks CD8+ T cell-dependent responses to chemotherapy by suppressing IL- 12 expression in intratumoral dendritic cells. Cancer Cell 26, 623–637. [DOI] [PMC free article] [PubMed] [Google Scholar]
- Salmon H, Idoyaga J, Rahman A, Leboeuf M, Remark R, Jordan S, Casanova-Acebes M, Khudoy nazarova M, Agudo J, Tung N et al. (2016). Expansion and Activation of CD103(+) Dendritic Cell Progenitors at the Tumor Site Enhances Tumor Responses to Therapeutic PD-L1 and BRAF Inhibition. Immunity 44, 924–938. [DOI] [PMC free article] [PubMed] [Google Scholar]
- Satija R, Farrell JA, Gennert D, Schier AF, and Regev A (2015). Spatial reconstruction of single-cell gene expression data. Nat Biotechnol 33, 495–502. [DOI] [PMC free article] [PubMed] [Google Scholar]
- Schlitzer A, and Ginhoux F (2014). Organization of the mouse and human DC network. Curr Opin Immunol 26, 90–99. [DOI] [PubMed] [Google Scholar]
- Schreiber RD, Old LJ, and Smyth MJ (2011). Cancer immunoediting: integrating immunity ‘s roles in cancer suppression and promotion. Science 331, 1565–1570. [DOI] [PubMed] [Google Scholar]
- Slifka MK, Rodriguez F, and Whitton JL (1999). Rapid on/off cycling of cytokine production b virus-specific CD8+ T cells. Nature 401, 76–79. [DOI] [PubMed] [Google Scholar]
- Spranger S, Bao R, and Gajewski TF (2015). Melanoma-intrinsic β-catenin signalling prevents anti-tumour immunity. Nature 523, 231–235. [DOI] [PubMed] [Google Scholar]
- Spranger S, Koblish HK, Horton B, Scherle PA, Newton R, and Gajewski TF (2014). Mechanism of tumor rejection with doublets of CTLA-4, PD-1/PD-L1, or IDO blockade involves restored IL-2 production and proliferation of CD8+ T cells directly within the tumor microenvironment. Journal for immunotherapy of cancer 2, 1–14. [DOI] [PMC free article] [PubMed] [Google Scholar]
- Szabo SJ, Kim ST, Costa GL, Zhang X, Fathman CG, and Glimcher LH (2000). A novel transcription factor, T- bet, directs Th1 lineage commitment. Cell 100, 655–669. [DOI] [PubMed] [Google Scholar]
- Takemoto N, Intlekofer AM, Northrup JT, Wherry EJ, and Reiner SL (2006). Cutting Edge: IL-12 inversely regulates T-bet and eomesodermin expression during pathogen-induced CD8+ T cell differentiation. J Immunol 177, 7515–7519. [DOI] [PubMed] [Google Scholar]
- Thurber GM, Y ang KS, Reiner T, Kohler RH, Sorger P, Mitchison T, and Weissleder R (2013). Single-cell and subcellular pharmacokinetic imaging allows insight into drug action in vivo. Nat Commun 4, 1504 1–10. [DOI] [PMC free article] [PubMed] [Google Scholar]
- Topalian SL, Hodi FS, Brahmer JR, Gettinger SN, Smith DC, McDermott DF, Powderly JD, Carvajal RD, Sosman JA, and Atkins MB (2012). Safety , activity , and immune correlates of anti–PD-1 antibody in cancer. New England Journal of Medicine 366, 2443–2454. [DOI] [PMC free article] [PubMed] [Google Scholar]
- Weinreb C, Wolock S, and Klein A (2017). SPRING: a kinetic interface for visualizing high dimensional single-cell expression data. Bioinformatics 34, 1246–1248. [DOI] [PMC free article] [PubMed] [Google Scholar]
- Weissleder R, Nahrendorf M, and Pittet MJ (2014). Imaging macrophages with nanoparticles. Nat Mater 13, 125–138. [DOI] [PubMed] [Google Scholar]
- Wherry EJ (2011). T cell exhaustion. Nature Immunology 12, 492–499. [DOI] [PubMed] [Google Scholar]
- Yan J, Smyth MJ, and Teng MWL (2017). Interleukin (IL)-12 and IL-23 and Their Conflicting Roles in Cancer. Cold Spring Harb Perspect Biol 10, 7 1.-. [DOI] [PMC free article] [PubMed] [Google Scholar]
Associated Data
This section collects any data citations, data availability statements, or supplementary materials included in this article.