

Abstract
Growing evidence links household air pollution exposure from biomass cookstoves with elevated blood pressure. We assessed cross-sectional associations of 24-hour mean concentrations of personal and kitchen fine particulate matter (PM2.5), black carbon (BC), and stove type with blood pressure, adjusting for confounders, among 147 women using traditional or cleaner-burning Justa stoves in Honduras. We investigated effect modification by age and body mass index. Traditional stove users had mean (standard deviation) personal and kitchen 24-hour PM2.5 concentrations of 126 μg/m3 (77) and 360 μg/m3 (374), while Justa stove users’ exposures were 66 μg/m3 (38) and 137 μg/m3 (194), respectively. BC concentrations were similarly lower among Justa stove users. Adjusted mean systolic blood pressure was 2.5 mmHg higher (95% CI, 0.7 to 4.3) per unit increase in natural log transformed kitchen PM2.5 concentration; results were stronger among women 40 years or older (5.2 mmHg increase, 95% CI, 2.3 to 8.1). Adjusted odds of borderline high and high blood pressure (categorized) were also elevated (odds ratio=1.5, 95% CI, 1.0 to 2.3). Some results included null values and are suggestive. Results suggest that reduced household air pollution, even when concentrations exceed air quality guidelines, may help lower cardiovascular disease risk, particularly among older subgroups.
Keywords: household air pollution, blood pressure, biomass, cookstoves, global health, Latin America
INTRODUCTION
Household air pollution generated from burning solid biomass fuels, such as wood, coal, animal dung, and crop residues, for cooking, lighting, and heating homes is a leading risk factor for premature deaths and morbidity worldwide. In 2016, an estimated 2.6 million premature deaths (95% confidence interval [CI], 2.2–3.0 million) and 77.2 million disability-adjusted life-years (95% CI, 66.1–88.0 million) were attributed to household air pollution.1 Cardiovascular health contributes substantially to the burden of disease attributed to household air pollution, yet these estimates are extrapolated from exposure-response effects associated with other sources of combustion-related pollution, such as active smoking, secondhand smoke, and ambient air pollution.2 A limited number of studies with quantitative exposure measurements of air pollutants have evaluated the cardiovascular effects of household air pollution.3–9 In order to understand the full burden of disease, including household air pollution exposure-response associations, cookstove research needs to incorporate direct exposure assessments and relevant cardiovascular endpoints. This research is especially crucial in developing countries, which are disproportionately affected by household air pollution and have increasing rates of cardiovascular morbidity and mortality. In Honduras, a low middle-income country in Central America,10 high systolic blood pressure and household air pollution from burning solid fuels were ranked first and seventh for risk factors for disability-adjusted life-years, respectively.11
One approach to reduce household air pollution is for families to transition from biomass fuel to cleaner energy sources, such as liquefied petroleum gas or electricity. However, many regions worldwide have limited access to cleaner fuels, as 1.3 billion people lack electricity and 2.7 billion people still rely on biomass fuel for cooking.12 In Honduras, 89% of homes in rural areas cook with solid fuels.13 In rural areas where cleaner fuels are not accessible, it is critical to evaluate the impact of cleaner-burning biomass stoves on health outcomes, given the economic feasibility and appropriateness for cooking needs.
One cleaner-burning biomass stove that was designed for Central American homes is the Justa stove (Figure 1). The Justa stove has a rocket type (L-shaped) insulated ceramic combustion chamber, chimney, griddle, and side compartment to remove soot.14 Two to three pots can be cooked on the griddle at once, which is also used for making tortillas. Lab tests showed the Justa emitted one-third the particulate matter emitted by an open 3-stone fire while boiling and simmering five liters of water for 45 minutes (792 mg vs. 2,363 mg, respectively).14 A study comparing 8-hour average concentrations between Justa stoves and traditional stoves during normal daily cooking events among 59 women in Honduras reported 64% lower levels of personal PM2.5 and 73% lower levels of indoor PM2.5 for the Justa stoves.15 Cleaner-burning cookstove interventions often report major reductions in household air pollution,16–18 despite remaining well above the World Health Organization’s 2005 air quality guidelines of a 24-hour mean PM2.5 concentration of 25 μg/m3 and an interim target-1 guideline of 75 μg/m3.19 For example, a wood-burning chimney stove intervention in Guatemala reported 61% lower personal PM2.5 exposure among those cooking on an improved plancha woodstove versus those cooking on open fires, although daily average concentrations among the intervention group were still above WHO guidelines at 102 μg/m3.3 Evidence on the health effects with direct air pollution measures from cookstove interventions is sparse and have not focused on exposure-response relationships for cardiovascular endpoints.
Figure 1.
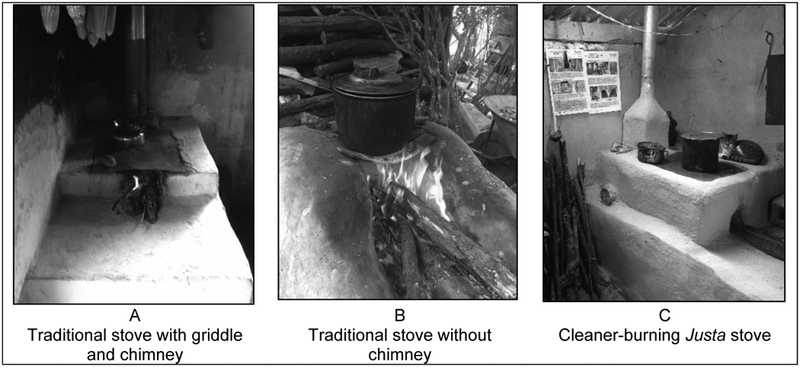
Examples of traditional (A, B) and cleaner-burning Justa biomass cookstoves (C) among the study population, February – April 2015, Department of Intibucá, Honduras.
Our primary objectives were to 1) evaluate the cross-sectional associations between household air pollution, as measured by 24-hour kitchen and personal air pollution concentrations and stove type, and systolic and diastolic blood pressure among 147 female primary cooks in rural Honduras using traditional or cleaner-burning Justa stoves, and 2) assess if age and body mass index (BMI) modified the associations between exposure and blood pressure. We hypothesized higher blood pressure among women with elevated air pollution concentrations and traditional cookstoves, compared to women with lower concentrations and Justa stoves. Based on previous evidence,6,7,9,20 we hypothesized stronger associations between exposure to household air pollution and blood pressure among older women and women with higher BMI.
MATERIALS and METHODS
Study location and population
Our study took place in 11 rural communities near the town of La Esperanza, Department of Intibucá, Honduras. Elevation of the study location ranged from 1,730 to 2,200 meters above sea level, and families relied almost exclusively on biomass fuels for daily energy needs. The primary economy is agriculture, with corn, beans, potatoes, and other fruits and vegetables cultivated for personal consumption and selling in markets. The ethnic background in this region is predominately indigenous Lenca.
Participant recruitment
One hundred and fifty women were recruited between February 9 and April 30, 2015. Women were selected through a convenience sample from 500 households screened in 2014 among people that attended open community meetings. Interested people wrote their names, or family members’ and neighbors’ names, on a list, and study personnel visited households during formative research to classify stove types and sociodemographic characteristics of the study population. The original group of 500 potential participants was reduced based on availability, interest, and the following selection criteria. Owners of Justa stoves and traditional stove users were selected if they were a female, primary cook, non-pregnant, non-smoking, and between 25 and 56 years old. Traditional stove owners could not have any type of improved stove. Participants gave verbal informed consent and received $5 of food items. Justa stoves were installed at least 4 months prior to our data collection, and were given to participants by non-governmental organizations. The study protocol was approved by Colorado State University’s Institutional Review Board, and community leaders gave their approval prior to data collection.
Exposure to household air pollution
We measured exposure to household air pollution by 24-hour average concentrations of personal and kitchen fine particulate matter (PM2.5) and black carbon (BC), and by stove type categories. We calculated 24-hour time-weighted average concentrations for kitchen and personal PM2.5 and BC. Kitchen air pollutants were collected by exposure monitors placed 76–127 centimeters from the front stove edge within the woman’s breathing zone. The monitors were located away from the direct plume of smoke and a window or doorway. Personal air pollutants were collected as women wore a small bag with exposure monitors clipped on the strap near their breathing zone. Women were asked to continue their normal routine while wearing the bag, and to place the bag nearby only to bathe or sleep. Women self-reported during the interview if they had removed the personal bag, other than to bathe or sleep, and for how many minutes it was removed. No samples were collected on Sundays due to church attendance and other family activities that may have led to atypical daily cooking-related exposures.
The PM2.5 size fraction was selected by cyclones (Triplex, BGI, Inc., NJ, USA) and collected on 37-mm filters (Fiberfilm, Pall Corporation, NY, USA) using pumps (AirChek XR5000, SKC Inc., PA, USA) calibrated to 1.5 liters per minute (DryCal Lite, Mesa Labs, NJ, USA) and run for 24 hours. Similar gravimetric exposure assessment methods have been previously used in a similar study population.15 Samples that ran for less than 24 hours were removed from the analysis. Flow rates stayed within 10% of pre- and post-sampling calibrations. Filters were equilibrated for 24 hours and weighed (MX5, Mettler, OH, USA) at Colorado State University. Loaded filters were stored at −22 °C prior to shipment. Seven field blanks were used to determine a limit of detection (LOD) of 54 μg.21 Masses below the limit of detection (LOD), equivalent to a 24-hour average concentration of approximately 25 μg/m3 (kitchen: n=7; personal: n=4) were substituted by LOD/(square root of 2).
We estimated PM2.5 BC concentrations based on the optical transmission of light through the air sampling filters22 using a transmissometer (model OT-21, Magee Scientific, CA, USA). Transmission data were converted to mass concentrations based on published mass-absorption values for combustion aerosol23 and corrected for a filter loading artifact that leads to an underestimation of the BC concentration at high sample loading.24 The LOD was estimated to be 0.86 μg/m3 corresponding to three times the standard deviation of 54 blank samples (additional blank filters were used from field sampling campaigns conducted within the same year to estimate the reference values for the transmissometer since pre-sampling transmission data were not collected on sample filters). Values below the LOD (kitchen: n=3; personal: n=10) were substituted by LOD/(square root of 2). Further details on BC are presented as supplemental material.
Stove type as an exposure measure was defined as primary stove type (traditional vs. cleaner-burning Justa stove), use of multiple stoves (stove stacking), and age of the Justa stove. Traditional stoves were classified as those that had never had a modified combustion chamber, even if there was a chimney or a griddle (Figure 1). Justa stoves, as described above, were wood-burning stoves with a rocket type insulated combustion chamber and a chimney (Figure 1).14,25 Women self-reported if they practiced stove stacking, defined as using a secondary stove for cooking. The secondary stoves were traditional stoves, typically without a chimney and most often located outside. The four categories of stove stacking were traditional stove only, traditional stove with a secondary stove, Justa stove only, or Justa stove with a secondary stove. The age of the Justa stove was based the installation date, categorized by the median as an older Justa of ≥19 months, a newer Justa of 4–19 months, or a traditional stove of any age.
Blood pressure measurements
Non-fasting systolic and diastolic blood pressure were measured using the SphygmoCor XCEL Central Blood Pressure Measurement System (AtCor Medical Pty Ltd, Australia), recorded by the same study investigator at the brachial artery on the woman’s right arm with a 23–33 cm cuff. Three consecutive measurements were taken after the woman had been sitting in a chair in a relaxed position for 10 minutes; the average of the 2nd and 3rd measurements was recorded. The investigator who collected all blood pressure measurements followed the at-home procedures, as described by the American Heart Association.26 Blood pressure was taken between 7 am and 12 noon after the 24-hour period of household air pollution measurements.
Sociodemographic and other measurements
Women self-reported sociodemographic and health characteristics. The in-person questionnaires were developed with community leaders and our local coordinator to ensure comprehensibility and appropriateness. Questionnaire data were recorded in Samsung tablets using Open Data Kit (ODK Collect 1.4.5, UK, https://opendatakit.org/).27 Age was confirmed by the woman’s national identification card. Indicators of socioeconomic status included beds per person in the household, the sum of seven primary household assets (bicycle, motorcycle, television, radio, refrigerator, sewing machine, working electricity), education (reported as the highest grade completed in school), and a dietary diversity score (a sum of ten food groups categorized from 19 commonly eaten food items from a 24-hour dietary recall). Women reported if anyone smoked in their home, the total number of people living in the house, and the number of people that typically ate a meal. Women self-reported how much time they typically spent inside the kitchen while the stove was burning (hours), and how many times they cooked or made coffee during the past 24 hours. Current use of anti-hypertensive medications was self-reported and confirmed by reviewing bottles or prescriptions.
Physical activity was estimated using the updated 2011 Compendium of Physical Activities, based on typical lifestyle activities for the study population, assessed as metabolic equivalents (METs) and calculated as MET adjusted hours per week (i.e., MET-hours).28 A MET is the ratio of the rate of energy expended during an activity to the rate of energy expended at rest.29 For example, 1 MET is the rate of energy expenditure during rest, while an activity that expends 4 times that energy for 30 minutes would be 4 × 30 = 120 MET-minutes (2 MET-hours).29,30 Moderate intensity activities range from 3.0–5.9 METs, and vigorous activities are defined as 6.0 METs or more.29 As reference, running at a pace of a 10-minute mile is a 9.8 MET vigorous activity, whereas general gardening is a 3.8 MET moderate activity. The U.S. Department of Health and Human Services reports that most health benefits occur with at least 2.5 hours of moderate intensity activity, which equals 10 MET-hours (600 MET-minutes at a 4.0 MET activity).29 The lifestyle activities that were queried in this study came from formative research identifying usual activities done by our agricultural-based study population. Physical activities were self-reported by women as hours per week (hours per day x days per week) the woman cut wood (MET=5.5), ground corn (MET=3.3), washed clothes (MET=4.0), milked cows (MET=3.5), worked in the field (MET=4.8), carried heavy items or children (MET=5.0), and walked normally outside of the house (MET=3.5).28 We converted these weekly hours of activity to MET-hours by multiplying the activity by the 2011 Compendium MET score and then summed all values for a total MET-hours per week of physical activity. This approach to sum typical lifestyle activities as hours per week is used in other study populations with very high levels of physical activity.31
Weight and height were measured without shoes, with weight measured by an electronic scale placed on a wooden board, and height measured using measuring tape and level against a wall. An individual’s weight (kilograms) divided by height (meters squared) was used to calculate BMI. Diet was assessed by self-reported daily intake of salt, vegetable shortening, and sugar; women were shown an example of a typical bag of each food item and asked how many days it took their family to finish that item. Daily consumption per person was then calculated by dividing the grams of the item by reported days of consumption, by total number of people that eat in the house. For example, if a woman reported it took 22 days to consume one bag of salt of 400 grams among 8 people in the home, her daily salt consumption was estimated as [(400/22)/8]. These calculations offered approximations of true intake based on self-reported estimates of consumption and may not perfectly capture dietary salt; for example, pre-packaged food items that may have high salt content are not included.
Household elevation and GPS coordinates were recorded on smart phones with the mobile app Maps.Me (MapsWithMe GmbH, Zurich, https://maps.me/). Kitchen temperature was recorded with the Lascar EL-USB-2 relative humidity and temperature logger, which was placed in the cluster of kitchen exposure equipment (Lascar Electronics Inc., PA, USA). The location of primary stoves was coded by the interviewer through direct observation as in a separate building (outside the main house), inside a main living area (e.g., bedroom or living room), or in a separate room but attached to the house. Long-term history of cookstove smoke exposure was estimated as “cook-years,” by subtracting the self-reported age at which the woman started cooking from her current age.
Statistical analysis
We removed three women from the analysis who reported current use of anti-hypertensive medications, for a final sample of 147 women. For analyses of pollution measurements, the sample was reduced for PM2.5 (personal n=104, kitchen n=105) and BC (personal n=105, kitchen n=106) due to DryCal malfunctions at the beginning of the sampling period and missing data with two post-sample filters. The main outcomes of interest were systolic and diastolic blood pressure, assessed as continuous and dichotomized variables: normal blood pressure (systolic <120 mmHg and diastolic <80 mmHg) and borderline high or high blood pressure (systolic ≥120 mmHg and/or diastolic ≥80 mmHg). Too few women with systolic blood pressure ≥ 140 mmHg and/or diastolic ≥90 mgHg warranted a separate category.
Age and BMI were included as continuous variables when adjusting for potential confounding, and dichotomized for interaction analyses (age <40 years and ≥40 years, BMI <25 and ≥25). Years of education was dichotomized as <6 years and ≥6 years because of the compulsory number of school years in Honduras, and household wealth was dichotomized as 0–1 or ≥2 material assets. Beds per household member, MET-hours per week, dietary intake of salt, shortening, and sugar, household elevation, cook-years, and kitchen temperature were assessed as continuous variables. Time of day for the blood pressure measurement was assessed as a continuous variable and dichotomized at the median as 7:10 – 9:59 am and 10:00 am – 12:00 pm. The 11 communities were grouped into six categories based on geographic proximity. Exposure to secondhand smoke was treated as a dichotomous yes/no variable.
Descriptive analyses summarized the means, standard deviations, ranges, frequencies, and outliers. We calculated Spearman correlation coefficients between all 24-hour air pollution measurements. To ensure that Justa and traditional stove users were comparable for key sociodemographic and health-related variables, we compared mean values using independent sample t-tests. We used multivariable linear regression for continuous blood pressure, and logistic regression for dichotomized blood pressure (borderline high or high blood pressure versus normal). Full models included the main exposure (24-hour air pollution concentration or stove type), plus a priori confounders: age, an indicator of socioeconomic status (beds per person, which had the strongest crude association with the outcomes compared to the other SES indicators), BMI, and physical activity. Continuous kitchen and personal air pollution concentrations were natural log transformed to meet the assumptions of regression modeling, specifically to achieve normality in the residuals and avoid nonlinearity, as diagnosed in residual outputs with quantile plots of the residuals and tests for heteroscedasticity. Potential confounders assessed were dietary intake, elevation, kitchen temperature, timing of the blood pressure measure, other SES indicators, and lifetime cooking exposure (cook-years). Potential confounding was assessed by observing meaningful changes in the estimate and precision (95% confidence interval) of the association between exposure and health endpoints based on adding and removing covariates individually.
We assessed effect measure modification in the adjusted linear and logistic regression models by adding an interaction term between the exposure variable and age or BMI. We conducted the following sensitivity analyses on the full model: timing of blood pressure measure (removed n=11 with measures taken before 8 am and after 11:30 am), community (included as a fixed-effect term in the final model), secondhand smoke exposure (removed n=4 with self-reported secondhand smoke exposure), removing blood pressure outliers (e.g., n=4 observations of low diastolic blood pressure with readings less than 60 mmHg), recent added salt intake (removed n=17 who reported eating packaged chips in the past 24 hours), and PM2.5 pump monitors with flow faults (removed observations with post-measurement calibration flow of less than 1.35 liters/minute, personal n=5, kitchen n=3). All statistical analyses were performed in SAS 9.4 (SAS Institute Inc., NC, USA).
RESULTS
Descriptive summary
In Table 1, we present a descriptive summary of the full sample and by stove type. Women were on average (SD) 37.0 (8.7) years of age, and had a mean of 0.5 (0.2) beds per person in the house. Approximately half of the women (n=67, 46%) had less than six years of education, and reported owning one or fewer household assets (n=71, 49%). Mean BMI was 25.7 (4.2) kg/m2, and mean activity level was 212 (107) MET-hours per week. The mean 24-hour kitchen temperature was 21.4 (3.0) degrees Celsius, and mean number years of cooking on a biomass stove was 25.4 (9.6). Women self-reported that they typically spent an average of 5.6 (2.4) hours inside their kitchen with the stove burning, and they had an average of 5.6 (1.6) cooking events (including making coffee) during the past 24 hours. Mean household elevation was 1917 (108) meters. Mean household member intake per day of salt, vegetable shortening, and sugar was 8.6 (6.2), 13.1 (10.1), and 42.5 (25.2) grams, respectively. Only 4 women (3%) had been exposed to secondhand smoke. Mean systolic and diastolic blood pressure in mmHg were 118.3 (12.4) and 73.1 (8.7), respectively, with 90 women (61%) within a normal blood pressure range, and 46 (31%) and 11 (7%) women categorized as having borderline high or high blood pressure, respectively (Table 1). Results from independent sample t-tests showed that Justa and traditional stove users had no significant differences in age, education, household size, number of people eating meals, time spent inside the kitchen on a typical day, cooking events in past 24 hours, total years cooking on a biomass stove, BMI, physical activity, and salt intake.
Table 1.
Descriptive summary of participants for all households and by stove type
| Participant characteristics | All households N=147 |
Traditional stove owners N=74 |
Justa stove owners N=73 |
|---|---|---|---|
| Mean (SD) or N (%) |
Mean (SD) or N (%) |
Mean (SD) or N (%) |
|
| Age (years) | 37.0 (8.7) | 38.1 (9.7) | 35.8 (7.6) |
| Beds per person in the household | 0.5 (0.2) | 0.5 (0.20) | 0.5 (0.20) |
| Education Less than six years Six or more years |
67 (46%) 78 (54%) |
38 (52%) 35 (48%) |
29 (40%) 43 (60%) |
| Material wealth1 0–1 household assets 2 or more household assets |
71 (49%) 75 (51%) |
35 (47%) 39 (53%) |
36 (50%) 36 (50%) |
| Total number of people living in the house, including infants | 6.4 (2.5) | 6.3 (2.7) | 6.4 (2.4) |
| Number of people typically eating meals | 6.1 (2.4) | 5.8 (2.5) | 6.3 (2.4) |
| Typical amount of time spent inside kitchen each day with stove burning (hours) | 5.6 (2.4) | 5.8 (3.0) | 5.4 (2.5) |
| Cooking events in past 24 hours2 | 5.6 (1.6) | 5.7 (1.6) | 5.5 (1.6) |
| Total years cooking with a biomass stove (cook-years) | 25.4 (9.6) | 26.5 (10.7) | 24.4 (8.3) |
| Household elevation (meters) | 1917 (108) | 1,895 (99) | 1,939 (113) |
| Body mass index (kg/m2) | 25.7 (4.2) | 25.5 (4.6) | 25.9 (3.8) |
| Physical activity3 (metabolic equivalents, MET adjusted hours per week) | 212 (107) | 216 (116) | 209 (97) |
| 24-hour average kitchen temperature (degrees Celsius) | 21.4 (3.0) | 21.9 (2.9) | 20.9 (2.9) |
| Salt intake per day per household member (grams) | 8.6 (6.2) | 9.0 (6.0) | 8.2 (6.0) |
| Vegetable shortening intake per day per household member (grams) | 13.1 (10.1) | 14.9 (11.0) | 11.2 (9.0) |
| Sugar intake per day per household member (grams) | 42.5 (25.2) | 43.9 (26.0) | 41.1 (24.0) |
| Start time of blood pressure measure (split at the median value) 7:10 – 9:58 am 9:59 am – 12:00 pm |
72 (49%) 75 (51%) |
34 (46%) 40 (54%) |
38 (52%) 35 (48%) |
| Continuous blood pressure (mmHg) Systolic Diastolic |
118.3 (12.4) 73.1 (8.7) |
119.9 (11.6) 73.8 (8.5) |
116.6 (13.0) 72.3 (8.9) |
| Categorized blood pressure4 Normal Borderline high blood pressure High blood pressure |
90 (61%) 46 (31%) 11 (7%) |
40 (54%) 28 (38%) 6 (8%) |
50 (68%) 18 (25%) 5 (7%) |
Sum of household assets: bike, motorcycle, television, radio, refrigerator, sewing machine, electricity, categorized at the median split
Self-reported times cooking or making coffee during the past 24 hours.
Physical activity was assessed by assigning metabolic equivalents from the 2011 Compendium of Physical Activities for the following lifestyle physical activities, calculated as hours per week: cut wood, grind corn, wash clothes, milk the cow, work in the field, carry a heavy weight and walk normally outside the house.
Blood pressure categories defined as: normal = systolic <120 mmHg and diastolic <80 mmHg; borderline high blood pressure = systolic 120–139 mmHg, diastolic 80–89 mmHg; high blood pressure = systolic ≥140 mmHg, diastolic ≥90 mmHg.
Primary stoves were located in a separate building (n=49, 33%), inside a main living space (n=13, 9%), or in a separate room in the house (n=85, 58%), with no differences in location between traditional and Justa stoves. The sample was split between women who used a traditional stove (n=74, 50%) versus Justa stove (n=73, 50%) (Table 1). In terms of using more than one stove to cook, known as stove stacking, 47 (32%) women used only their traditional stove, 27 (18%) used a traditional with another stove, 38 (26%) used only their Justa stove, and 35 (24%) used their Justa stove with another stove. Among Justa users, mean time since installation of Justa stoves was 24 (17) months, with a median of 19 months.
Personal and kitchen air pollution concentrations
Table 2 includes personal and kitchen air pollution concentrations for all households and by stove type. For all households, mean 24-hour concentrations of personal PM2.5 and BC were 101 (70) μg/m3 and 17 (22) μg/m3, respectively. Mean 24-hour concentrations for kitchen PM2.5 and BC were 266 (329) μg/m3 and 75 (149) μg/m3, respectively. Despite substantial overlap in air pollution concentrations between stove types, as shown in Figure 2, the average personal and kitchen PM2.5 concentrations were 48% and 62% lower, respectively, for Justa stove users compared to traditional stove users (Table 2). Average concentrations for BC were also lower among Justa stove users, with 71% lower personal and kitchen BC concentrations compared to traditional stove users (Table 2). Regarding self-reported compliance among the 104 women with available personal air pollution data, 21 (20%) reported removing the bag for an average of 60 minutes (range: 2–180 minutes); there were no significant differences in personal PM2.5 or BC between those who reportedly removed the bag versus those who were supposedly compliant.
Table 2.
Personal and kitchen air pollution concentrations for all households and by stove type, 24-hour averages
| 24-hour average air pollution concentrations | All households |
Traditional stoves |
Justa stoves |
|---|---|---|---|
| Mean (SD); 10th to 90th percentiles |
Mean (SD); 10th to 90th percentiles |
Mean (SD); 10th to 90th percentiles |
|
| Personal PM2.5 (μg/m3) (n=104) | 101 (70); 37 to 196 | 126 (77); 43 to 241 | 66 (38); 31 to 121 |
| Kitchen PM2.5 (μg/m3) (n=105) | 266 (329); 37 to 643 | 360 (374); 62 to 838 | 137 (194); 28 to 265 |
| Personal BC (μg/m3) (n=105) | 17 (22); 1 to 43 | 24 (26); 4 to 67 | 7 (8); 1 to 15 |
| Kitchen BC (μg/m3) (n=106) | 75 (149); 4 to 173 | 106 (177); 7to 261 | 31 (80); 3 to 47 |
Figure 2.
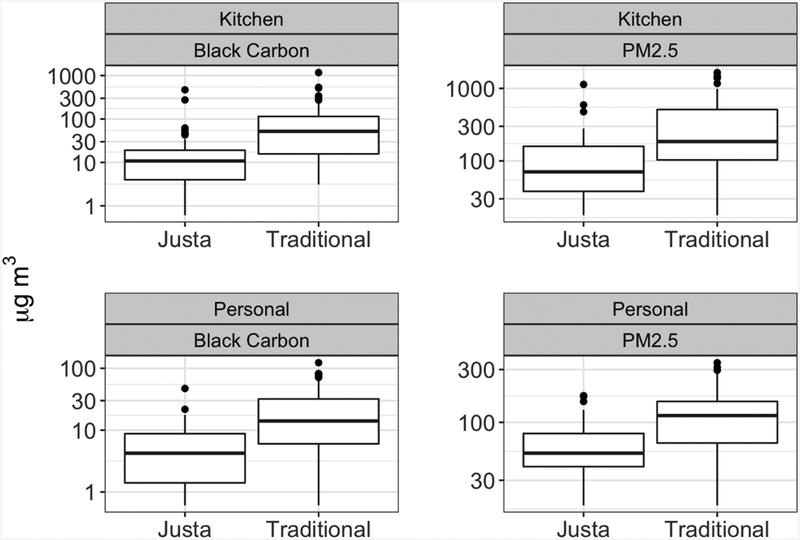
Distributions of 24-hour mean personal and kitchen PM2.5 and black carbon concentrations (μg/m3) by stove type. The black line inside the box shows the median concentration, the box shows the interquartile range, the whiskers show 1.58 times the interquartile range divided by the square root of the sample size, and black circles show values outside this range.
All four household air pollution concentrations were strongly correlated. The Spearman correlation coefficient between personal and kitchen PM2.5 was 0.81, and the correlation between personal and kitchen BC was 0.78. Personal PM2.5 had a Spearman correlation coefficient of 0.78 with personal BC, and kitchen PM2.5 was 0.89 with kitchen BC.
Associations between exposure and blood pressure
Table 3 summarizes the findings from multivariable linear regression analyses of continuous systolic blood pressure. After adjusting for confounders (age, socioeconomic status as beds per person, BMI, and physical activity), we observed higher blood pressure in relation to higher kitchen pollution concentrations. A one unit increase in natural log transformed kitchen PM2.5 concentration was associated with 2.5 mmHg higher systolic blood pressure (95% CI, 0.7 to 4.3). Similar results were observed for kitchen BC and systolic blood pressure (Table 3), and kitchen PM2.5 with diastolic blood pressure (Supplementary Table 1). Results for personal pollutant concentrations and blood pressure were consistent with a null association (Table 3).
Table 3.
Adjusted mean differences in systolic blood pressure (mmHg) comparing continuous (natural log transformed) pollution concentrations and stove types among 147 Honduran women using either a traditional or Justa stove*
| 24-hour average air pollution concentrations1 | Adjusted mean difference (mmHg) in systolic blood pressure (95% CI) |
|---|---|
| Personal PM2.5 (μg/m3) (n=104) | 0.8 (−2.2 to 3.8) |
| Kitchen PM2.5 (μg/m3) (n=105) | 2.5 (0.7 to 4.3) |
| Personal BC (μg/m3) (n=105) | 0.5 (−1.0 to 2.0) |
| Kitchen BC (μg/m3) (n=106) | 1.7 (0.3 to 3.0) |
|
Stove type |
|
| Stove type: Traditional stove (n=74) justa stove (n=72) |
2.8 (−1.1 to 6.6) Reference |
| Stove type: Traditional with use of a secondary stove (n=27) raditional only (n=47) Justa with use of a secondary stove (n=34) justa only (n=38) |
4.2 (−1.8 to 10.2) 2.8 (−2.2 to 7.8) 1.2 (−4.3 to 6.6) Reference |
| Stove type: Traditional only (n=74) Justa installed ≥19 months ago (n=36) Justa installed <19 months ago (n=36) |
4.5 (−0.2 to 9.2) 3.5 (−1.9 to 9.0) Reference |
BC=black carbon; CI=confidence interval; PM=particulate matter<2.5 μm.
Adjusted for: age (continuous), beds per person (continuous), body mass index (continuous), physical activity (continuous).
Per one unit increase in natural log transformed air pollution concentration.
A suggestive association was observed between stove type and systolic blood pressure; women with traditional stoves had a 2.8 mmHg higher systolic blood pressure compared to women with Justa stoves (95% CI, −1.1 to 6.6) (Table 3). Using the four-category stove type variable (based on the use of a secondary stove), we further observed an association of suggestive significance; women with traditional stoves who also stove stacked had a 4.2 mmHg higher systolic blood pressure compared with women who only used a Justa stove (95% CI, −1.8 to 10.2) (Table 3). The age of the Justa stove was also suggestively associated with systolic blood pressure, as women with traditional stoves or older Justa stoves (≥19 months) had higher systolic blood pressure (4.5 mmHg (95% CI, −0.2 to 9.2) and 3.5 mmHg (95% CI, −1.9 to 9.0), respectively), compared to women with newer Justa stoves (<19 months) (Table 3).
Results for the 24-hour air pollution measures suggested an increased odds for the dichotomized outcome of borderline high and high blood pressure for women with higher kitchen concentrations (Table 4). For example, the adjusted odds ratio for borderline high and high blood pressure per unit increase in natural log transformed kitchen PM2.5 concentration was 1.5 (95% CI, 1.0 to 2.3). Similar patterns were observed for kitchen BC (Table 4); for both exposures, the precision estimates of the odds ratios included the null value of 1.0, and therefore results are considered suggestive. Results for personal air pollution exposure measurements were consistent with a null association (Table 4). For stove type, women using traditional stoves were almost twice as likely to have prevalent borderline high or high blood pressure compared to women using Justa stoves (OR = 1.8; 95% CI, 0.9 to 3.7), after adjusting for confounders, although the association is suggestive given the inclusion of the null value in the precision estimate (Table 4).
Table 4.
Adjusted odds ratios in hypertensive status (borderline high or high blood pressure compared to normal) comparing continuous (natural log transformed) pollution concentrations and stove types among 147 Honduran women using either a traditional or Justa stove*
| 24-hour average air pollution concentrations1 | Odds Ratio (95% CI) |
|---|---|
| Personal PM2.5 (μg/m3) (n=104) | 1.1 (0.6 to 2.1) |
| Kitchen PM2.5 (μg/m3) (n=105) | 1.5 (1.0 to 2.3) |
| Personal BC (μg/m3) (n=105) | 1.1 (0.8 to 1.6) |
| Kitchen BC (μg/m3) (n=106) | 1.3 (1.0 to 1.8) |
|
Stove type |
|
| Stove type: Traditional stove (n=74) justa stove (n=72) |
1.8 (0.9 to 3.7) Reference |
| Stove type: Traditional with use of a secondary stove (n=27) Traditional only (n=47) Justa with use of a secondary stove (n=34) Justa only (n=38) |
1.6 (0.5 to 4.7) 2.3 (0.9 to 5.8) 1.2 (0.4 to 3.3) Reference |
| Stove type: Traditional only (n=74) Justa installed ≥19 months ago (n=36) Justa installed <19 months ago (n=36) |
2.3 (0.9 to 5.7) 1.6 (0.6 to 4.4) Reference |
BC=black carbon; CI=confidence interval; PM=particulate matter<2.5 μm.
Adjusted for: age (continuous), beds per person (continuous), body mass index (continuous), physical activity (continuous).
Per one unit increase in natural log transformed pollution concentration.
For all measured air pollutants, we observed evidence that age modified the associations with continuous systolic blood pressure, with stronger associations among women who were 40 years or older compared to women who were less than 40 years (Table 5). For example, among women who were 40 or older, a one unit increase in natural log transformed kitchen PM2.5 concentration was associated with 5.2 mmHg higher systolic blood pressure (95% CI, 2.3 to 8.1), whereas women who were less than 40 did not show evidence of an association (p-value for interaction=0.02). Similar results were observed for diastolic blood pressure (Supplementary Table 2). Similar patterns of effect modification by age were observed with the dichotomized blood pressure variable; however, the confidence intervals were not as precise (Table 6). We did not observe effect measure modification by age when evaluating stove type (Tables 5 and 6), or by BMI in linear and logistic regression models (Supplementary Tables 3–5).
Table 5.
Effect modification by age for the adjusted mean differences in systolic blood pressure (mmHg) comparing continuous (natural log transformed) pollution concentrations and stove types among 147 Honduran women using either a traditional or Justa stove*
| 24-hour average air pollution concentrations1 | Age category | Adjusted mean difference in systolic blood pressure (95% CI) | P-value for interaction |
|---|---|---|---|
| Personal PM2.5 (μg/m3) (n=104) | ≥40 years (n=35) <40 years (n=69) |
3.9 (−1.5 to 9.3) −0.7 (−4.4 to 3.1) |
0.17 |
| Kitchen PM2.5 (μg/m3) (n=105) | ≥40 years (n=36) <40 years (n=69) |
5.2 (2.3 to 8.1) 0.7 (−1.7 to 3.0) |
0.02 |
| Personal BC (μg/m3) (n=105) | ≥40 years (n=35) <40 years (n=70) |
1.6 (−1.0 to 4.2) −0.2 (−2.1 to 1.7) |
0.29 |
| Kitchen BC (μg/m3) (n=106) | ≥40 years (n=36) <40 years (n=70) |
3.3 (1.1 to 5.5) 0.7 (−1.1 to 2.4) |
0.06 |
| Stove type (Traditional vs. Justa) | ≥40 years (n=52) <40 years (n=95) |
1.0 (−5.7 to 7.1) 3.6 (−1.2 to 8.5) |
0.54 |
BC=black carbon; CI=confidence interval; PM=particulate matter<2.5 μm.
Adjusted for: age (continuous), beds per person (continuous), body mass index (continuous), physical activity (continuous).
Per one unit increase in natural log transformed pollution concentration.
Table 6.
Effect modification by age for the adjusted odds ratios in hypertensive status (borderline high or high blood pressure compared to normal) comparing continuous (natural log transformed) pollution concentrations and stove types among 147 Honduran women using either a traditional or Justa stove*
| 24-hour average air pollution concentrations1 | Age category | Odds ratio (95% CI) | p-value for interaction |
|---|---|---|---|
| Personal PM2.5 (μg/m3) (n=104) | ≥40 years (n=35) <40 years (n=69) |
1.6 (0.7 to 3.5) 1.2 (0.7 to 1.9) |
0.29 |
| Kitchen PM2.5 (μg/m3) (n=105) | ≥40 years (n=36) <40 years (n=69) |
2.3 (1.1 to 5.1) 1.7 (1.1 to 2.8) |
0.19 |
| Personal BC (μg/m3) (n=105) | ≥40 years (n=35) <40 years (n=70) |
1.4 (0.7 to 3.2) 1.1 (0.7 to 1.8) |
0.23 |
| Kitchen BC (μg/m3) (n=106) | ≥40 years (n=36) <40 years (n=70) |
2.3 (1.0 to 5.4) 1.9 (1.1 to 3.1) |
0.39 |
|
Stove type (Traditional vs. Justa) |
≥40 years (n=52) <40 years (n=95) |
1.1 (0.6 to 2.0) 1.3 (0.9 to 1.9) |
0.39 |
BC=black carbon; CI=confidence interval; PM=particulate matter<2.5 μm.
Adjusted for: age (continuous), beds per person (continuous), body mass index (continuous), physical activity (continuous).
Per one unit increase in natural log transformed pollution concentration.
Sensitivity analyses
We conducted sensitivity analyses on the full models per exposure variable, as described under Methods, including adjustment for community of residence and removal of those with blood pressure measurements at early or late times, exposure to secondhand smoke, blood pressure outliers, added salt intake via self-report of prepackaged chip consumption in the past 24 hours, or exposure monitors with air pump flow faults. None of the final model results for effect or precision were meaningfully changed based on the sensitivity analyses.
DISCUSSION
We evaluated the cross-sectional association between exposure to household air pollution and systolic and diastolic blood pressure among 147 women living in rural Honduras, while considering effect modification by age and BMI. All women used biomass cookstoves- half used traditional stoves without a modified combustion chamber, and half used a cleaner-burning Justa stove. Traditional stoves produced substantially higher 24-hour mean personal and kitchen PM2.5 and BC concentrations compared to Justa stoves. Study results provide suggestive evidence to support our hypothesis that higher levels of air pollution concentrations in kitchens were associated with elevated systolic and diastolic blood pressure. Similarly, we observed an increased adjusted odds of borderline high and high blood pressure among women using a traditional stove and with higher kitchen air pollution concentrations. Results suggest that age modified associations with blood pressure for all air pollutants, as seen with stronger associations among women 40 years or older compared to women less than 40 years. Adjusted analyses showed suggestive evidence of associations in the hypothesized direction between stove type and stove stacking. Our observed association of stove stacking with elevated blood pressure (as compared to using only the Justa stove) supports the argument that any continued use of traditional stoves diminishes the health benefits expected from a cleaner-burning stove intervention.32–34
The associations between kitchen PM2.5 concentrations and blood pressure were stronger than those for personal PM2.5, although general consensus supports personal exposure concentrations as a better estimate of personal exposure.35 For this study, however, 24-hour kitchen PM2.5 concentration measurements may have offered a more accurate depiction of long-term personal exposure to biomass smoke than a 24-hour personal PM2.5 measurement, perhaps due to lower daily variability for a one-time 24-hour kitchen measurement.
Our main study results are consistent with previous studies, which also report associations between household air pollution and blood pressure outcomes. 3,7,9 A cross-sectional study among 280 women in rural China reported almost identical results as ours: each unit increase in natural log PM2.5 concentration was associated with 2.2 mmHg higher systolic blood pressure (95% CI, 0.8 to 3.7).7 Stronger effects of household air pollution on blood pressure among older women is further supported by other studies 20, such as the rural China study 7 and a cookstove intervention in Guatemala.3 Previous cookstove interventions also reported reduced pollution measures between traditional and cleaner-burning biomass stoves. For example, a substantial drop was observed in 24-hour mean kitchen PM2.5 concentrations from 240 μg/m3 (210) to 48 μg/m3 (41) between pre- and post-intervention in a study in rural Bolivia,9 with a mean decrease in systolic blood pressure from 114.5 (SD 13) to 109.0 (SD 10.4) mmHg.9 We did not find evidence of effect modification by BMI, which is not consistent with previous research in Latin America, 9,20 and it is unclear why our study population differed. Overall, previous studies, as well as our own, support the idea that meaningful changes in blood pressure are possible even when cleaner-burning stoves produce household air pollution concentrations above the World Health Organization’s 2005 air quality guidelines of a 24-hour mean PM2.5 concentration of 25 μg/m3 and an interim target-1 guideline of 75 μg/m3.19
The impact of household air pollution on blood pressure is gaining recognition, particularly in low- to middle-income countries that rely heavily on biomass fuels for cooking, heating, and lighting homes,3,8,36,37 and for susceptible population subgroups based on age or overweight/obesity.6,7,9,20 Elevated blood pressure is a consistent and independent risk factor for cardiovascular disease38 and is no longer limited to wealthy, developed nations. The most recent Global Burden of Disease study reported elevated systolic blood pressure as the number one contributor to disability-adjusted life-years worldwide, including Latin America.1 In Honduras in 2015, high systolic blood pressure and household air pollution were ranked first and seventh, respectively, for disability-adjusted life-years among men and women.2 Previous mechanistic studies from animals and humans support an association between air pollution and elevated blood pressure, possibly via sympathetic nervous system activation and vascular dysfunction.39 The link between household air pollution and blood pressure presents a key opportunity for prevention on a large-scale in the global epidemic of cardiovascular disease.
Strengths and Limitations
Several strengths of this research included measuring air pollution concentrations in a population previously not well-studied, demonstrating the feasibility of the SphygmoCor device in a field setting to measure blood pressure, and quantitatively assessing a range of potential confounders. Our two study groups were comparable with respect to the measured characteristics. The Justa stove is reliable, well-accepted in this region, and locally sourced. Our results on BC are novel and closely track the findings for PM2.5, contributing to a gap in the literature on this particular exposure measure.
Several limitations are important to note. The cross-sectional design did not allow for a temporal relationship to be established between the exposures and blood pressure outcomes. We did, however, address this limitation to an extent by including only participants who owned their current stove for four months or longer. The 24-hour exposure period may not have been representative of normal cooking routines, especially if the woman was measured on a day that she did not cook normally. We were unable to measure all potential pollutants from combustion, and PM2.5 and BC may be indicators of other health-damaging pollutants that were not measured.35
Salt and physical activity are important contributing factors to blood pressure, and our estimates of these two variables were proxies for true values, given self-reported measures of consumption and weekly activity. It is possible that effect estimates might change with more accurate values of salt intake and physical activity. Our estimated MET-hours per week represents an upper extreme for lifestyle activity compared to urbanized populations,30 although it reflects other, perhaps more similar, populations living traditional lifestyles. For example, an Old Order Amish community in Ontario had similarly high levels of activity and reported levels much greater than other populations (mean MET-hours per week for men and women was 255).31 This may offer a useful comparison to our study population that also lacks access to cars, electrical appliances, and still uses labor-intensive farming methods.
Justa stove users received their stoves from non-governmental organizations prior to our data collection, and some NGO projects had criteria for installation (e.g., at least one child less than 5 years old), which could possibly have created systematic differences in Justa versus traditional stove users. While we did not find significant differences in sociodemographic characteristics (age, education, household size, number of people eating meals), physical activity, diet, or cooking patterns between stove type groups, there may still be residual confounding not accounted for by the study, as well as other relevant confounders not captured. Lastly, the relatively small sample size in our study (N=147) may be a limitation given the cross-sectional study design, based on previous studies with a blood pressure endpoint that reported limited power.
There are several potential sources of bias in this study design and implementation. Women were selected to participate based mostly on reviewing lists created at community meetings, so women who did not attend the meetings, such as if they were too sick to attend, would have been left out of recruitment, thus making results difficult to generalize. It is possible that women were not fully compliant with wearing the personal exposure bag for 24 hours, and that our self-reported measure of compliance underestimated the actual amount of time that the bag was removed. If there was a difference in compliance based on women’s daily activities, such as some women being more likely to remove the bag when cooking, then it is possible that personal exposure concentrations might be artificially low in a subgroup of women.
Significance
The differences in blood pressure and household air pollution concentrations by stove type support the argument that cleaner-burning biomass cookstoves may have the potential to effectively reduce health-damaging exposure to household air pollution, even in the absence of electric or gas stoves. Although some results by stove type had wide confidence intervals or included null values, stove type is the largest source of exposure to air pollution in these rural communities, indicating that the installation of cleaner-burning stoves should be targets for interventions. Furthermore, despite observing concentrations higher than the WHO air quality guidelines among homes with both Justa and traditional stoves, we observed suggestive evidence of clinically meaningful differences in blood pressure between users of the two stove types.40 A reduction of as little as 2 mmHg in systolic blood pressure could lead to 10% lower stroke mortality and 7% lower mortality from ischemic heart disease or other vascular causes in middle age.40 The results of this study support previous research that intervening at the household level with acceptable and well-functioning biomass stoves can reduce household air pollution and have potentially important impacts on population health for cardiovascular disease risk, especially among older subgroups, even when pollution levels remain above target guidelines.
CONCLUSION
Consistent with previous studies, higher air pollution concentrations in kitchens showed suggestive associations with elevated systolic and diastolic blood pressure in women. This association was stronger in older women. Kitchen air pollution concentrations may better represent long-term exposure to biomass combustion than personal exposures, particularly when a single 24-hour sample is collected. Intervening at the household level with culturally-appropriate, accepted, accessible biomass cookstoves that reduce household air pollution may have beneficial impacts on blood pressure with the potential to decrease risk of cardiovascular disease.
Supplementary Material
PRACTICAL IMPLICATIONS.
Household air pollution and elevated blood pressure are leading contributors to morbidity and premature death worldwide. We observed elevated systolic and diastolic blood pressure associated with exposure to household air pollution from biomass cookstoves among women in rural Honduras. The association was stronger in older women. Cleaner-burning cookstove interventions may potentially reduce exposure to household air pollution with likely benefits for blood pressure and cardiovascular disease risk. The growing evidence of a link between household air pollution and blood pressure presents an opportunity to mitigate a modifiable and globally important risk factor for cardiovascular disease.
Acknowledgements
We are grateful to our Honduran collaborators and local community leaders for their ongoing support of this project. We sincerely thank Jonathan Stack and Gloribel Bautista Cuellar for their excellent contributions to the fieldwork and data collection. Research reported in this publication was supported by the National Institute of Environmental Health Sciences of the National Institutes of Health under award number ES022810. The content is solely the responsibility of the authors and does not necessarily represent the official views of the National Institutes of Health.
REFERENCES
- 1.GBD 2016 Risk Factors Collaborators. Global, regional, and national comparative risk assessment of 84 behavioural, environmental and occupational, and metabolic risks or clusters of risks, 1990–2016: a systematic analysis for the Global Burden of Disease Study 2016. Lancet (London, England). 2017;390:1345–1422. [DOI] [PMC free article] [PubMed] [Google Scholar]
- 2.GBD Risk Factors Collaborators. Global, regional, and national comparative risk assessment of 79 behavioural, environmental and occupational, and metabolic risks or clusters of risks, 1990–2015: a systematic analysis for the Global Burden of Disease Study 2015. Lancet. 2016;388(10053):1659–1724. [DOI] [PMC free article] [PubMed] [Google Scholar]
- 3.McCracken JP, Smith KR, Diaz A, Mittleman MA, Schwartz J. Chimney stove intervention to reduce long-term wood smoke exposure lowers blood pressure among Guatemalan women. Environ Health Perspect 2007;115(7):996–1001. [DOI] [PMC free article] [PubMed] [Google Scholar]
- 4.Smith KR, Peel JL. Mind the gap. Environ Health Perspect 2010;118(12):1643–1645. [DOI] [PMC free article] [PubMed] [Google Scholar]
- 5.McCracken J, Smith KR, Stone P, Diaz A, Arana B, Schwartz J. Intervention to Lower Household Woodsmoke Exposure in Guatemala Reduces ST-segment Depression on Electrocardiograms. Environ Health Perspect 2011;119:1562–1568. [DOI] [PMC free article] [PubMed] [Google Scholar]
- 6.Clark ML, Bazemore H, Reynolds SJ, et al. A baseline evaluation of traditional cook stove smoke exposures and indicators of cardiovascular and respiratory health among Nicaraguan women. Int J Occup Environ Health. 2011;17(2):113–121. [DOI] [PubMed] [Google Scholar]
- 7.Baumgartner J, Schauer JJ, Ezzati M, et al. Indoor air pollution and blood pressure in adult women living in rural china. Environmental Health Perspectives. 2011;119(10):1390–1395. [DOI] [PMC free article] [PubMed] [Google Scholar]
- 8.Baumgartner J, Zhang YX, Schauer JJ, Huang W, Wang YQ, Ezzati M. Highway proximity and black carbon from cookstoves as a risk factor for higher blood pressure in rural China. Proc Natl Acad Sci U S A. 2014;111(36):13229–13234. [DOI] [PMC free article] [PubMed] [Google Scholar]
- 9.Alexander D, Larson T, Bolton S, Vedal S. Systolic blood pressure changes in indigenous Bolivian women associated with an improved cookstove intervention. Air Qual Atmos Hlth 2015;8(1):47–53. [Google Scholar]
- 10.The World Bank. The World Bank Country Data: Honduras. 2016; http://data.worldbank.org/country/honduras. Accessed January 3, 2017, 2017.
- 11.GBD 2015 Risk Factors Collaborators. Global, regional, and national comparative risk assessment of 79 behavioural, environmental and occupational, and metabolic risks or clusters of risks, 1990–2015: a systematic analysis for the Global Burden of Disease Study 2015. Lancet (London, England). 2016;388(10053):1659–1724. [DOI] [PMC free article] [PubMed] [Google Scholar]
- 12.IEA (International Energy Agency). World Energy Outlook 2011. Paris: International Energy Agency and OECD Available: http://wwwworldenergyoutlookorg/publications/weo-2011/ [Accessed October 2015]. 2011.
- 13.Global Alliance for Clean Cookstoves. Global Alliance for Clean Cookstoves Country Profile: Honduras. 2016; http://cleancookstoves.org/country-profiles/103-honduras.html. Accessed January 3, 2017, 2017.
- 14.Still D, MacCarty N, Ogle D, Bond T, Bryden M. Test results of cook stove performance. 2011; http://www.pciaonline.org/files/Test-Results-Cookstove-Performance.pdf.
- 15.Clark ML, Peel JL, Burch JB, et al. Impact of improved cookstoves on indoor air pollution and adverse health effects among Honduran women. Int J Environ Health Res 2009;19(5):357–368. [DOI] [PubMed] [Google Scholar]
- 16.Smith KR, Dutta K, Chengappa C, et al. Monitoring and evaluation of improved biomass cookstove programs for indoor air quality and stove performances: conclusions from the Household Energy and Health Project. Energy for Sustainable Development. 2007;11(2):5–18. [Google Scholar]
- 17.Sambandam S, Balakrishnan K, Ghosh S, et al. Can currently available advanced combustion biomass cook-stoves provide health relevant exposure reductions? Results from initial assessment of select commercial models in India. EcoHealth. 2015;12(1):25–41. [DOI] [PubMed] [Google Scholar]
- 18.Pope D, Bruce N, Dherani M, Jagoe K, Rehfuess E. Real-life effectiveness of ‘improved’ stoves and clean fuels in reducing PM2.5 and CO: Systematic review and meta-analysis. Environ Int 2017;101:7–18. [DOI] [PubMed] [Google Scholar]
- 19.WHO. WHO Air quality guidelines for particulate matter, ozone, nitrogen dioxide and sulfur dioxide: Global update 2005; Summary of risk assessment. 2006; http://apps.who.int/iris/bitstream/handle/10665/69477/WHO_SDE_PHE_OEH_06.02_eng.pdf;jsessionid=A486614BB701DC857FA749675A654900?sequence=1.
- 20.Clark ML, Bachand AM, Heiderscheidt JM, et al. Impact of a cleaner-burning cookstove intervention on blood pressure in Nicaraguan women. Indoor Air 2013;23(2):105–114. [DOI] [PMC free article] [PubMed] [Google Scholar]
- 21.MacDougall D, Crummett WB, et al. Guidelines for data acquisition and data quality evaluation in environmental chemistry. Analytical Chemistry. 1980;52(14):2242–2249. [Google Scholar]
- 22.Hansen ADA, Rosen H, Novakov T. The aethalometer — An instrument for the real-time measurement of optical absorption by aerosol particles. Sci Total Environ 1984;36:191–196. [Google Scholar]
- 23.Chylek P, Ramaswamy V, Cheng R, Pinnick RG. Optical properties and mass concentration of carbonaceous smokes. Applied optics 1981;20(17):2980–2985. [DOI] [PubMed] [Google Scholar]
- 24.Kirchstetter TW, Novakov T. Controlled generation of black carbon particles from a diffusion flame and applications in evaluating black carbon measurement methods. Atmospheric Environment. 2007;41(9):1874–1888. [Google Scholar]
- 25.Kshirsagar MP, Kalamkar VR. A comprehensive review on biomass cookstoves and a systematic approach for modern cookstove design. Renewable and Sustainable Energy Reviews. 2014;30:580–603. [Google Scholar]
- 26.AHA. American Heart Association Procedures: Monitoring your blood pressure at home. 2018; http://www.heart.org/HEARTORG/Conditions/HighBloodPressure/KnowYourNumbers/Monitoring-Your-Blood-Pressure-at-Home_UCM_301874_Article.jsp#.W05WHntKguV.
- 27.Hartung C, Anokwa Y, Brunette W, Lerer A, Tseng C, Borriello G. Open Data Kit: Tools to Build Information Services for Developing Regions 4th ACM/IEEE International Conference on Information and Communication Technologies and Development; 2010; London, UK. [Google Scholar]
- 28.Ainsworth BE, Haskell WL, Herrmann SD, et al. 2011 Compendium of Physical Activities: A Second Update of Codes and MET Values. Med Sci Sport Exer 2011;43(8):1575–1581. [DOI] [PubMed] [Google Scholar]
- 29.USDHHS. Physical activity guidelines for Americans. 2008; https://health.gov/paguidelines/guidelines/, 2018.
- 30.Wu S, Fisher-Hoch SP, Reininger B, McCormick JB. Recommended Levels of Physical Activity Are Associated with Reduced Risk of the Metabolic Syndrome in Mexican-Americans. PLoS One. 2016;11(4):e0152896. [DOI] [PMC free article] [PubMed] [Google Scholar]
- 31.Bassett DR, Schneider PL, Huntington GE. Physical activity in an Old Order Amish community. Medicine and science in sports and exercise. 2004;36(1):79–85. [DOI] [PubMed] [Google Scholar]
- 32.Ruiz-Mercado I, Masera O. Patterns of stove use in the context of fuel-device stacking: rationale and implications. Ecohealth. 2015;12(1):42–56. [DOI] [PubMed] [Google Scholar]
- 33.Ruiz-Mercado I, Masera O, Zamora H, Smith KR. Adoption and sustained use of improved cookstoves. Energy Policy. 2011;39:7557–7566. [Google Scholar]
- 34.Mobarak AM, Dwivedi P, Bailis R, Hildemann L, Miller G. Low demand for nontraditional cookstove technologies. Proc Natl Acad Sci U S A. 2012;109(27):10815–10820. [DOI] [PMC free article] [PubMed] [Google Scholar]
- 35.Clark ML, Peel JL, Balakrishnan K, et al. Health and household air pollution from solid fuel use: the need for improved exposure assessment. Environ Health Perspect 2013;121(10):1120–1128. [DOI] [PMC free article] [PubMed] [Google Scholar]
- 36.Dutta A, Ray MR. Prevalence of hypertension and pre-hypertension in rural women: A report from the villages of West Bengal, a state in the eastern part of India. Australian Journal of Rural Health. 2012;20(4):219–225. [DOI] [PubMed] [Google Scholar]
- 37.Pena MB, Romero KM, Velazquez EJ, et al. Relationship Between Daily Exposure to Biomass Fuel Smoke and Blood Pressure in High-Altitude Peru. Hypertension. 2015;65(5):1134–1140. [DOI] [PMC free article] [PubMed] [Google Scholar]
- 38.Pickering TG, Hall JE, Appel LJ, et al. Recommendations for blood pressure measurement in humans and experimental animals: part 1: blood pressure measurement in humans: a statement for professionals from the Subcommittee of Professional and Public Education of the American Heart Association Council on High Blood Pressure Research. Circulation. 2005;111(5):697–716. [DOI] [PubMed] [Google Scholar]
- 39.Brook RD, Rajagopalan S, Pope CA, 3rd, et al. Particulate matter air pollution and cardiovascular disease: An update to the scientific statement from the American Heart Association. Circulation. 2010;121(21):2331–2378. [DOI] [PubMed] [Google Scholar]
- 40.Lewington S, Clarke R, Qizilbash N, Peto R, Collins R. Age-specific relevance of usual blood pressure to vascular mortality: a meta-analysis of individual data for one million adults in 61 prospective studies. Lancet. 2002;360(9349):1903–1913. [DOI] [PubMed] [Google Scholar]
Associated Data
This section collects any data citations, data availability statements, or supplementary materials included in this article.