

SUMMARY
Serrated adenocarcinoma, an alternative pathway for colorectal cancer (CRC) development, accounts for 15–30% of all CRCs and is aggressive and treatment-resistant. We show that the expression of atypical protein kinase c (PKC)ζ and PKC λ/ι was reduced in human serrated tumors. Simultaneous inactivation of these genes in the mouse intestinal epithelium resulted in spontaneous serrated tumorigenesis that progressed to advanced cancer with a strongly reactive and immunosuppressive stroma. Whereas epithelial PKCλ/ι deficiency led to immunogenic cell death and the infiltration of CD8+ T cells, which repressed tumor initiation, PKCζ loss impaired interferon and CD8+ T cell responses, which resulted in tumorigenesis. Combined treatment with a TGF-β receptor inhibitor plus anti-PDL1 checkpoint blockade showed synergistic curative activity. Analysis of human samples supported the relevance of these kinases in the immunosurveillance defects of human serrated CRC. These findings provide insight into avenues for the detection and treatment of this poor-prognosis subtype of CRC.
Graphical Abstract

eTOC
Serrated adenocarcinomas are an aggressive and treatment-resistant form of colorectal cancer. Nakanishi et al. show that expression of atypical PKCs is reduced in human serrated tumors and that their loss results in spontaneous serrated tumorigenesis in mice, with stromal activation and immunosuppression. The simultaneous inhibition of stromal activation combined with anti- PD-L1 showed synergistic therapeutic potential.
INTRODUCTION
Colorectal cancer (CRC) develops through precursor lesions that originate from either “conventional” or “alternative” pathways (IJspeert et al., 2015). The conventional pathway is predominately initiated by the inactivation of the Apc tumor suppressor gene and results in a tubular adenoma histology (Fearon and Vogelstein, 1990). The alternative pathway is initiated by the formation of “serrated” adenoma in the absence of changes in APC or β-catenin and is associated with activation of the ERK cascade, occasionally as a result of activating mutations in KRAS or BRAF (IJspeert et al., 2015). Although undoubtedly important, these mutations are not present in all serrated adenomas (IJspeert et al., 2015). Moreover, in mouse models, the additional inactivation of tumor suppressors outside of the ERK pathway, such as p16INK4a, p53, or CDX2, is required for these tumors to progress to the advanced carcinoma stage (Bennecke et al., 2010; Rad et al., 2013). Despite these important observations, little is known about the role of the tumor microenvironment in the development of serrated CRC.
There is no clear therapeutic consensus on how, or whether, CRC originating from the serrated pathway should be treated differently than conventional CRC. Recent studies have demonstrated that serrated precursor lesions are associated with a transcriptional subtype of CRC that has very poor prognosis (De Sousa et al., 2013). Encouragingly, emerging evidence suggests that immunotherapy may be a viable option for patients with serrated CRC, specifically those of the microsatellite instability (MSI)-high or mismatch-repair deficient (dMMR) type (Le et al., 2015). Although the MSI-high phenotype is associated with serrated tumorigenesis, a significant proportion of poor prognosis serrated tumors are microsatellite stable (MSS), and respond poorly to single-agent PD-1 inhibitor treatment, yet a subgroup of MSS patients have high PD-1 expression and were suggested to benefit from checkpoint T cell therapies (Mlecnik et al., 2016). Understanding the immunological environment of serrated tumors is critically important for identifying more efficacious therapies. Because immunosuppression and inflammation might play key roles in the development of serrated CRCs, a detailed mechanistic study on the potential function of immunity in serrated tumor initiation and progression is of paramount importance for prevention and treatment.
Intestinal chronic inflammatory diseases are associated with elevated risk for CRC (Beaugerie and Itzkowitz, 2015). We recently identified the atypical protein kinase C (aPKC) λ/ι (PKC λ/ι; encoded by the PRKCI gene) as a regulator of intestinal inflammation, in the context of inflammatory bowel diseases (IBD), such as Crohn’s disease (CD) and ulcerative colitis (UC) (Nakanishi et al., 2016). PKC λ/ι is required for Paneth cell differentiation and is a negative regulator of cell death in the intestinal epithelium (Nakanishi et al., 2016). PKC λ/ι levels decrease in Paneth cells of CD patients in a manner that correlates with disease progression (Nakanishi et al., 2016). Furthermore, a Kaplan-Meier survival analysis of CRC patients demonstrated that low PKC λ/ι levels correlate with significantly worse patient survival rates (Nakanishi et al., 2016). This proinflammatory environment of the PKC λ/ι-deficient intestinal epithelium is most probably linked to a defective barrier due to impaired Paneth cell differentiation and increased intestinal epithelial cell (IEC) death (Nakanishi et al., 2016). However, even in the presence of chronic inflammation, the selective genetic inactivation of PKC λ/ι in the intestinal epithelium does not lead to tumorigenesis unless combined with Apc deficiency, in which case the number of intestinal adenomas increases significantly through a mechanism that depends on inflammation and the microbiome; however, these adenomas never progress to aggressive and invasive stages (Nakanishi et al., 2016). One potential explanation is that the other aPKC, PKCζ (encoded by the gene PRKCZ), might maintain pathways that can prevent cancer initiation and progression in PKC λ/ι-deficient intestines. Here we explore the mechanisms of serrated tumor initiation in the context of the simultaneous genetic inactivation of both aPKCs, their relevance in human serrated CRC, and the potential implications for therapy. We demonstrate that PKC λ/ι and PKCζ provide complementary and unique functions that cooperate to suppress intestinal serrated tumorigenesis.
RESULTS
Loss of both aPKCs results in serrated tumor development in small intestine and colon
To test whether the combined loss of PKC λ/ι and PKCζ in the intestinal epithelium is sufficient to drive tumorigenesis in the absence of other oncogenic insults, we crossed Prkcifl/fland Prkczfl/flmice with Villin-cre mice to generate mouse lines with deletions in PKCλ/ι (Prkcifl/flVillin-cre), PKCζ (Prkczfl/flVillin-cre), or both aPKCs (Prkcifl/flPrkczfl/flVillin-cre) in IECs. Prkcifl/flPrkczfl/flVillin-cre mice were born at the expected Mendelian ratios but showed reduced body size and weight, as well as a worse survival rate than wild-type (WT) mice (Figures 1A–1C). Prkcifl/flPrkczfl/flVillin-cre intestines often appeared dilated and full, suggesting altered intestinal function and obstruction (Figure 1A), and had a severe reduction in the number of Paneth cells in the crypts, as determined by lysozyme immunohistochemistry (IHC) (Figure S1A). Remaining Paneth cells were mislocalized at the upper crypt and villi, and a population of immature differentiated cells that stained positive for markers of both Paneth cells (lysozyme) and goblet cells (Alcian blue) was also found (Figure S1A). Prkcifl/flPrkczfl/flVillin-cre mice exhibited a deformed, “saw-tooth” hyperplastic appearance in both the small intestine and colon, which resembled the human serrated phenotype (Figure 1D). This resemblance extended to the existence in the Prkcifl/flPrkczfl/flVillin-cre intestines of cytomorphologic features that were similar to human microvesicular or goblet cell-rich serrated hyperplasia (Figure S1B), which is a premalignant lesion that can progress to CRC through an alternative pathway to the conventional “adenoma-carcinoma” sequence (IJspeert et al., 2015). After 7 weeks of age, both the small intestines and colons of Prkcifl/flPrkczfl/flVillin-cre mice developed spontaneous sessile serrated adenomas-polyps (SSA/Ps) with dilated and distorted crypts (Figures 1D and 1E). In sharp contrast with Prkcifl/flVillin-cre and Prkczfl/flVillin-cre mice, which almost never developed tumors (Figure S1C), Prkcifl/flPrkczfl/flVillin-cre mice showed efficient and progressive development of intestinal tumors, which increased as the mice aged (Figures 1F and S1C). Although no significant differences were found in tumor distribution among distinct regions of small intestine, there was a preference for the proximal location in the colon (Figures 1G, 1H, and S1D), which closely mirrors the behavior of human serrated CRC. Colon tumors were occasionally accompanied by mucin inclusions (Figure 1H). Aberrant crypt formation in the form of lateral budding of crypts and cytological atypia were also observed, indicating the presence of accompanying dysplastic changes (Figure 1D). Furthermore, a large subset of Prkcifl/flPrkczfl/flVillin-cre intestinal tumors progressed to intramucosal (Figure 1D) and even invasive adenocarcinoma (Figure 1I). That is, 72.2% (13/18) and 81.3% (13/16) of mice developed adenocarcinoma in the small intestine and colon, respectively.
Figure 1. Simultaneous inactivation of PKCλ/ι and PKCζ drives serrated tumorigenesis in small intestine and colon.

(A) Gross images of wild-type (WT) and Prkcifl/flPrkczfl/flVillin-cre mice. Red arrows denote dilated intestine.
(B) Body weight of WT (n = 15) and Prkcifl/flPrkczfl/flVillin-cre mice (n = 23).
(C) Kaplan-Meier survival curve of WT (n = 20) and Prkcifl/flPrkczfl/flVillin-cre (n = 22) mice.
(D) Hematoxylin and eosin (H&E) staining of small intestine and colon sections from WT and Prkcifl/flPrkczfl/flVillin-cre mice (n = 20). Scale bars, 100 μm.
(E) Macroscopic images of small intestines from WT and Prkcifl/flPrkczfl/flVillin-cre mice. Red arrows denote tumors. Scale bar, 2 mm.
(F and G) Number of macroscopic tumors at different ages (F) and tumor size distribution (G) in small intestine (SI) and colon of Prkcifl/flPrkczfl/flVillin-cre mice. Each circle represents one mouse (n = 39).
(H) Gross images of colons from Prkcifl/flPrkczfl/flVillin-cre mice. Arrows denote tumors in ascending colons. Red dotted circle denotes mucin in tumor. Scale bars, 2 mm.
(I–L) Images of tubular adenocarcinoma (I), poorly differentiated adenocarcinoma (J), signet-ring cell carcinoma (K: H&E, top; Alcian blue and Ki67 double staining, bottom), and desmoplastic change (L) observed in Prkcifl/flPrkczfl/flVillin-cre intestines. Red arrows denote invasive tumor front. Scale bars, 100 μm.
Data are representative of or combined from ten independent experiments including male and female mice. Results are shown as mean ± SEM. ***p < 0.001, ****p < 0.0001. See also Figure S1.
Invasive adenocarcinoma includes not only a tubular adenocarcinoma component, but also poorly differentiated carcinoma (Figure 1J) or signet-ring cell carcinoma, which is morphologically characterized by abundant intracytoplasmic mucin that pushes the nucleus to the periphery as indicated by Ki67 and Alcian blue double-positive cells (Figure 1K). We also observed a severe desmoplastic change indicating the high aggressiveness of those tumors (Figure 1L). Considering that poorly differentiated mucinous and signet-ring cell appearances have been associated with the MSS and aggressive phenotypes of human serrated tumors, this strongly suggests that Prkcifl/flPrkczfl/flVillin-cre mouse tumors morphologically mimic MSS serrated human disease. Indeed, analysis of microsatellite repeat markers demonstrated that Prkcifl/flPrkczfl/flVillin-cre tumors were MSS (Figures S1E and S1F). We did not observe changes in the mRNA expression of representative DNA-MMR genes in these tumors (Figure S1G). In agreement with the positive association in human serrated tumors between MSS;MSI-L and CpG island methylator phenotype (CIMP)-low;CIMP-negative profiles, none of the markers defining CIMP was altered (Figure S1H). Furthermore, senescence was not detected in Prkcifl/flPrkczfl/flVillin-cre mouse intestines (Figure S1I). Similar to what has been reported in serrated tumors driven by KRAS or BRAF (Bennecke et al., 2010; Rad et al., 2013). Consistent with the notion that SSA/Ps are premalignant lesions, they showed increased expression of p53, p21, and p16, which all reverted when the tumors reached the carcinoma stage (Figure S1J). These results demonstrate that the simultaneous loss of PKCλ/ι and PKCζ in the intestinal epithelium leads to the development of SSA/Ps that further progress to MSS invasive carcinomas with a highly desmoplastic aggressive phenotype.
ERK but not WNT-β-catenin signaling is activated in Prkcifl/flPrkczfl/flVillin-cre intestinal epithelium
CRC generated through the serrated pathway differs from the conventional adenoma-carcinoma phenotype also from the signaling and genetic point of view. The genetic differences are characterized by mutations in the Wnt-β-catenin signaling pathway, which are much less frequent in serrated polyps (Fearon and Vogelstein, 1990). Neither SSA/Ps nor adenocarcinoma cells in Prkcifl/flPrkczfl/flVillin-cre tumors displayed an accumulation of nuclear β-catenin staining, whereas this was clearly observed in tumors from our previously reported Apcfl/+; Prkcifl/flVillin- cre mice (Nakanishi et al., 2016) (Figures 2A and 2B). Interrogation of the transcriptomic data from Prkcifl/flPrkczfl/flVillin-cre tumors revealed positive enrichment in MEK, EGFR, and KRAS signatures (Figure 2C). IHC of Prkcifl/flPrkczfl/flVillin-cre intestinal tissues demonstrated a strong activation of the ERK pathway, as determined by increased staining for phospho-ERK and phospho-EGFR (Figure 2D). Targeted genome sequencing did not identify any alterations in potential coding hot spots for mutations in the murine Braf (B637E) and Kras (G12D, G12V, and G13D) genes (not shown). This strongly suggests that the simultaneous inactivation of both aPKCs activates the ERK pathway independently of genetic alterations in Braf or Kras. Gene set enrichment analysis (GSEA) also revealed activation of the YAP pathway (Figure 2E), which was confirmed by IHC (Figure 2D). This could explain the activation of the ERK and EGFR pathways, because YAP has been shown to control the expression of several EGF family members (Gregorieff et al., 2015). The comparison of these transcriptomic data with recently reported gene signatures generated from human organoids from serrated lesions, tubular or tubulovillous adenoma, and MSI or MSS CRCs (Fujii et al., 2016) demonstrated that genes upregulated in the Prkcifl/flPrkczfl/flVillin-cre tumors positively correlated with the gene signatures of serrated and of MSS CRC (Figure 2F). Similarly, a gene signature from Prkcifl/flPrkczfl/flVillin- cre IECs was significantly upregulated when comparing human serrated tumors to conventional carcinomas, tubular adenomas, adenomatous polyps, or normal colon (Figure 2G). These two complementary approaches revealed that Prkcifl/flPrkczfl/flVillin-cre tumors are highly similar to human MSS serrated tumors at the transcriptional level.
Figure 2. Prkcifl/flPrkczfl/flVillin-cre tumors carry a distinct molecular signature which resembles human serrated tumors.

(A and B) β-catenin staining and quantification in the indicated types of intestinal tumors from Prkcifl/flPrkczfl/flVillin-cre or Apcfl/+; Prkcifl/flVillin-cre male mice (n = 3). Scale bar, 50 μm.
(C) GSEA plots of enrichment of the indicated gene signatures in Prkcifl/flPrkczfl/flVillin-cre tumor vs. wild-type (WT) intestine from male mice (n = 3), NES, normalized enrichment score; FDR, false discovery rate.
(D) Phospho-ERK, phospho-EGFR, and YAP staining in small intestines from male and female mice of the indicated genotype (n = 3). Scale bars, 25 μm.
(E) GSEA plot of Prkcifl/flPrkczfl/flVillin-cre tumor vs. WT intestine from male mice (n = 3).
(F) GSEA of transcriptomic data from RNA-seq on Prkcifl/flPrkczfl/flVillin-cre tumors vs. WT intestine from male mice (n = 3).
(G) GSEA of enrichment of the Prkcifl/flPrkczfl/flVillin-cre mouse gene set in human serrated datasets.
Data are representative of three independent experiments (A, B, D) or of one experiment of three individual mice (C, E-G). Results are shown as mean ± SEM. ****p < 0.0001. See also Figure S2.
Intestinal immunosuppression and stromal activation in Prkcifl/flPrkczfl/flVillin-cre mice
The combined loss of both aPKCs in IECs promoted a synergistic increase in cell proliferation that correlated with the spontaneous generation of serrated tumors (Figure S2A). Prkcifl/flVillin- cre intestinal epithelia also displayed increased cell death, which was significantly lower in Prkcifl/flPrkczfl/flVillin-cre than in Prkcifl/flVillin-cre tumors (Figures S2B and S2C). The reduction in cell death in Prkcifl/flPrkczfl/flVillin-cre tumors might explain why these mice developed cancer whereas Prkcifl/flVillin-cre mice did not, and were unable to go beyond the preneoplastic stage. There was a robust infiltration of CD45+ cells in Prkcifl/flVillin-cre, but not in Prkczfl/flVillin-cre, tissues (Figure 3A). This infiltration was synergistically increased in Prkcifl/flPrkczfl/flVillin-cre SSA/Ps and carcinomas (Figure 3A), which indicates that the simultaneous loss of both aPKCs in the intestinal epithelium triggers an immunological response that could be critical for the tumorigenic phenotype of Prkcifl/flPrkczfl/flVillin-cre mice. We posited that the immune microenvironment in Prkcifl/flPrkczfl/flVillin-cre mice might be permissive to the development of spontaneous serrated CRC. Prkcifl/flVillin-cre intestinal tissue displayed significantly higher infiltration of CD8+ T cells than WT tissue (Figure 3B), suggesting that the loss of PKCλ/ι results in the activation of a CD8+-driven immune response. However, CD8+ T cells were excluded from the SSA/Ps and carcinoma areas of the Prkcifl/flPrkczfl/flVillin-cre mice (Figures 3B and S3A). We also observed a dramatic expression of PD-L1 in the CD45+ cells in Prkcifl/flPrkczfl/flVillin-cre tumors (Figure 3C). The proportion of CD8+ T cells was increased in Prkcifl/flVillin-cre intestinal tissue and decreased to normal in Prkcifl/flPrkczfl/flVillin-cre tumors (Figure 3D), whereas the proportion of PD-L1+;CD45+ cells was specifically increased in Prkcifl/flPrkczfl/flVillin-cre tumors (Figure 3E). Prkcifl/flPrkczfl/flVillin-cre tumors also showed a significant increase in the proportion of Foxp3+ Treg cells (Figure 3F), which resulted in a robust enhancement of the Treg:CD8+ ratio in the tumor (Figure 3G). We also observed a significant increase in the proportion of IL-17A- producing CD4+ T cells (Th17 cells) in Prkcifl/flPrkczfl/flVillin-cre tumors (Figure 3H). Moreover, these tumors showed a drastic accumulation of CD11b+ myeloid cells (Figure 3I), including both Ly6ChighLy6G− monocytic cells and Ly6C+Ly6G+ polymorphonuclear cells (Figure 3J). These populations are reminiscent of monocytic (M-MDSC) and granulocytic (G-MDSC) myeloid- derived suppressor cells, respectively. However, the proportion of total CD4+ T, B220+ B, and NK1.1+ NK cells did not change (Figure S3B). These data suggest that Prkcifl/flPrkczfl/flVillin-cre tumors exhibit an immunosuppressive microenvironment that inhibits the CD8+ T cell response allowing preneoplastic cells to progress to malignancy through the serrated pathway.
Figure 3. Prkcifl/flPrkczfl/flVillin-cre tumors display an immunosuppressive phenotype.

(A–C) Staining for CD45 (A), CD8 (B), and CD45 and PD-L1 (C) in small intestines from mice of the indicated genotypes and lesions, and quantification (n = 3). Red lines mark the tumor (T) border.
(D–J) Flow cytometry analyses of immune cell populations from mice of the indicated genotypes. Percentage of CD8+ T cells (D), PD-L1+ (E), Treg cells (Foxp3+CD4+TCR-β+; F) in CD45+ cells; ratio of Treg cells to CD8+ T cells (G); percentage of IL-17A–producing cells in CD4+ T cells (H); percentage of CD11b+ (I) and CD11b+Ly6ChighLy6G− and CD11b+Ly6C+Ly6G+
(J) cells in CD45+ cells. (n: WT = 7, Prkcifl/flVillin-cre = 8, and Prkcifl/flPrkczfl/flVillin-cre tumor = 4).
(K–M) αSMA (K) and Masson’s trichrome (L) staining, and Ereg in situ hybridization (M) in small intestines from mice of the indicated genotypes and lesions (n = 3).
Data are representative of ten independent experiments (A-C, K-M) or combined from six independent experiments (D-J). Male and female mice were used. Results are shown as mean ± SEM. *p < 0.05, **p < 0.01, ***p < 0.001, ****p < 0.0001. Scale bars, 25 μm. See also Figure S3.
Prkcifl/flPrkczfl/flVillin-cre intestinal lesions showed enhanced expression of α-smooth muscle actin (SMA), a bona-fide marker of cancer-associated fibroblasts, with the highest expression in carcinomas (Figure 3K). This stromal response was accompanied by increased expression and deposition of collagen in tumor areas (Figures 3L and S3C) and enrichment of TGF-β-dependent transcripts (Figure S3D). Prkcifl/flPrkczfl/flVillin-cre tumors showed upregulation of transcripts related to stromal activation and stroma-derived growth factors, such as the ligands for EGFR, Areg, and Ereg (Figure S3E), which was confirmed by in situ hybridization for Ereg (Figure 3M). Furthermore, GSEA of Prkcifl/flPrkczfl/flVillin-cre tumor transcripts revealed that the gene signature of the epithelial mesenchymal transition (EMT) was positively enriched (Figure S3F). These results, together with the increased immunosuppressive phenotype and inhibition of CD8+ T cell infiltration in Prkcifl/flPrkczfl/flVillin-cre tumors, demonstrate that the loss of both aPKCs in IECs results in the induction of an intestinal microenvironment conducive to cancer.
Intestinal inflammation drives serrated tumorigenesis
Treatment of Prkcifl/flPrkczfl/flVillin-cre mice with a combination of broad-spectrum antibiotics, which abolish intestinal inflammation and the immune response (Nakanishi et al., 2016), decreased the infiltration of CD45+ cells (Figures 4A–4C). This treatment also significantly abrogated tumorigenesis (Figures 4D and 4E). This effect was accompanied by a decrease in the number of Ki67+ cells and a reduction in phospho-ERK and YAP staining (Figures 4F and 4G). Similar to Prkcifl/flPrkczfl/flVillin-cre mice, Prkcifl/flVillin-cre mice had increased crypt cell proliferation and CD45+ cell infiltration, as well as the augmented expression of phospho-ERK and YAP, which was reverted to normal levels by antibiotic treatment (Figures S4A–S4C). However, Prkcifl/flPrkczfl/flVillin-cre mice developed spontaneous serrated tumors and Prkcifl/flVillin-cre mice did not (Figure 1). Therefore, although serrated tumorigenesis depends on an inflammation-driven process, inflammation is not sufficient. The lack of PKCζ in the Prkcifl/flPrkczfl/flVillin-cre intestinal epithelium provides additional alterations that are required for tumor development.
Figure 4. CD8+ T cells repress serrated tumorigenesis in Prkcifl/flPrkczfl/flVillin-cre mice.

(A and B) CD45+ staining (A) and quantification (B) in small intestines from WT and Prkcifl/flPrkczfl/flVillin-cre male mice with or without antibiotic (Abx) treatment (n = 3).
(C) Flow cytometry analyses of CD45+ cell populations from WT and Prkcifl/flPrkczfl/flVillin-cre male mice in the Abx experiment (n: WT Ctrl = 8, WT Abx-treated = 5, Prkcifl/flPrkczfl/flVillin-cre Ctrl = 4, and Prkcifl/flPrkczfl/flVillin-cre Abx-treated = 3).
(D) Quantification of the total numbers of tumors in small intestine and colon, and stratification of small-intestinal tumor numbers according to size in Prkcifl/flPrkczfl/flVillin-cre male mice in the Abx experiment. (n: Ctrl = 6 and Abx-treated = 7).
(E–G) H&E staining (E) and Ki67, phospho-ERK, and YAP staining (F) of small-intestinal tumors from Prkcifl/flPrkczfl/flVillin-cre male mice in the Abx experiment, and quantification of Ki67 staining (G). Scale bars, 100 μm.
(H) Flow cytometry analyses of CD8+ T cells from WT and Prkcifl/flVillin-cre male mice treated with or without αCD8 antibody (n: WT = 3, Prkcifl/flVillin-cre = 6, and Prkcifl/flVillin-cre αCD8 antibody–treated = 7).
(I) Macroscopic images of Prkcifl/flVillin-cre small intestines treated in the CD8-depletion experiment. Red arrow denotes tumor. Scale bar, 2 mm.
(J and K) Quantification of incidence (J) and total number (K) of small-intestinal tumors in the CD8-depletion experiment (n = 7).
(L and M) H&E, Ki67, cleaved caspase 3 (C-Caspase3), TUNEL, and Masson’s trichrome staining of small-intestinal samples from mice of the indicated genotypes and treatment (L), and quantification (M) (n = 3–5). Scale bars, 100 μm.
Data are representative of or combined from two independent experiments. Results are shown as mean ± SEM. *p < 0.05, **p < 0.01, ***p < 0.001, ****p < 0.0001. See also Figure S4.
Lack of a CD8+ T cell response mediates tumorigenesis driven by the serrated pathway
We hypothesized that enhanced accumulation of CD8+ T cells would account for the inability of Prkcifl/flVillin-cre mice to develop spontaneous tumors. We predicted that CD8+ depletion in vivo should promote serrated tumorigenesis in Prkcifl/flVillin-cre mice to an extent comparable to that in Prkcifl/flPrkczfl/flVillin-cre. Administration of a neutralizing anti-CD8 antibody effectively depleted approximately 70% of infiltrating CD8+ T cells (Figure 4H) and recapitulated the serrated tumor phenotype of Prkcifl/flPrkczfl/flVillin-cre mice (Figures 4I–4K). Similar to Prkcifl/flPrkczfl/flVillin-cre, Prkcifl/flVillin-cre tumors induced by depletion of CD8+ T cells displayed the cytomorphologic features of SSA/Ps, including the development of adenocarcinoma (Figure 4L), as well as increased proliferation, reduced cell death, and enhanced stromal activation (Figures 4L and 4M). Therefore, the lack of a CD8+T cell response in Prkcifl/flPrkczfl/flVillin-cre IECs underlies the spontaneous initiation of intestinal serrated tumors. In this context, the fact that cell death is reduced in Prkcifl/flPrkczfl/flVillin-cre tumors that are devoid of CD8+ T cell infiltration suggests that, whereas increased cell death and the ensuing inflammation are important for tumor initiation, cell death has to be reduced for tumors to develop. Therefore, a break in immunosurveillance contributes to the reduction in cell death in Prkcifl/flPrkczfl/flVillin-cre tumors, which allows these mice to develop cancer.
Impaired Interferon response in Prkcifl/flPrkczfl/flVillin-cre intestinal epithelial cells
To understand why Prkcifl/flPrkczfl/flVillin-cre IECs impair the CD8+ T cell response and drive serrated tumor initiation, we first focused our attention on the pathways whereby the loss of PKCλ/ι in IECs promotes the CD8+ T cell response. One key characteristic of the PKCλ/ι- deficient IECs is increased cell death (Nakanishi et al., 2016), which might initiate a CD8+ T cell response linked to immunogenic cell death (ICD)(Galluzzi et al., 2017). The RNA-Seq data demonstrated the upregulation of several danger signals that conform the ICD response (Figure 5A), along with ATP secretion (Figure 5B). In keeping with these data, PKCλ/ι-deficient mouse intestinal epithelial cell line MODE-K cells showed increased apoptosis in response to several ICD stimuli (Figures 5C and S5A) suggesting that IECs are more prone to undergo ICD in the absence of PKCλ/ι. The interferon pathway is also a critical cascade responsible for CD8+ T cell-mediated anti-tumor immunity (Parker et al., 2016). MODE-K cells deficient for PKCλ/ι showed a stronger induction of interferon related transcripts including Cxcl10, an essential chemokine for CD8+ recruitment (Figure 5D). Since the interferon response regulates antigen presentation, we next analyzed the expression of MHC class I proteins by flow cytometry. Loss of PKCλ/ι increases significantly the expression of both H-2Kk and H-2Dk heavy chains at the surface of MODE-K cells (Figure 5E). All these data point to a higher CD8+ T cell response in the absence of PKCλ/ι. To strenghten these results, we performed a CD8+ T cell mediated cytotoxicity assay using MC38 cells expressing the model antigen ovalbumin (OVA) as target cells, and CD8+ T cells isolated from OT-I mice as specific effector cells. The lack of PKCλ/ι in MC38 cells increased significantly the OT-I cells mediated killing (Figure 5F) demonstrating that the loss of PKCλ/ι in intestinal epithelial cells promotes the CD8+ T cell response.
Figure 5. Suppression of the interferon response by PKCζ loss impairs CD8+-dependent immunosurveillance.
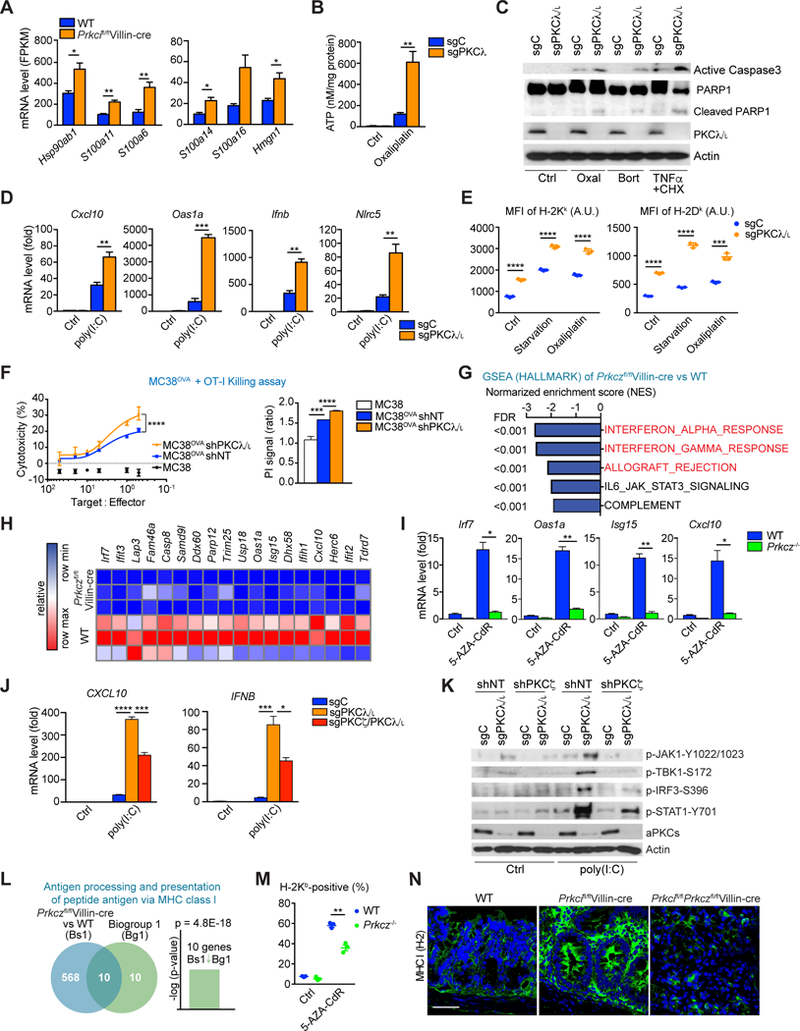
(A) mRNA expression for the indicated genes in Prkcifl/flVillin-cre vs. WT IECs from RNA-seq data.
(B) Extracellular ATP levels in sgC and sgPKCλ/ι MODE-K cells treated with Oxaliplatin for 24 hr (20 µM).
(C) Western Blot of indicated proteins in sgC and sgPKCλ/ι MODE-K cells treated for 24 hr with Oxaliplatin (20 µM), Bortezomib (0.1 µM) or TNFα (10 ng/ml) plus cycloheximide (2.5 µg/ml).
(D) qRT-PCR analyses of Cxcl10, Oas1a, Ifnb, and Nlrc5 mRNA levels in MODE-K of the indicated genotypes transfected with 0.5 µg/ml of poly(I:C) or mock transfected for 6 hr.
(E) Surface expression (mean fluorescence intensity, MFI) of H-2Kb and H-2Dk in MODE-K cells of the indicated genotypes either HBSS-starved or treated with Oxaliplatin (20 µM) for 24 hr.
(F) OT-I cells-MC38OVA killing assay (24 hr) at the indicated T:E ratios (left). PI staining in shNT and sgPKCλ/ι MC38OVA cells after coculture with OT-I cells for 24 hr (right).
(G) GSEA of transcriptomic data from RNA-seq on Prkczfl/flVillin-cre vs. WT IECs. The indicated gene signatures were applied to the analyses. FDR, false discovery rate.
(H) Heatmap of RNA-seq data of WT and Prkczfl/flVillin-cre IECs representing the genes related to interferon response differentially expressed between genotypes.
(I) qRT-PCR analyses of Irf7, Oas1a, Isg15, and Cxcl10 mRNA levels in organoids of the indicated genotypes with or without 5AZA-CdR treatment.
(J) qRT-PCR analyses of CXCL10 and IFNB mRNA levels in 293T cells of the indicated genotypes transfected with 0.5 µg/ml of poly(I:C) or mock transfected for 6 hr.
(K) Western blot of indicated proteins in 293T cells of the indicated genotypes transfected with 0.5 µg/ml of poly(I:C) or mock transfected for 6 hr.
(L) NextBio analysis of genes differentially expressed in Prkczfl/flVillin-cre vs. WT IECs. Venn diagram show the number of common and unique genes in both sets. Gene signatures corresponding to GO terms “antigen processing and presentation of peptide antigen via MHC class l”.
(M) Flow cytometry analysis of H-2Kb–positive cell population in organoids of the indicated genotypes with or without 5-AZA-CdR treatment.
(N) MHC I (H-2) staining in small intestines from mice of the indicated genotypes. Scale bar, 50 μm.
Data represent the mean ± SEM of three individual female mice per group for one experiment (A). Data are combined from three (B, D-F, J, M) or two (I) independent biological replicates or representative of two independent experiments (C, K). Data are representative of one (G, H, L) of three individual male and female mice or of three (N) independent experiments of three individual male mice. Results are shown as mean ± SEM. *p < 0.05, **p < 0.01, ***p < 0.001, ****p < 0.0001. See also Figure S5.
Then, we investigate how the loss of PKCζ could impair the CD8+ T cell response induced by the loss of PKCλ/ι. Transcriptomic data analysis revealed that the “INTERFERON_ALPHA_RESPONSE” and “INTERFERON_GAMMA_RESPONSE” were highly downregulated gene signatures in the Prkcifl/flPrkczfl/flVillin-cre tumors as compared with WT tissues (Figure S5B). However, this analysis did not establish whether the defect in the interferon pathway is a direct consequence of the deletion of the aPKCs in the IECs or whether it involves some other infiltrating cell type in the tumor. Transcriptomic analysis of IEC samples from WT, Prkcifl/flVillin-cre, Prkczfl/flVillin-cre and Prkcifl/flPrkczfl/flVillin-cre mice, showed “INTERFERON_ALPHA_RESPONSE” and “INTERFERON_GAMMA_RESPONSE” as the most downregulated gene signatures in Prkcifl/flPrkczfl/flVillin-cre IECs as compared to Prkcifl/flVillin-cre IECs (Figure S5C). Furthermore, these two signatures were also the most downregulated in Prkczfl/flVillin-cre IECs when compared with WT IECs (Figure 5G). We also observed a decrease in interferon-responsive genes in Prkczfl/flVillin-cre IECs when compared with WT, and in Prkcifl/flPrkczfl/flVillin-cre compared with Prkcifl/flVillin-cre (Figures 5H and S5D). These data establish that the loss of PKCζ contributes to serrated tumorigenesis by suppressing the interferon cellular response in a cell autonomous manner. To further strengthen this conclusion, we carried out a series of ex vivo experiments using 3D cultures of WT or Prkcz−/− organoids. DNA methyltransferase inhibitors (DNMTi) have recently been used to transcriptionally upregulate human endogenous activators of the double-stranded RNA sensing pathway that culminates in the stimulation of the Type I and III interferon responses (Chiappinelli et al., 2015). We incubated both types of organoids with the DNMTi 5-aza-2-deoxycytidine (5-AZA-CdR) for 24 h, followed by cell culture in the absence of this drug. 5-AZA-CdR treatment robustly induced the expression of the key interferon-responsive genes Irf7, Oas1a, Isg15, and Cxcl10 in WT but not in Prkcz−/− organoids (Figure 5I). These results demonstrate that PKCζ in IECs is required for the endogenous activation of the interferon pathway ex vivo. The genetic deletion of PKCζ in the context of PKCλ/ι-deficient cells severely inhibited the expression of interferon transcripts (Figure 5J) and that of key elements in the interferon signaling cascades (Figure 5K) that are hyperactivated in PKCλ/ι-deficient cells. We also observed the negative enrichment of the “ALLOGRAFT_REJECTION” signature in the Prkczfl/flVillin-cre IECs (Figure 5G). NextBio analysis of genes downregulated in the Prkczfl/flVillin-cre IECs revealed significant correlations with the GO term “antigen processing and presentation of peptide antigen via MHC class I” (Figure 5L). Accordingly, the stimulation with 5-AZA-CdR upregulated MHC class I long-chain H-2Kb on the surface of WT but not on Prkcz−/− organoids (Figure 5M), demonstrating a defect in antigen presentation under PKCζ-deficient condition. Moreover, IHC analysis demonstrated in intestinal tissues the upregulation of MHC class I marker in Prkcifl/flVillin-cre mice that was completely abrogated in Prkcifl/flPrkczfl/flVillin-cre mice (Figure 5N). These results establish that PKCζ is a critical player in the control of the interferon response in IECs and support the notion that an impaired interferon response in the Prkcifl/flPrkczfl/flVillin-cre mice accounts for the defect in CD8+ infiltration and the spontaneous development of intestinal serrated tumors.
Combined treatment with TGF-β receptor inhibitor and anti-PD-L1 blocks serrated tumorigenesis in Prkcifl/flPrkczfl/flVillin-cre mice
To therapeutically exploit the increased infiltration of Prkcifl/flPrkczfl/flVillin-cre tumors by PD- L1+;CD45+ cells, these mice were treated with an anti-PD-L1 for 3 weeks, starting at 10 weeks of age (Figure S6A). This treatment resulted in a robust reduction in the number, average size, and total load of tumors, as well as in cancer incidence, which correlated with a concomitant increase in the recruitment of CD8+ cells into the tumor areas (Figures S6B–S6D). However, anti-PD-L1 treatment did not show any therapeutic effect when mice were treated starting at 13 weeks of age (Figure S6E), at which point they presented with a more advanced tumor burden and increased tumor aggressiveness (Figures S6F–S6H). Thus, once serrated tumors are established and are more aggressive, they become resistant to anti-PD-L1 therapy. One of the characteristics of the advanced Prkcifl/flPrkczfl/flVillin-cre tumors is a high desmoplastic response, which has been proposed to be critical for CRC progression towards high malignancy (Calon et al., 2015; Isella et al., 2015). Tumors from 16-week-old Prkcifl/flPrkczfl/flVillin-cre mice showed increased expression of αSMA and collagen deposition when compared with tumors from 13- week-old mice (Figure S6I), suggesting the potential contribution of an activated stroma to the resistance of these mice to therapy. We next tested whether the strong stromal response of serrated Prkcifl/flPrkczfl/flVillin-cre tumors might be central to progression and the acquisition of a more aggressive phenotype. Because stromal activation in CRC relies on TGF-β signaling (Calon et al., 2015), we treated 10-week-old Prkcifl/flPrkczfl/flVillin-cre mice with the TGF-βR1- specific inhibitor galunisertib (LY2157299) (Figure 6A). Although this treatment did not reduce the tumor number, size, or load (Figure 6B), it suppressed the progression of SSA/Ps to the adenocarcinoma stage, and especially reduced the incidence of invasive cancer (Figures 6C and 6D). Consistent with the well-established role of TGF-β in stromal activation, treatment with galunisertib resulted in the inhibition of stromal phospho-SMAD2 and collagen deposition (Figure 6D), as well as in the reduced expression of TGF-β-responsive genes, such as Angptl2, Cdkn2b, Il11, and Ereg (Figure 6E). Flow cytometric analyses demonstrated a reduction in the proportion of Th17 cells in the tumors upon this treatment (Figure 6F), which is consistent with the crucial role of TGF-β in Th17 cell differentiation (Mangan et al., 2006). However, this treatment did not significantly change the proportions of CD8+ T, Treg, or CD11b+ myeloid cells (Figures 6G–6J).
Figure 6. Combined TGF-β receptor inhibition with anti-PDL1 blocks tumorigenesis in Prkcifl/flPrkczfl/flVillin-cre mice.

(A) Experimental design for galunisertib (Gal) treatment.
(B and C) Quantification of the total number, average size, and load of small-intestinal tumors and incidence of cancer and invasive cancer (C) in Prkcifl/flPrkczfl/flVillin-cre mice in the Gal experiment. (n: Ctrl = 8 and Gal-treated = 6).
(D) H&E, Masson’s trichrome, phospho-Smad2, and CD45 and PD-L1 double staining in small- intestinal tumors from Prkcifl/flPrkczfl/flVillin-cre mice in the Gal experiment. Scale bars = 100 μm.
(E) qRT-PCR analyses of Angptl2, Cdkn2b, Il11, and Ereg mRNA levels in the Gal experiment (n: WT = 3, Prkcifl/flPrkczfl/flVillin-cre Ctrl = 4, and Prkcifl/flPrkczfl/flVillin-cre Gal-treated = 5).
(F–J) Flow cytometry analyses of immune cell populations in Prkcifl/flPrkczfl/flVillin-cre tumors in the Gal experiment. Percentage of IL-17A–producing cells in CD4+ T cells (F); percentage of CD8+ T cells (G) and Foxp3+CD4+ Treg cells (H) cells in CD45+ cells; ratio of Treg to CD8+ T cells (I); and percentage of CD11b+, CD11b+Ly6ChighLy6G−, and CD11b+Ly6C+Ly6G+ cells in CD45+ cells (J). (n: Ctrl = 4 and Gal-treated = 3 Prkcifl/flPrkczfl/flVillin-cre).
(K and L) Quantification (K) and images (L) of CD45;PD-L1 staining in Prkcifl/flPrkczfl/flVillin-cre tumors in Gal experiment. Scale bar, 100 μm. White arrows: CD45+;PD-L1+.
(M) Experimental design for a combination therapy with an αPD-L1 antibody and Gal.
(N and O) Quantification of the total number, average size, and load of small-intestinal tumors and incidence of cancer and invasive cancer (O) in Prkcifl/flPrkczfl/flVillin-cre mice in the combination therapy experiment (M). (n: Ctrl = 6 and αPD-L1 + Gal–treated = 7 Prkcifl/flPrkczfl/flVillin-cre).
(P) H&E and CD8 staining in small-intestinal tumors from Prkcifl/flPrkczfl/flVillin-cre mice in thecombination therapy experiment (M). Dotted red lines outline tumors (T). Scale bars, 100 μm.
(Q–S) Flow cytometry analyses of immune cell populations in Prkcifl/flPrkczfl/flVillin-cre tumors in the combination therapy experiment. Percentage of CD8+ T (Q); Foxp3+CD4+ Treg (R); and CD11b+, CD11b+Ly6ChighLy6G−, and CD11b+Ly6C+Ly6G+ (S) cells in CD45+ cells. (n: Ctrl = 5 and αPD-L1 + Gal–treated = 4 Prkcifl/flPrkczfl/flVillin-cre).
Data represent the mean ± SEM of three to eight individual male mice per group for one experiment per treatment. *p < 0.05, **p < 0.01. See also Figure S6.
The proportion of PD-L1+;CD45+ cells infiltrating Prkcifl/flPrkczfl/flVillin-cre tumors was not affected by galunisertib (Figures 6K and 6L), which could explain why this treatment did not restore the infiltration of CD8+ T cells. It also suggests that the activated stroma contributes to the tumorigenesis of Prkcifl/flPrkczfl/flVillin-cre mice by promoting tumor progression but is not critical for the initiation of serrated tumors, which is mediated by inactivation of the CD8+ T cell response. When a parallel cohort of 23-week-old Prkcifl/flPrkczfl/flVillin-cre mice were treated with a combination of galunisertib and anti-PD-L1 (Figure 6M), there was a reduction in the number, size, load, and aggressiveness of tumors (Figures 6N–6O), with a concomitant increase in CD8+ T cell infiltration into the tumors (Figures 6P and 6Q). However, there were no changes in the proportion of Treg cells, although there was a significant reduction in CD11b+ myeloid cells (Figures 6R and 6S). These results demonstrate that, although anti-PD-L1 therapy is not effective in more advanced and desmoplastic serrated cancer, these are rendered sensitive to anti-PD-L1 treatment when the progression of SSA/P to adenocarcinoma is blunted by suppressing TGF-β signaling.
Human serrated tumors display reduced expression of aPKCs
To establish the relevance of the aPKC loss in human serrated tumors, we first analyzed polyps that were pathologically classified as SSA/Ps or tubular adenoma (TA). SSA/Ps are considered to be the epithelial precursor lesions that will progress towards serrated CRC, whereas TAs follow the conventional CRC pathway (De Sousa et al., 2013) (Fearon and Vogelstein, 1990). We used an antibody that recognizes both aPKCs (Figure S7A) to immunostain 30 SSA/Ps and 30 TA samples, along with 20 controls from healthy individuals. The aPKC levels were significantly reduced only in SSA/Ps and not in TA samples (Figures 7A and 7B), which established the relevance of the aPKC loss in human serrated tumors. We next investigated whether low levels of both aPKCs correlated with serrated features in CRC samples by using bioinformatics to interrogate the large dataset from patients with colorectal adenocarcinoma in The Cancer Genome Atlas Network (TCGA). Because these CRC samples are genetically and morphologically heterogeneous and are not annotated for their precursor origin through the serrated or conventional pathway, we first stratified patients based on aPKC expression and performed GSEA with serrated or traditional adenoma gene signatures. Patients were classified according to the median expression of PRKCI and PRKCZ. This analysis demonstrated a significant positive enrichment of serrated gene signatures in the PRKCILowPRKCZLow group as compared with the PRKCIHiPRKCZHi group (Figure 7C). Next, we attempted to classify CRC patients based on molecular profiles. Although there have been multiple recent efforts to define different CRC molecular subtypes based on gene expression, we focused on the CCS (colon cancer subtypes) classification because this is the only one in which a subtype of tumors is clearly identified as having developed from serrated precursor lesions (De Sousa et al., 2013). This classification includes three subgroups: CCS1 represents chromosomal unstable; CCS2 is MSI;CIMP+; and CCS3 is largely MSS and relates to serrated tumors, including those with upregulation of stromal and EMT genes, and defines a subset of patients with the worst survival (De Sousa et al., 2013). The mRNA levels of both aPKCs were significantly reduced in the CCS3 subtype (Figures 7D, S7B, and S7C). Also, samples stratified by the expression of both aPKCs showed a marked segregation of patients by CCS classification. The CCS3 subtype was predominantly made up of the PRKCILowPRKCZLow group (Figures 7E, S7D, and S7E), which was associated with worse prognosis than the PRKCIHiPRKCZHi subgroup (7F and S7F), in keeping with the unfavorable prognosis associated with CCS3 patients. Stratification of TCGA patients according to their aPKC levels also validated the critical role of these kinases in the negative regulation of the EMT and of the KRAS and YAP pathways, as well as in TGF-β signaling activation (Figure 7G). Furthermore, analysis of CRC patients according to their KRAS or BRAF mutational status revealed the existence of a subset characterized as PRKCILowPRKCZLow that were also WT for BRAF and KRAS (Figure S7G). GSEA of the transcriptomes of these patients showed positive correlation with upregulated serrated and downregulated adenoma signatures, and a positive enrichment in EMT and inflammatory signatures (Figure S7H), in excellent agreement with the phenotype of the Prkcifl/flPrkczfl/flVillin- cre tumors. PRKCILowPRKCZLow samples that also had mutations in either KRAS or BRAF displayed a more mesenchymal and inflammatory phenotype than those that were mutant for either of these two oncogenes but were PRKCIHiPRKCZHi (Figures S7I and S7J). These results demonstrate that the simultaneous loss of both aPKCs in human CRCs generates an additional phenotype to that of the serrated KRAS or BRAF mutant group that is characterized by a stromal and inflammatory response. Therefore, the poorer prognosis of PRKCILowPRKCZLow patients (Figures 7F and S7F) could be accounted for by the EMT-inflammatory environments created by the inactivation of both aPKCs.
Figure 7. Human serrated tumors have reduced expression of both atypical PKCs.

(A and B) aPKC immunohistochemistry (A) and quantification (B) of human normal colon (n = 20), sessile serrated adenomas/polyps (SSA/Ps; n = 30), and tubular adenomas (TA; n = 30). Scale bars, 50 μm.
(C) GSEA plots in CRC patient samples from TCGA stratified based on PRKCI and PRKCZ expression levels.
(D) PRKCI and PRKCZ mRNA levels in the AMC-AJCCII-90 set (GSE33113) stratified by the CCS classification.
(E) Proportion of CRC patients with the CCS1, CCS2, or CCS3 CRC subtype according to aPKC mRNA expression (GSE33113).
(F) Kaplan-Meier overall survival curve of CRC patients (TCGA) stratified based on aPKC expression levels.
(G) GSEA of transcriptomic data of CRC samples (TCGA) stratified based on aPKC expression levels.
(H) GSEA of transcriptomic data from the indicated datasets of IBD patients. Normalized enrichment scores (NES) are shown. Fold changes (FC) of expression of PRKCI and PRKCZ comparing Crohn’s disease (CD) vs. healthy colon (Ctrl) or ulcerative colitis (UC) vs. Ctrl. FDR < 0.1 was considered significant. NS, not significant.
(I and J) aPKC and CD8 staining (I) and quantification (J) in human proximal CRCs (n: High aPKCs = 12, Low aPKCs = 13). Scale bars, 50 μm. Results are shown as mean ± SEM. *p < 0.05, **p < 0.01, ***p < 0.001, ****p < 0.0001. See also Figure S7.
The negative correlation between aPKC levels and the inflammatory response in CRC patients of the PRKCILowPRKCZLow group (Figures 7G and S7H–S7J) suggested a potential link between human intestinal inflammation and serrated tumorigenesis. To test this hypothesis, we interrogated human IBD datasets that included data from both CD and UC patients. The majority of datasets showed reduced levels of both aPKC transcripts, along with increased enrichment in the serrated, EMT, and inflammatory gene signatures in both types of IBD patients as compared with healthy individuals (Figure 7H). In contrast, the CCS3 subtype displayed an immunosuppressive phenotype characterized by lower levels of immune stimulatory molecules (especially when compared with the CCS2 [MSI;CIMP+] subtype) and increased levels of immunoinhibitory molecules, both of which were associated with reduced levels of PRKCI and PRKCZ (Figures S7K and S7L). The results from Prkcifl/flPrkczfl/flVillin-cre tumors described above demonstrated an immunosurveillance defect that accounts for serrated tumor initiation in the Prkcifl/flPrkczfl/flVillin-cre mouse model, characterized by the exclusion of CD8+ T cells from the Prkcifl/flPrkczfl/flVillin-cre tumors. In order to validate this phenotype in human patients, we used anti-CD8+ and anti-aPKC antibodies to immunostain a cohort of human CRC samples collected from proximal colons, where it is well established that SSA/Ps and serrated cancers are frequently located. Notably, CRC samples with low levels of aPKCs showed significantly lower infiltration of CD8+ T cells than those with high aPKC expression levels (Figures 7I and 7J). These results strongly support the notion that chronic inflammation is critical for the development of CRC through the serrated pathway, and that the loss of aPKC is a central event in that process through the development of an immunosuppressive phenotype.
DISCUSSION
We demonstrated here that the simultaneous deletion of PKCζ and PKCλ/ι in the mouse intestinal epithelium results in the development of SSA/Ps that progresses to advanced cancer with a strongly reactive and immunosuppressive stroma. We also found that human intestinal serrated tumors express low levels of PKCζ and PKCλ/ι, and we established a strong correlation between reduced expression of both aPKCs and the mesenchymal and immunosuppressive phenotypes of human CRCs, which also display poor prognosis. These findings shed light on the unique functions of the individual aPKCs in cooperatively suppressing intestinal serrated tumorigenesis, specifically of the subtype with poor prognosis and highly aggressive stroma and mesenchyme. Our study provides mechanistic insights into the development of serrated tumorigenesis that occurs independently of KRAS or BRAF mutation and highlights that the stromal and inflammatory response induced by aPKC deficiency confers aggressive and therapy-resistant phenotypes to serrated lesions irrespective of the KRAS or BRAF mutation status. This immunosuppressive environment constitutes a vulnerability of aPKC-deficient serrated tumors that we have shown can be exploited therapeutically.
Prkcifl/flPrkczfl/flVillin-cre mice exhibit an MSS profile whereas the expression of mutant BRAF in the mouse intestinal epithelium results in MSI-H tumors (Rad et al., 2013), and that of mutant KRAS gives an MSI-L;MSS phenotype (Bennecke et al., 2010), and. These observations are important clinically because MSI-H CRC patients have a better prognosis, and immunotherapy is only recommended for MSI or dMMR, and not for MSS CRCs (de la Chapelle and Hampel, 2010). Therefore, patients with serrated CRC harboring mutated KRAS, or lacking both PKCλ/ι and PKCζ, will be predictably resistant to immunotherapy-based strategies. We found that Prkcifl/flPrkczfl/flVillin-cre tumors, in addition to excluding CD8+ T cells, displayed a robust infiltration of CD45+;PD-L1+ cells, and that treatment of Prkcifl/flPrkczfl/flVillin-cre mice with anti-PD-L1 caused the tumors to regress, although this was only found when they were still at the initiation-adenoma stage. However, if the Prkcifl/flPrkczfl/flVillin-cre tumors are full-fledged adenocarcinomas, anti-PD-L1 therapy will only benefit by co-treatment with a TGF-β receptor inhibitor. Our results are reminiscent of data in a mouse liver metastasis model induced by organoids from a quadruple-mutant (Apc;Kras;Tgfbr2;Trp53) mouse model that mimics conventional CRC (Tauriello et al., 2018), in which targeting TGF-β was critical for therapy. However, there are also substantial differences between the two models. Whereas non-overtly established organoid-driven liver metastases responded to simple TGF-β receptor inhibition by promoting the infiltration of CD4+ T cells and markedly reduced the metastatic burden, this treatment was unable to restore the infiltration of CD8+ T cells or the regression of tumors in Prkcifl/flPrkczfl/flVillin-cre mice. Inhibition of the TGF-β pathway did reduce the infiltration of Th17 cells and impaired the most aggressive and invasive behavior of the Prkcifl/flPrkczfl/flVillin-cre tumors. This demonstrates that TGF-β signaling in the tumor microenvironment, although not relevant for the initiation of serrated CRC, is crucial for disease progression, and suggests that IL-17A-Th17 cells could be responsible for the malignization of SSA/Ps once stromal activation takes place.
These results establish a potential therapeutic approach for serrated-MSS CRCs, in which the levels of aPKCs could be used as a biomarker to segregate these patients. This would address one of the major clinical obstacles regarding serrated CRC: the detection of the precursor lesions (IJspeert et al., 2015). SSA/Ps are often flat and are frequently located in the proximal region (right sided), which makes them difficult to detect with the current screening methods until they have progressed to an advanced stage. At the same time, these lesions have a higher risk of developing into CRC and are particularly aggressive. Indeed, the primary tumor location was an independent prognostic factor in a multivariate analysis that included consensus molecular signature, microsatellite status, and BRAF and KRAS status (Lee et al., 2017). Rright-sided CRC demonstrated a worse overall survival than left-sided CRC, independent of the MSI and KRAS or BRAF mutation status (Lee et al., 2017). Our study provides key insights into the development of serrated CRC that occurs in the proximal region and offers an animal model that closely mimics the human disease, which is likely to help improve the understanding of this type of CRC. Our data also revealed a potential association between IBD and serrated tumorigenesis, because samples from patients with IBD were enriched for genes associated with serrated adenoma signatures, suggesting that these patients are at risk of developing this type of tumor. Moreover, we found that both aPKCs were reduced in this same cohort of IBD patients. Taken together, our results indicate that IBD patients may benefit from increased screening for SSA/Ps, and that analysis of the levels of aPKCs at initial IBD diagnosis may serve as a potential biomarker for those individuals that are at higher risk of developing serrated CRC. Our work suggests new avenues for the treatment of patients with IBD. Given our finding that broad-spectrum antibiotics could prevent the inflammation-driven induction of serrated tumorigenesis in Prkcifl/flPrkczfl/flVillin-cre mice, we propose that control of the microbial flora could help in preventing the development of serrated CRCs in IBD patients.
In summary, the results of our study have implications for understanding the processes involved in the initiation of serrated adenomas and cancers, including in the absence of KRAS or BRAF mutations, and provide insight into avenues for the detection and treatment of this poor-prognosis subtype of CRC.
STAR★ METHODS
CONTACT FOR REAGENT AND RESOURCE SHARING
Further information and requests for resources and reagents should be directed to and will be fulfilled by Jorge Moscat (jmoscat@sbpdiscovery.org).
EXPERIMENTAL MODEL AND SUBJECT DETAILS
Mice
Prkczfl/fl, Prkcifl/fl, Apcfl/fl, Villin-cre and Lgr5-EGFP-ires-creERT2 (Lgr5-creERT2) mice were previously described (Llado et al., 2015; Nakanishi et al., 2016). For CD8+ T cell mediated cytotoxicity assay, OT-I TCR Tg (OT-I) mice (Jackson Laboratory) were used between 8 and 12 weeks of age. All mouse strains were generated in a C57BL/6 background, and were born and maintained under pathogen-free conditions. Mice were sacrificed, and small intestines and colons were collected for analyses. Animal handling and experimental procedures conformed to institutional guidelines and were approved by the SBP Medical Discovery Institute Institutional Animal Care and Use Committee. All genotyping was done by PCR. Age- and sex-matched mice were used for all experiments. For antibiotic treatment, 10-week-old Prkcifl/flPrkczfl/flVillincre or Prkcifl/flVillin-cre mice were administered a combination of ampicillin (1 g/l), neomycin (1 g/l), metronidazole (1 g/l), and vancomycin (0.5 g/l) in drinking water for 6 or 4 weeks, respectively, until they were sacrificed. For CD8+ T cell depletion, 10-week-old Prkcifl/flVillin-cre mice were injected intraperitoneally with 200 μg of anti-CD8 antibody (clone 2.43) or control IgG twice a week for 5 weeks until they were sacrificed. For the TGF-βR1-specific inhibition experiment, 10-week-old Prkcifl/flPrkczfl/flVillin-cre mice were treated twice a day with a dose of 10 mg of galunisertib (Tauriello et al., 2018) per os for 6 weeks until they were sacrificed. Control mice were treated with vehicle. For checkpoint immunotherapy, either 10-week-old or 13-week-old Prkcifl/flPrkczfl/flVillin-cre mice were injected intraperitoneally with a dose of 10 mg/kg (body mass) of anti-PD-L1 antibody (clone 6E11) twice a week for 3 weeks until they were sacrificed. For the combination therapy of anti-PD-L1 antibody and TGF-βR1-specific inhibitor, 23-week-old Prkcifl/flPrkczfl/flVillin-cre mice were treated twice a day with a dose of 10 mg of galunisertib per os and injected intraperitoneally with a dose of 10 mg/kg (body mass) of anti-PD-L1 antibody twice a week for 3 weeks until they were sacrificed. Anti-PD-L1 antibody was provided by de Sauvage FJ (Genentech).
Human samples
We obtained paraffin-embedded tissue sections from samples obtained from 107 patients during colonoscopy or surgery. Normal healthy colon samples (male, n = 8, average age at diagnosis = 56, age range 23 – 88; female, n = 9, average at diagnosis = 58, age range 29 – 81). Proximal colon cancer samples (male, n = 7, average age at diagnosis = 73, age range 39 91; female, n = 18, average at diagnosis = 73, age range 45 – 91). SSA/Ps samples (male, n = 13, average age at diagnosis = 61, age range 50 – 72; female, n = 10, average at diagnosis = 59, age range 46 – 75). Tubular adenoma samples (male, n = 15, average age at diagnosis = 65, age range 39 – 83; female, n = 6, average at diagnosis = 53, age range 50 – 59). Written informed consent was obtained from all patients with the protocol approved by the Ethics Committee of Scripps Green Hospital. De-identified samples were sent to SBP Medical Discovery Institute and used for histological analyses. The study was approved by the IRB Committee of SBP Medical Discovery Institute.
Cell lines
293T cell line (sex: female) was obtained directly from ATCC. MODE-K cells (sex: female) and MC38OVA cells (sex: female) were kindly provided by Prof. Blumberg (Harvard Medical School, Boston, USA) and Prof. Fuchs (University of Pennsylvania, Philadelphia, USA) respectively.MC38 cell line (sex: female) was purchased from Kerafast. All cells were negative for mycoplasm.
METHOD DETAILS
Cell culture experiments
MODE-K cells, 293T and MC38OVA cells were cultured in DMEM (Cellgro, #15–017-CV) supplemented with 10% FBS, 2 mM of Glutamine and 100 U/ml penicillin and 100 µg/ml streptomycin, in an atmosphere of 95% air and 5% CO2. 293T sgPKCλ/ι were described previously (Nakanishi et al., 2016). For ATP measurement and immunogenic cell death western blots, cells were treated with Oxaliplatin (20 µM), Bortezomib (0.1 µm) or 10 ng/ml of TNFα (Sigma) and 2.5 µg/ml of CHX (Sigma) for 24 hr. Extracellular ATP levels were measured by the luciferin-based ATPlite Assay (Perkin Elmer) using Varioskan Lux reader (Thermo Fisher, as indicated by the manufacturer. For poly(I:C) treatment, cells were transfected with 0.5 ug/ml of poly(I:C) (InVivoGen) using Lipofectamine 2000 (Invitrogen). Cells for protein analysis were lysed in RIPA buffer (20 mM Tris-HCl, 37 mM NaCl, 2 mM EDTA, 1% Triton-X, 10% glycerol, 0.1% SDS, and 0.5% sodium deoxycholate), with phosphatase and protease inhibitors. Cell extracts were denatured, subjected to SDS-PAGE, transferred to PVDF membranes (GE Healthcare), and immunoblotted with the specific antibodies as listed in STAR methods Reagents table. To knock down PKCζ in 293T sgPKCλ/ι cells and PKCλ/ι in MC38OVA cells, TRC lentiviral shRNA targeting human PKCζ (TRCN0000001219) and TRC shRNA targeting mouse PKCλ/ι (TRCN000022757) were obtained from Open Biosystems. shRNA- encoding plasmids were co-transfected with psPAX2 (Addgene plasmid #12260; a gift from Dr. Didier Trono) and pMD2.G (Addgene plasmid #12259; a gift from Dr. Didier Trono) packaging plasmids into actively growing 293T cells by using XtremeGene HP transfection reagent (Roche). Virus-containing supernatants were collected 48 hr after transfection, filtered to eliminate cells, and then used to infect the target cells in the presence of 8 µg/ml polybrene (Millipore). Cells were analyzed after puromycin selection (1µg/ml) to confirm knockdown. To knock out PKCζ in 293T sgPKCλ/ι cells, lentiviral guide RNA plasmid targeting human PKCζ (BRDN0001149519) and lentiviral vector expressing Cas9 and blasticidin resistance were obtained from Addgene. Cells were treated virus-containing supernatants and selected with puromycin and blasticidin. Colonies from single cell were expanded and screened for PKCζ by immunoblotting. To knock out PKCλ/ι in MODE-K cells, a 20-nucleotide single-guide RNA (sgRNA) sequence targeting mouse PKCλ/ι was designed using the CRISPR design tool at http://crispr.mit.edu/. The sgRNA was cloned in the lentiCRISPR v2 vector (a gift from Feng Zhang) and transduced into MODE-K cells. Cells were selected with puromycin and colonies from single cell were expanded and screened for PKCλ/ι by immunoblotting.
Histology, immunohistochemistry, immunofluorescence, and in situ hybridization
Organs were isolated, rinsed in ice-cold PBS, fixed in 10% neutral buffered formalin overnight at 4 °C, dehydrated, and embedded in paraffin. Section s (5 μm) were stained with hematoxylin and eosin (H&E). For immunohistochemistry, sections were deparaffinized, rehydrated, and then treated for antigen retrieval. After blocking in Protein Block Serum-Free solutions (DAKO), tissues were incubated with primary antibody overnight at 4 °C followed by incubation with biotinylated secondary antibody. Endogenous peroxidase was quenched in 3% H2O2 in water for 10 min at room temperature. Antibodies were visualized with avidin-biotin complex (Vectastain Elite; Vector Laboratories) using diaminobenzidine as the chromagen. For immunofluorescence, fresh frozen organs were embedded in Tissue-Tek OCT compound (Sakura) and section of 10 μm were fixed in methanol, washed with PBS and then incubated with the primary antibodies. Washed sections were incubated with Alexa-conjugated secondary antibodies (Life Technologies) and examined with a Zeiss LSM 710 NLO Confocal Microscope. In situ hybridization for murine Ereg was carried out using RNAscope Multiplex Fluorescent Assay kit (Advanced Cell Diagnostics) following manufacturer’s instructions. The probe corresponding to CDS region of murine Ereg (Accession #: NM_007950.2, probe region: 116– 1496; Advanced Cell Diagnostics; Cat#: 437981). Cell death was analyzed using the In-Situ Cell Death Detection kit, TMR red (Thermo) for TUNEL. Masson’s Trichrome staining was carried out following manufacturer’s instructions (Sigma HT15–1KT).
Flow cytometry analysis
Flow cytometry experiments were performed using fresh small intestinal tissue and organoid preparations. For the analyses of small intestinal tissue, a half part of duodenum, jejunum, and ileum was used for quantitative flow cytometry analysis of immune cell population of lamina propria. Briefly, small intestines were rinsed in cold PBS, minced into small pieces, incubated in HBSS with EDTA (5 mM) and digested with collagenase (0.05 mg/ml) for 30 min at 37 °C, followed by a discontinuous Percoll separation method (40 and 75%) to purify immune cells. The cells concentrated at the interface were collected and washed in cold PBS. Red blood cells were removed with lysing buffer (BD Pharm Lyse) and live cells were counted using Trypan blue and then saturated with mouse Fc Block (purified anti-mouse CD16;CD32; 1:50; clone 2.4G2; BD Pharmingen) 30 min at 4°C before incubating with specific dyed antibodies.
For IL-17A intracellular staining, cells were pretreated with 50 ng/ml of phorbolmyristate acetate and 500 ng/ml of ionomycin in the presence of 10 µg/ml of brefeldin A for 3 hr at 37°C 5% CO2. Cells were then stained with specific extracellular antibodies, permeabilized with Fixation/Permeabilization solution kit (BD Cytofix-Cytoperm) according to manufacturer’s instructions and finally incubated with anti-IL-17A (clone TC11–18H10; BD Pharmingen) specific antibody in Perm-Wash buffer overnight at 4°C. For FOXP3 intracellular staining, cells were stained with specific extracellular antibodies, permeabilized with the same BD Cytofix-Cytoperm kit and finally stained with anti-FOXP3 (clone FJK-16s) specific antibody in Perm-Wash buffer overnight at 4°C.
For generation of small intestine organoids, organoids were collected in ice-cold TrypLE solution (Life Technologies) to remove Matrigel, then pipetted 5 cycles and incubated 5 min at 37°C to obtain single-cell suspension. Cells were w ashed twice in PBS 3% FBS and resuspended at room temperature with PBS with 100 µg/ml DNase I for 10 min before staining with anti-H-2Kb (clone AF6–88.5.5.3; eBioscience). For antigen presentation in MODE-K cells, cells were washed in PBS, trypsinized and wash with warm medium. Then, cells were resuspended and stained with anti-H-2Kk (clone 36–7-5; BioLegend) and anti-H-2Dk (clone 15– 5-5; BD Pharmingen). Dead cells were excluded after 7-AAD staining. All flow cytometry experiments were performed on a BD LSRFortessa 14-colors analyzer at the Sanford Burnham Prebys Medical Discovery Institute Shared FACS Facility and flow cytometry data were analyzed using FlowJo software (Tree Star Inc.).
For T cell killing assay of MC38MOVA cells, CD8+ T cells were isolated from the spleen of OT-I mice by magnetic sorting using EasySep Mouse CD8+ T Cell Isolation Kit (Stemcell Technologies) according to the manufacturer’s instructions. To generate effector cells, naïve T cells were cultured at 106/mL for 3 days with immobilized anti-CD3 (10 µg/mL) and soluble anti- CD28 (5 µg/mL) (Bio X Cell). After 3 days, effector CD8+ T cells were co-cultured with 1×10⁴ OVA-expressing MC38 target cells (shNT and shλ/ι) or MC38 target cells at different ratios (2:1; 1:1; 1:2 ; 1:10; 1:20; 1:50) for 24 hr at 37°C, 5% CO2. MC38 cell line was used as a negative control. The supernatants were harvested and analyzed using a Pierce LDH Cytotoxicity Assay Kit (Thermo Scientific) to determine the specific cytotoxicity according to the manufacturer’s instructions. For the PI staining, 100µM propidium iodide was added to the culture medium when the OT-I cells were added. PI signal was measured 24 hr after coculture with OT-I cells using a Varioskan LUX multimode microplate reader (ThermoFisher Scientific).
Intestinal epithelial cell isolation and small intestinal organoid culture
Intestinal epithelial cell (IEC) isolation was performed as described previously with some modification (Llado et al., 2015). Briefly, small intestines were removed, washed with cold PBS without magnesium chloride and calcium (PBS−/−) opened longitudinally, cut into 5 mm fragments, and then washed several times with cold PBS−/− until clean. Cut tissue fragments were incubated with PBS−/− EDTA (5 mM) containing 10% FBS for 40–60 min at 4°C. IECs were then mechanically separated from the connective tissue by rigorous shaking, and then filtered through a 100-µm mesh into a 50 ml conical tube to remove tissue fragments. Isolated IECs were pelleted and then lysed for RNA or protein extraction. For small intestine organoid culture, we collected small intestinal adenoma tissues from Lgr5-creERT2;Apcfl/fl (WT) or Lgr5- creERT2;Apcfl/fl;Prkczfl/fl (Prkcz−/−) mice injected with tamoxifen (sigma) intraperitoneally. Isolated adenoma tissues were minced into small pieces and incubated in digestion buffer (Dulbecco’s modified Eagle medium with 10% FBS, penicillin-streptomycin, 1 mg/ml collagenase type Xl, 0.1 mg/ml DNase l, 10 μM Y-27632) for 15–20 min at 37°C. The digested aden oma fragments were washed with PBS−/− and then filtered through a 100-μm mesh into a 50-ml conical tube to remove stromal fragments. Adenoma fragments were counted after isolation and a total of 250– 500 fragments were mixed with 100 μl of growth factor reduced-Matrigel and plated in 12- or 24- well plates. After polymerization of Matrigel, 1 ml of culture medium (Advanced DMEM-F12 containing 10 mM HEPES, 1X Glutamax, 1X B27 supplement, 50 ng/ml EGF and 10 μM Y- 27632) was added. For experiment to examine the interferon response, organoids were treated with 3 μM of 5-AZA-CdR (Sigma). After 24 hr incubation, the medium was replaced with fresh drug-free medium, and then organoids were cultured for an additional 3 days for RNA or flow cytometry analyses.
MSI Analysis
For examination of microsatellite instability (MSI) five microsatellite repeat markers (Bennecke et al., 2010; Rad et al., 2013) were amplified by PCR using DNA isolated from WT and Prkcifl/flPrkczfl/flVillin-cre mouse tissues. 10 ng of DNA was amplified with FAM-labeled forward primers and reverse primers (see Table S2) specific for the previously validated murine microsatellite markers Bat24, Bat26, Bat30, Bat37, Bat64. Hi-Di and LIZ size standard were added to the samples and separation and detection of amplified fragments was performed on the 3730xl DNA Analyzer (Eton Bioscience). Data were analyzed with Peak ScannerTM Software from Applied Biosystems to identify the allelic patterns for each marker. Allelic patterns for normal and tumor tissues were compared and scored based on the size of the predominant allele and the presence of allelic variants. Tumor samples with greater or equal 40% MSI were classified as MSI-high (MSI-H), less than 40% as MSI-low (MSI-L), and samples without alterations were classified as microsatellite stable (MSS).
RNA extraction and analysis
Total RNA from mouse tissues and cultured organoids was extracted using the TRIZOL reagent (Invitrogen) and the RNeasy Mini Kit (Qiagen), followed by DNase treatment. After quantification using a Nanodrop 1000 spectrophotometer (Thermo Scientific), RNA was either processed for RNA-seq or reverse-transcribed using random primers and MultiScribe Reverse Transcriptase (Applied Biosystems). Gene expression was analyzed by amplifying 20 ng of the complementary DNA using the CFX96 Real Time PCR Detection System with SYBR Green Master Mix (BioRad) and primers described in Table S1. The amplification parameters were set at 95°C for 30 s, 58°C for 30 s, and 72°C for 30 s (40 cycles total). Gene expression values for each sample were normalized to the 18S RNA.
RNA sequencing (RNA-seq)
For RNA-seq of whole small intestinal tissues, total RNA was extracted from 3 WT jejunums, 3 Prkcifl/flPrkczfl/flVillin-cre non-tumor jejunums, and 3 Prkcifl/flPrkczfl/flVillin-cre tumors. For RNA-seq of intestinal epithelial cells (IECs), total RNA was extracted from normal jejunum IECs of 3 WT, 4 Prkcifl/flVillin-cre, 3 Prkczfl/flVillin-cre, and 4 Prkcifl/flPrkczfl/flVillin-cre mice. Each sample was extracted from independent mice. RNA-seq studies were performed in the Genomics Core at SBP Medical Discovery Institute. Briefly, poly(A) RNA was isolated using the NEBNext® Poly(A) mRNA Magnetic Isolation Module and barcoded libraries were made using the NEBNext® Ultra™ Directional RNA Library Prep Kit for Illumina® (NEB, Ipswich MA). Libraries were pooled and single end sequenced (1×75) on the Illumina NextSeq 500 using the High output V2 kit (Illumina). Sequencing Fastq files were uploaded to BaseSpace and processed with RNAexpress App (Illumina) to obtain raw reads counts for each gene. The gene matrix files were generated with RNAexpress App and compared using T-test comparison and log2 ratio of classes.
Bioinformatic analyses
Raw gene expression data from serrated tumor (GSE4045, GSE76987, GSE79460, GSE43841, GSE36758, GSE46513, GSE45270), CRC (GSE5851, GSE33113), and inflammatory bowel disease sample datasets (GSE36807, GSE59071, GSE 10616, GSE10714, GSE52746, GSE6731, and GSE9386) were directly accessed through the GEO (https://www.ncbi.nlm.nih.gov/geo/). RNS-seq data of The Cancer Genome Atlas (TCGA) Colorectal Adenocarcinoma (Tumor Samples with mRNA data (RNA Seq V2), 382 tumor samples from 379 patients) was downloaded through cBioportal (http://www.cbioportal.org/index.do). GenePattern (https://genepattern.broadinstitute.org/gp/pages/index.jsf) was used to collapse gene matrix files (CollapseDataset module) or to assess the statistical significance of differential gene expression (ComparativeMarkerSelection module for microarray data and DESeq2 module for RNA-seq data). Heat-map representation of gene expression was generated using GENE-E (https://software.broadinstitute.org/GENE-E/). Gene Set Enrichment Analysis (GSEA) was performed using GSEA 3.0 software http://www.broadinstitute.org/gsea/index.jsp) with 1000 gene-set permutations using the gene-ranking metric T-test with the collections h.all.v6.1.symbols (H), c2.all.v6.1.symbols (C2), c6.all.v6.1.symbols (C6), or customized gene sets. The “FUJII_CLASS1_MSS_CRC_UP”, “FUJII_CLASS2_SERRATED_UP”, and “FUJII_CLASS4_ADENOMA_DOWN” signatures were generated based on a list of classifier genes of corresponding classes for human organoids from microsatellite stable (MSS) colorectal cancer (CRC), serrated lesions, and tubular or tubulovillous adenoma (“FUJII_CLASS1_MSS_CRC_UP” = upregulated genes in class 1, size = 96; “FUJII_CLASS2_ SERRATED_UP” = upregulated genes in class 2, size = 130; “FUJII_CLASS4_ ADENOMA_DOWN” = downregulated genes in class 4, size = 223) (Fujii et al., 2016). The “DELKER_SERRATED_UP” signature was generated based on a list of top 50 gene transcripts increased by RNA-seq in SSA/Ps in serrated polyposis patients compared to controls (Delker et al., 2014). The “Prkcifl/flPrkczfl/flVillin-cre_SIGNATURE” (size = 358) was generated based on a list of gene transcripts significantly increased by RNA-seq in Prkcifl/flPrkczfl/flVillin-cre IECs compared to WT IECs (logFC > 1, FDR < 0.01, Table S3). Classification of CRC samples into CCS1 to CCS3 was performed by K_means_clustering using Morpheus (https://software.broadinstitute.org/morpheus/) with applying the CCS classifier to each dataset (De Sousa et al., 2013).
Survival analyses
CRC patient samples (GSE5851, GSE33113, TCGA) were segregated into four subgroups: PRKCILowPRKCZLow, PRKCIHiPRKCZLow, PRKCILowPRKCZHi, and PRKCIHiPRKCZHi based on the expression of PRKCI and PRKCZ. Median expression value of each gene was used as a cut off. PRKCILowPRKCZLow and PRKCIHiPRKCZHi groups were compared by GSEA (see Bioinformatic analyses) or survival analyses. To generate a Kaplan-Meier curves for TCGA patients, clinical and gene expression data of 369 patients with complete overall survival (OS) information were processed, and 5-year OS rate was compared between PRKCILowPRKCZLow (n = 88) and PRKCIHiPRKCZHi (n = 87) groups. For GSE5851, disease free survival (DFS) rate was compared between PRKCILowPRKCZLow (n = 27) and PRKCIHiPRKCZHi (n = 27) groups.
QUANTIFICATION AND STATISTICAL ANALYSIS
Data are presented as the mean ± SEM. Statistical analysis was performed using GraphPad Prism 7. Significant differences between groups were determined using a Student’s t test (two- tailed unpaired) when the data met the normal distribution tested by D’Agostino test. If the data did not meet this test, a Mann-Whitney test was used. Differences in tumor incidence were analyzed by Chi-square test (Figures 4J, 6C and 6O). Differences in Kaplan-Meier plots were analyzed by Log-Rank (Mantel-Cox) test (Figure 1C, 7F, and S7F). Two-way ANOVA was performed in OT-I cells-MC38OVA killing assay (Figure 5F) and in tumor distribution (Figure S1C, right panel). Differences in aPKC staining for human samples (Figure 7B) were analyzed by performing ANOVA multiple comparisons (Kruskal-Wallis test). The p-value indicates the difference between signal intensity (strong-moderate vs weak-negative) in normal, SSA/Ps, and TA. Differences in proportion of CRC patients in CCS1, CCS2, or CCS3 CRC subtype according to aPKC mRNA expression were analyzed by Fisher’s exact test for CCS3 vs CCS1;CCS2 (Figure 7E, S7D, and S7E). The significance level for statistical testing was set at p < 0.05.
Supplementary Material
HIGHLIGHTS.
Atypical protein kinase C (aPKC) expression is reduced in human serrated tumors
Deletion of both aPKCs in intestinal epithelium causes spontaneous serrated tumors
aPKC-deficient tumors display immunosuppression and stromal activation
Loss of PKCζ impairs the CD8+ T cell response, triggering serrated tumor initiation
ACKNOWLEDGMENTS
This research was supported by grants from NIH (R01CA207177, R01CA172025 to J.M.; R01CA192642, R01CA218254 to M.T.D.-M.). Y.N. was supported by the JSPS Postdoctoral Fellowship for Research Abroad and by the Crohn’s & Colitis Foundation of America. We thank Eduard Batlle (Institute for Research in Biomedicine, IRB Barcelona, Spain) for critically reading the manuscript and for kindly providing galunisertib. We thank Naomi Ruff for editing this manuscript. We thank the personnel of the Histology, Cell Imaging, Genomics, Animal Facility, and Viral Vectors Shared Resources at SBP Medical Discovery Institute for technical assistance.
Footnotes
Publisher's Disclaimer: This is a PDF file of an unedited manuscript that has been accepted for publication. As a service to our customers we are providing this early version of the manuscript. The manuscript will undergo copyediting, typesetting, and review of the resulting proof before it is published in its final citable form. Please note that during the production process errors may be discovered which could affect the content, and all legal disclaimers that apply to the journal pertain.
DATA AND SOFTWARE AVAILABILITY
The accession number for the RNA-seq data reported in this paper is GSE109289. Unprocessed original data have been deposited to Mendeley Data and are available at http://dx.doi.org/10.17632/x6h52v9by5.1.
DECLARATION OF INTERESTS
The authors declare no competing interests.
REFERENCES
- Beaugerie L, and Itzkowitz SH (2015). Cancers complicating inflammatory bowel disease. N Engl J Med 372, 1441–1452. [DOI] [PubMed] [Google Scholar]
- Bennecke M, Kriegl L, Bajbouj M, Retzlaff K, Robine S, Jung A, Arkan MC, Kirchner T, and Greten FR (2010). Ink4a/Arf and oncogene-induced senescence prevent tumor progression during alternative colorectal tumorigenesis. Cancer Cell 18, 135–146. [DOI] [PubMed] [Google Scholar]
- Calon A, Lonardo E, Berenguer-Llergo A, Espinet E, Hernando-Momblona X, Iglesias M, Sevillano M, Palomo-Ponce S, Tauriello DV, Byrom D, et al. (2015). Stromal gene expression defines poor-prognosis subtypes in colorectal cancer. Nat Genet 47, 320–329. [DOI] [PubMed] [Google Scholar]
- Chiappinelli KB, Strissel PL, Desrichard A, Li H, Henke C, Akman B, Hein A, Rote NS, Cope LM, Snyder A, et al. (2015). Inhibiting DNA Methylation Causes an Interferon Response in Cancer via dsRNA Including Endogenous Retroviruses. Cell 162, 974–986. [DOI] [PMC free article] [PubMed] [Google Scholar]
- de la Chapelle A, and Hampel H (2010). Clinical relevance of microsatellite instability in colorectal cancer. J Clin Oncol 28, 3380–3387. [DOI] [PMC free article] [PubMed] [Google Scholar]
- De Sousa EMF, Wang X, Jansen M, Fessler E, Trinh A, de Rooij LP, de Jong JH, de Boer OJ, van Leersum R, Bijlsma MF, et al. (2013). Poor-prognosis colon cancer is defined by a molecularly distinct subtype and develops from serrated precursor lesions. Nat Med 19, 614–618. [DOI] [PubMed] [Google Scholar]
- Delker DA, McGettigan BM, Kanth P, Pop S, Neklason DW, Bronner MP, Burt RW, and Hagedorn CH (2014). RNA sequencing of sessile serrated colon polyps identifies differentially expressed genes and immunohistochemical markers. PLoS One 9, e88367. [DOI] [PMC free article] [PubMed] [Google Scholar]
- Fearon ER, and Vogelstein B (1990). A genetic model for colorectal tumorigenesis. Cell 61, 759–767. [DOI] [PubMed] [Google Scholar]
- Fujii M, Shimokawa M, Date S, Takano A, Matano M, Nanki K, Ohta Y, Toshimitsu K, Nakazato Y, Kawasaki K, et al. (2016). A Colorectal Tumor Organoid Library Demonstrates Progressive Loss of Niche Factor Requirements during Tumorigenesis. Cell Stem Cell 18, 827– 838. [DOI] [PubMed] [Google Scholar]
- Galluzzi L, Buque A, Kepp O, Zitvogel L, and Kroemer G (2017). Immunogenic cell death in cancer and infectious disease. Nat Rev Immunol 17, 97–111. [DOI] [PubMed] [Google Scholar]
- Gregorieff A, Liu Y, Inanlou MR, Khomchuk Y, and Wrana JL (2015). Yap-dependent reprogramming of Lgr5(+) stem cells drives intestinal regeneration and cancer. Nature 526, 715– 718. [DOI] [PubMed] [Google Scholar]
- IJspeert J, Vermeulen L, Meijer GA, and Dekker E (2015). Serrated neoplasia-role in colorectal carcinogenesis and clinical implications. Nat Rev Gastroenterol Hepatol 12, 401–409. [DOI] [PubMed] [Google Scholar]
- Isella C, Terrasi A, Bellomo SE, Petti C, Galatola G, Muratore A, Mellano A, Senetta R, Cassenti A, Sonetto C, et al. (2015). Stromal contribution to the colorectal cancer transcriptome. Nat Genet 47, 312–319. [DOI] [PubMed] [Google Scholar]
- Le DT, Uram JN, Wang H, Bartlett BR, Kemberling H, Eyring AD, Skora AD, Luber BS, Azad NS, Laheru D, et al. (2015). PD-1 Blockade in Tumors with Mismatch-Repair Deficiency. N Engl J Med 372, 2509–2520. [DOI] [PMC free article] [PubMed] [Google Scholar]
- Lee MS, Menter DG, and Kopetz S (2017). Right Versus Left Colon Cancer Biology: Integrating the Consensus Molecular Subtypes. J Natl Compr Canc Netw 15, 411–419. [DOI] [PubMed] [Google Scholar]
- Llado V, Nakanishi Y, Duran A, Reina-Campos M, Shelton, Phillip M, Linares, Juan F, Yajima T, Campos A, Aza-Blanc P, Leitges M, et al. (2015). Repression of Intestinal Stem Cell Function and Tumorigenesis through Direct Phosphorylation of β-Catenin and Yap by PKCζ. Cell Reports 10, 740–754. [DOI] [PMC free article] [PubMed] [Google Scholar]
- Mangan PR, Harrington LE, O’Quinn DB, Helms WS, Bullard DC, Elson CO, Hatton RD, Wahl SM, Schoeb TR, and Weaver CT (2006). Transforming growth factor-beta induces development of the T(H)17 lineage. Nature 441, 231–234. [DOI] [PubMed] [Google Scholar]
- Mlecnik B, Bindea G, Angell HK, Maby P, Angelova M, Tougeron D, Church SE, Lafontaine L, Fischer M, Fredriksen T, et al. (2016). Integrative Analyses of Colorectal Cancer Show Immunoscore Is a Stronger Predictor of Patient Survival Than Microsatellite Instability. Immunity 44, 698–711. [DOI] [PubMed] [Google Scholar]
- Nakanishi Y, Reina-Campos M, Nakanishi N, Llado V, Elmen L, Peterson S, Campos A, De SK, Leitges M, Ikeuchi H, et al. (2016). Control of Paneth Cell Fate, Intestinal Inflammation, and Tumorigenesis by PKCλ/ι. Cell Reports 16, 3297–3310. [DOI] [PMC free article] [PubMed] [Google Scholar]
- Parker BS, Rautela J, and Hertzog PJ (2016). Antitumour actions of interferons: implications for cancer therapy. Nat Rev Cancer 16, 131–144. [DOI] [PubMed] [Google Scholar]
- Rad R, Cadinanos J, Rad L, Varela I, Strong A, Kriegl L, Constantino-Casas F, Eser S, Hieber M, Seidler B, et al. (2013). A genetic progression model of Braf(V600E)-induced intestinal tumorigenesis reveals targets for therapeutic intervention. Cancer Cell 24, 15–29. [DOI] [PMC free article] [PubMed] [Google Scholar]
- Tauriello DVF, Palomo-Ponce S, Stork D, Berenguer-Llergo A, Badia-Ramentol J, Iglesias M, Sevillano M, Ibiza S, Canellas A, Hernando-Momblona X, et al. (2018). TGFbeta drives immune evasion in genetically reconstituted colon cancer metastasis. Nature 554, 538–543. [DOI] [PubMed] [Google Scholar]
Associated Data
This section collects any data citations, data availability statements, or supplementary materials included in this article.