Abstract
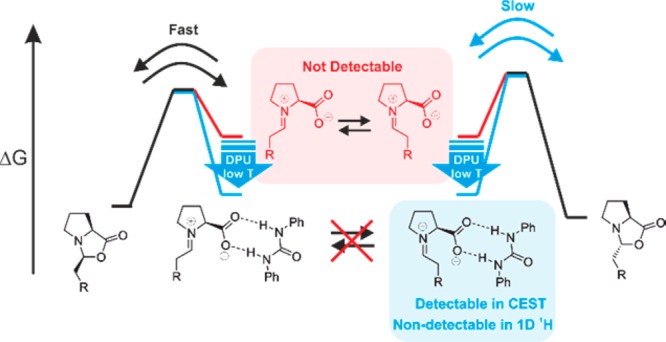
The low sensitivity of NMR and transient key intermediates below detection limit are the central problems studying reaction mechanisms by NMR. Sensitivity can be enhanced by hyperpolarization techniques such as dynamic nuclear polarization or the incorporation/interaction of special hyperpolarized molecules. However, all of these techniques require special equipment, are restricted to selective reactions, or undesirably influence the reaction pathways. Here, we apply the chemical exchange saturation transfer (CEST) technique for the first time to NMR detect and characterize previously unobserved transient reaction intermediates in organocatalysis. The higher sensitivity of CEST and chemical equilibria present in the reaction pathway are exploited to access population and kinetics information on low populated intermediates. The potential of the method is demonstrated on the proline-catalyzed enamine formation for unprecedented in situ detection of a DPU stabilized zwitterionic iminium species, the elusive key intermediate between enamine and oxazolidinones. The quantitative analysis of CEST data at 250 K revealed the population ratio of [Z-iminium]/[exo-oxazolidinone] 0.02, relative free energy +8.1 kJ/mol (calculated +7.3 kJ/mol), and free energy barrier of +45.9 kJ/mol (ΔG⧧calc.(268 K) = +42.2 kJ/mol) for Z-iminium → exo-oxazolidinone. The findings underpin the iminium ion participation in enamine formation pathway corroborating our earlier theoretical prediction and help in better understanding. The reliability of CEST is validated using 1D EXSY-build-up techniques at low temperature (213 K). The CEST method thus serves as a new tool for mechanistic investigations in organocatalysis to access key information, such as chemical shifts, populations, and reaction kinetics of intermediates below the standard NMR detection limit.
Introduction
NMR spectroscopy is a key method to reveal and interpret reaction mechanisms in chemical and catalytic reactions due to its unique potential to provide experimental information about structures, aggregation, and interactions in solution.1−7 However, the main drawback of NMR spectroscopy is its inherent insensitivity compared to other methods like UV–vis or mass spectrometry, which often limits its applicability. For the mechanistic investigation of chemical reactions by NMR, this drawback is especially serious, since in most reactions the intermediates, which are key to the reaction mechanism, are low populated, short-lived, and most often below the detection limit. Failure in observing such key intermediates (missing evidence) often leads to ambiguity in understanding the reaction pathway. The theoretical calculations can assist in predicting possible mechanistic pathways, however, the experimental detection of more active intermediates and its kinetic data during the reaction is essential to pinpoint the most plausible pathway.
One notable example is the proline or proline derivative-mediated enamine catalysis, which evolved as a versatile tool in a broad scope of enantioselective transformations of carbonyl compounds.8−10 However, for almost a decade, an in situ detection of the central enamine intermediate in proline-catalyzed aldol reaction was lacking, leading to controversial discussions about its formation,11−18 stabilization,4,19 and the subsequent transformation pathways. In the earlier stage, Seebach and Eschenmoser suggested that the observed oxazolidinone exists in equilibrium with the enamines (Figure 1).14 In 2010 our group was able to NMR detect and characterize the in situ generated enamine intermediate through solvent/additive-induced stabilization.4,16,19,20 The observed chemical exchange between oxazolidinone and enamine and the missing evidence for iminium ion were strongly indicative for an enamine formation via oxazolidinone (referred as oxazolidinone pathway, Figure 1).14 Further, this was also supported by recent kinetic isotope effect measurements for a l-proline-catalyzed α-amination of 3-phenylpropionalaldehyde.21 In contrast, List and Houk proposed an enamine formation via zwitterionic iminium ion intermediates (referred as iminium pathway, Figure 1),9,12,17,18 supported by DFT-calculations.11 The recent kinetic studies in our working group15 revealed that enamine formation rate and barrier conform to the calculated pathway via iminium intermediate. Furthermore, the barriers of the ring opening step from oxazolidinone toward the iminium intermediate are generally much lower than the proton abstraction to form enamine and exo ↔ endo interconversion via double-bond rotation (Figure 1).15
Figure 1.
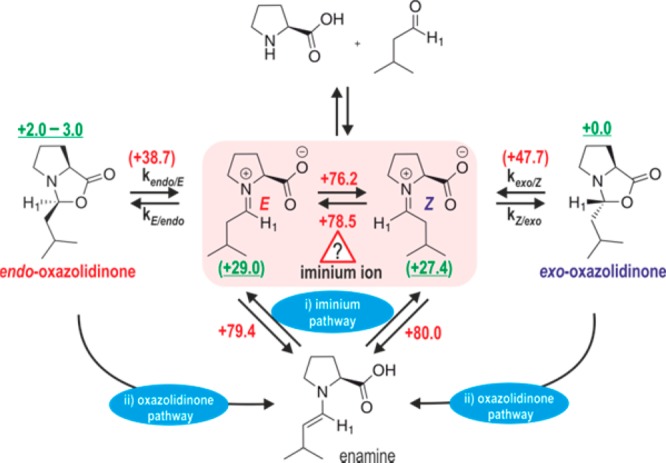
Formation of enamine, the central iminium ion intermediates are elusive. (i) Iminium pathway: formation of enamine by deprotonation of an iminium ion; (ii) oxazolidinone pathway: direct formation of enamine by deprotonation of a oxazolidinone intermediate. The energy values shown are obtained from theoretical calculations (with parentheses) and experiments (without parentheses).15 Green (underlined): Relative free energy to exo-oxazolidinone in DMSO at 300 K. Red: Free energy barrier predicted by theory and measured from EXSY-experiment in DMSO at 300 K.15 All calculations were performed without any external base.
Despite the quantitative agreement to the kinetic data, the existence of such unstable zwitterionic intermediates remains intriguing. Recent higher level theoretical calculation showed that the E/Z-iminium intermediates are indeed located about 27–30 kJ/mol higher than the corresponding endo/exo-oxazolidinone even in high polar medium.15 According to Boltzmann distribution, this corresponds to a population of 0.03% relative to oxazolidinones (μM amount in reaction condition), which is unlikely to be detected by conventional NMR. To prove the possible participation of iminium ions in this l-proline-catalyzed reaction, it necessitates more sensitive NMR techniques and/or stabilization methods to increase its amount.
Hyperpolarization techniques such as dissolution DNP,22−24 PHIP,25−27 SABRE,25−27 and CIDNP/photo CIDNP28−31 are used to enhance the sensitivity of the NMR signals. However, despite successful detection of low concentrated nuclei,32 the hyperpolarization techniques lacks generality due to additional requirements, such as radicals and microwave in DNP, para hydrogen in PHIP and SABRE, and radical pair presence in CIDNP or photo-CIDNP, which are suitable only to specific reactions or reaction conditions and often alters the chemical pathways. Furthermore, use of cryo-probes can enhance sensitivity, however these are incompatible at low temperatures, which are most often necessary for intermediates stabilization.1,3
In this regard, the chemical exchange saturation transfer (CEST) technique has attracted immense interest. The method provides more than 10-fold sensitivity enhancement,33,34 which is moderate compared to hyperpolarization techniques, but more importantly it does not influence the reaction system as it does not require external agents, such as radicals, para hydrogen etc. For CEST the only requirements are the existence of a chemical exchange in the slow exchange regime on the NMR time scale (k ≤ |Δν|) and one of the chemical exchange species being visible in conventional NMR experiments.35 CEST can then detect a low populated conformer or species below the conventional NMR detection limit. This is achieved by saturation transfer of selectively saturated nuclei from low populated site to major populated site via chemical/conformational exchange. During the saturation process, more numbers of saturated nuclei from a low populated site accumulate at a major populated site resulting in a decrease in intensity of major populated nuclei peak, which is more amplified than direct detection of low populated nuclei.35 The CEST method does not require any pre-knowledge of chemical shift information, as the method involves a stepwise systematic scanning of the chemical shift regions by selective saturation. The decrease in intensity as a function of saturation offset (chemical shift) provides information about relative population, structure, and rate of exchange of saturated molecule via Bloch–McConnell equations.36−38 However, CEST also shows a decrease in intensity due to NOE interactions as well, which often complicates the study. A few methods were reported which eliminates NOE interactions.39,40 In addition, various CEST modules were developed, such as, proton detected, heteronuclear detected, and multiple quantum-based methods to avoid overlapping, cover a broad range of exchange rates, and accelerate the experiment.41−45
Initial application of CEST was shown in MRI as an alternative contrast imaging technique.46−48 In this, the exchangeable protons in exogenous/endogenous compounds are selectively saturated and are detected indirectly through an intensity decrease in the water signal due to saturation transfer, which gives enhanced sensitivity even for low concentrated molecules.33,34 Recently, the signal amplification obtained in CEST is exploited for very compelling application in detecting invisible conformations of biomolecules, such as proteins and nucleic acids, which were never detected in conventional NMR experiments before.43,45,49 Despite the broad application of the CEST technique for the study of protein conformations and its high potential to reveal invisible states, to the best of our knowledge, the method has never been employed in reaction intermediate studies of chemical or catalytic reactions so far.
Here, we present for the first time CEST application for detection and characterization of low populated transient reaction intermediates in chemical and catalytic reactions, which are not visible in conventional NMR experiments. The advantage of signal amplification obtained in CEST and present chemical equilibrium in reaction pathway are explored, to prove for the first time in situ existence of iminium ion intermediates in enamine catalysis, which are key intermediates in the enamine formation pathway. Furthermore, the population of the invisible intermediate, its thermal stability, and free energy barrier for ring opening and closing are obtained through quantitative analysis of CEST profiles. At low temperature, the reliability of the CEST data about energies and exchange rates is validated by 1D EXSY and computational studies. The detection of such thermodynamically unstable intermediates underpins the formation pathway via iminium ion.
Results and Discussion
In the following it is described how even a complicated multisite equilibrium in a reaction can be prepared/adapted to the successful application of CEST. For this, mainly three points have to be addressed (i) absolute population of the elusive intermediate, (ii) slow exchange, and (iii) reduction of multisite equilibria. Without additives, slow exchange and two site equilibria can be reached at low temperatures, but the population is still too low (see CEST without Stabilizing Agent). Upon addition of an additive, its effect on the chemical shifts and the intermediate structures is analyzed (see DPU as Stabilizing Agent at 300 K). Applying an additive and low temperature, all three requirements for CEST are fulfilled, and theoretical calculations show that the additive does not significantly alter the kinetics of the investigated part of the reaction (see DPU as Stabilizing Agent at Low Temperature) allowing its application to detect the elusive iminium intermediate (see Detection of Z-Iminium via CEST). The reduction of multisite equilibrium to two site equilibrium allows for the quantitative determination of thermodynamic and kinetic parameters by CEST (see Population and Kinetics via CEST Profile). Finally, at very low temperatures, the CEST results were validated by classical 1D EXSY rate measurements, further the benefits of CEST are highlighted over EXSY (see Validation of CEST Method).
Model System
To successfully illustrate the potential of CEST for detection and characterization of elusive iminium intermediates, an appropriate model system has to be chosen, which allows simultaneous detection of oxazolidinone diastereomers and enamine intermediates in the reaction by conventional NMR and shows slow chemical exchanges between the intermediates. Based on our earlier experience, the l-proline-catalyzed homo aldol condensation of 3-methylbutanal fulfills these requirements (Figure 1).4,15,50 In addition, the formed intermediates, that is, endo/exo-oxazolidinones, enamines, and the substrates, give the best signal separation in NMR for proton H1 (Figure 2). The proton H1 of the elusive iminium ion is expected to be found well-separated at around 9 ppm based on our theoretical calculations and earlier reports.51,52 Thus, CEST selective saturation around 9 ppm should cause an intensity decrease for the H1 signal of the oxazolidinones and/or enamines if they are in slow exchange with the elusive iminium intermediates (Figure 1).
Figure 2.
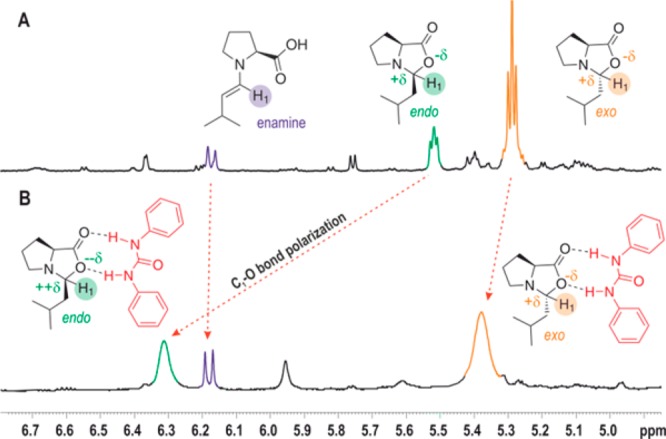
1D 1H NMR spectra of the reaction mixture of l-proline and 3-methylbutanal in DMF-d7 at 300 K without (A) and with DPU (B).
CEST without Stabilizing Agent
The recorded 1D 1H NMR spectrum for the reaction shows well-separated signals of the H1 proton for all three detectable intermediates, enamine, exo- and endo-oxazolidinone (see highlighted signals in Figure 2A). As expected, the stable oxazolidinone intermediates are observed in 1D 1H NMR (Figure 2), but due to the higher energy, the iminium ion intermediates were not observed. The approximate population of intermediates formed in the investigated reaction are 4 mM, 1.8 mM, and 0.7 mM, respectively, for exo-, endo-oxazolidinone and enamine. According to our previous calculation in DMSO, the oxazolidinone is 27–30 kJ/mol more stable than the iminium intermediates,15 which refers to a population of iminium ions <0.03% or equivalently 1.2 μM in the reaction. This is clearly below the threshold of conventional NMR spectroscopy. However, even CEST measurements with much higher sensitivity (more than 10-fold) at 300 K do not show any decrease in intensities for the H1-protons of oxazolidinones/enamines on saturating around 9 ppm.
The thermal instability of the iminium intermediates seems to be one of the problems to be solved. Additionally, the calculated activation energy for the ring opening process is low (in DMSO at 300 K, exo → Z = 47.7 kJ/mol; endo → E = 38.7 kJ/mol; Figure 1), therefore we expect fast exchange. A common strategy to circumvent both issues is by reducing the temperature to stabilize the charge separated species (i.e., in this case the zwitterionic iminium ions, by increasing the dielectric constant of the medium) and to slow down exchange. Therefore, DMF is used in the investigation, since it is highly polar, similar to DMSO, and also allows measurement at low temperature up to 213 K.
However, the low-temperature 1D 1H NMR, 1D EXSY, and CEST experiments down to 215 K did not give any evidence for iminium ion intermediates even though the system is expected to be in the slow exchange regime (see Figure S1 in Supporting Information for spectra without DPU). This implies that the stabilization of charge separated species by increasing dielectric constant is not sufficient to alter the thermal population for the detection even in CEST.
DPU as Stabilizing Agent at 300 K
Therefore, next the iminium population was increased by an additive. It was shown in literature that addition of thiourea derivatives could possibly stabilize proline iminium ion species.53 As also shown in earlier19,50 and current studies in DMSO/DMF, a significant downfield shift of H1endo-oxazolidinone proton (Δδ = 0.8 ppm) upon the addition of 1 equiv of DPU (N,N′-diphenyl urea) to the investigated reaction mixture was observed (Figure 2B). In contrast, only a slight shift for exo-oxazolidinone (Δδ = 0.1 ppm), and nearly no shift for the enamine peak is observed.19,50 For these observations, there are several possible roots, which could induce the shift at 300 K when DPU is added. The first obvious one is the deshielding of H1 by the aromatic moiety of the DPU, which might be different for endo- and exo-oxazolidinone. However, from our detailed structural analysis, no particular effect is expected since the aromatic ring is remotely located relative to H1 of both oxazolidinones (see Supporting Information).
The second possible reason is due to the formation of significant iminium species along with the oxazolidinones, which could be in fast exchange with each other leading to downfield averaged peak for H1.50 In this case, the peak location is determined by the population percentage of the two exchanging molecules, that is, endo ↔ E and exo ↔ Z (considering negligible exchange between exo and endo). However, EXSY measurement at 300 K revealed similar interconversion rates for endo → exo (+72.5 kJ/mol) and exo → endo (+72.9 kJ/mol) (Figure 3). This indicates a thermodynamic equivalency between E- and Z-iminium. Furthermore, the population analysis of endo and exo (peak integration) showed a relatively higher free energy for endo-oxazolidinone (2.0 kJ/mol), which puts E-iminium energetically nearer to the endo-oxazolidinone. Hence, one might tend to expect the more pronounced shift observed for H1 of endo-oxazolidinone. Nevertheless, as it will be indicated later by CEST, at 300 K the population of the E/Z-iminium is expected to be very low ([Z-iminium]/[exo] < 2% or ΔGZ-exo(300 K) > 9.5 kJ/mol; E-iminium/[endo] < 5% or ΔGE-endo(300 K) > 7.5 kJ/mol). Given an expected H1 shift of the iminium species located at ∼9 ppm,51,52 such low iminium population cannot contribute significantly to the observed average shift (maximum Δδ = 0.18 ppm shift in case of 5% E-iminium population and 95% endo-oxazolidinone).
Figure 3.
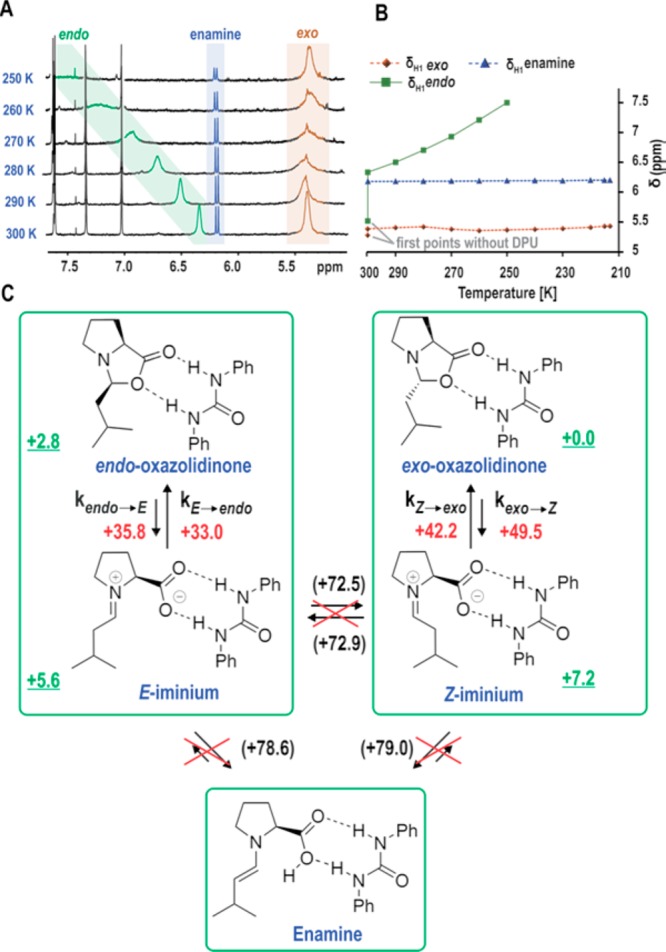
Temperature-dependent stacked 1H 1D spectra (A) with decrease in temperature H1 of endo-oxazolidinone peak shows a line broadening and downfield shift, and H1 of exo-oxazolidinone shows a narrower-broader-narrower profile indicating shift of exo ↔ Z exchange to slow exchange regime. Temperature-dependent plot of H1 peak shift of exo- and endo-oxazolidinone and enamine in the presence of DPU (the first points at 300 K are without DPU) (B). At low temperature, no chemical exchange occurs between exo- and endo-oxazolidinone via iminium (T < 250 K) as well as oxazolidinones and the enamine (T < 270 K). Numbers (kJ/mol) indicated in black with parentheses: experimental free energy barrier from EXSY at 300 K; red: calculated free energy barrier at 268 K; green (underlined): calculated relative Gibbs free energy at 268 K (C).
A third possible explanation is provided by the charge and structural analysis of oxazolidinones. Detailed structural analysis revealed that the C1–O bond is elongated by the complexation with DPU, however, more pronounced in endo-oxazolidinone than in exo-oxazolidinone (see Supporting Information; H1 is attached to C1). Consequently, the developed charge polarization along the C1–O bond in oxazolidinones causes the deshielding effect for H1 (stronger in endo, Figure 2B, Supporting Information). Therefore, contrary to the general expectation, the major effect observed at 300 K is not due to the population of iminium ion in the system, but rather due to the increased polarization of the C1–O bond.
At this point, the observed H1 chemical shift change only indicates a significant interaction between oxazolidinone and DPU. However, the detection and detailed characterization of iminium ions as well as the kinetics of its formation are not accessible due to low iminium ion population and too fast exchange at 300 K.
DPU as Stabilizing Agent at Low Temperature
Therefore, the reaction mixture was cooled again to minimize the chemical exchange between the intermediates and to stabilize the iminium ion. On decreasing the temperature until 250 K, a continued downfield shift and broadening for the H1-signal of endo-oxazolidinone is observed (Figure 3A,B). This significant shift is attributed to both C1–O polarization and interconversion between endo ↔ E-iminium ion. However, at low temperature, downfield shift is expected mainly due to increased population of zwitterionic E-iminium ion. Below 250 K, the peak completely diminishes due to broadening (Figure 3A), and we were unable to reach the low exchange regime for the application of CEST (detailed estimation for the population of E-iminium ion and endo-oxazolidinone through classical peak analysis is shown in the Supporting Information). On the other hand, a slight upfield shift (Figure 3B) and line broadening on down to 280 K (Figure 3A, coalescence point) is observed for H1 signal of exo-oxazolidinone, indicating a possible exo-oxazolidinone ↔ Z-iminium exchange shift to the slow exchange regime. On further decreasing the temperature (<280 K), the broadened peak becomes narrower (Figure 3A). This narrower-broader-narrower profile confirms slow exchange regime for exo-oxazolidinone ↔ Z-iminium, which is a prerequisite for the application of CEST.
The quantum chemical calculations showed that the E/Z-iminium intermediates are massively stabilized by the presence of DPU due to the H-bond formation (ΔG268Z-iminium vs exo = +7.2 kJ/mol and ΔG268E-iminium vs endo = +2.8 kJ/mol, Figure 3C). Moreover, the calculated free energy difference between E and Z iminium at 268 K amounts to 1.6 kJ/mol in favor of E-iminium. Surprisingly, the ring opening barriers were not affected significantly by the complexation with the additive (ΔG⧧268 = +35.8 kJ/mol for endo → E and +49.5 kJ/mol for exo → Z,Figure 3C; see Figure 1 for barriers without DPU). At low temperature (T ≤ 250 K), apart from the exchange between iminium and oxazolidinone, no exchange is possible between endo/exo ↔ enamine and exo ↔ endo or Z ↔ E (1D 1H EXSY showed no exchange peak, Figure 4B) due to the high barrier for deprotonation and double-bond rotation (Figure 3C: Measured ΔG⧧300exo ↔ endo and exo/endo ↔ enamine; ΔG⧧T is quasiconstant over temperatures from 215 to 300 K). Thus, we expect that the reduced thermal energy permits only the ring opening process to occur during T1 time scale (Figure 3C), the remaining exchange pathways are by far slow or nil and do not interfere with CEST application. Thus, the application of low temperature simplifies the complex multisite exchange system of the enamine catalysis into two site slow exchange equilibrium on CEST experimental time scale (T1 time scale), which allows a straightforward and reliable extraction of kinetic and thermodynamic information on iminium ion from CEST.
Figure 4.
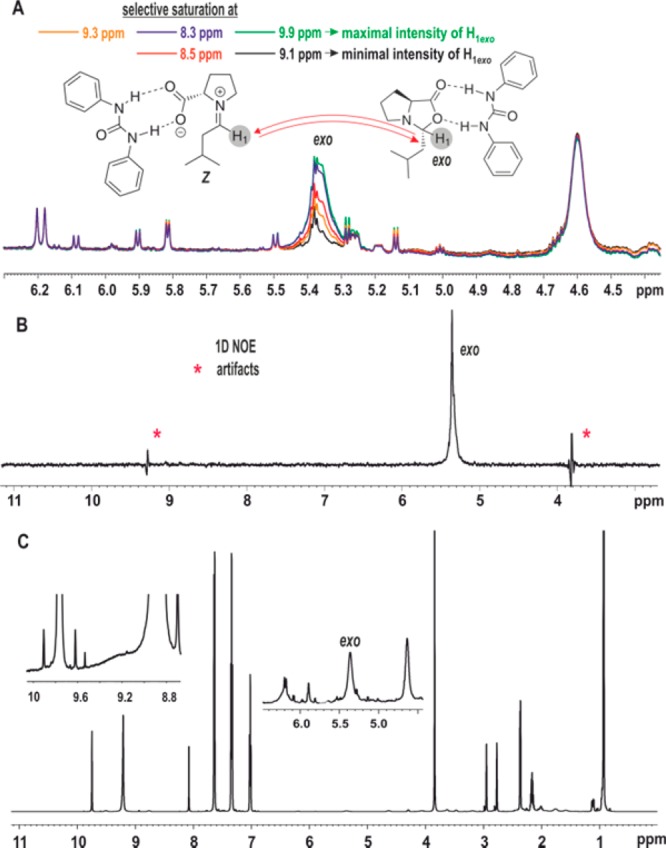
CEST (A), 1D 1H EXSY with mixing time 450 ms (B), and 1D 1H NMR (C) spectra at 250 K. CEST shows decrease in intensity of exo-oxazolidinone due to saturation transfer from iminium, confirming the presence of iminium ions. EXSY shows no observation of iminium ion. Inset shows scaled exo-oxazolidinone intermediate peak from 1D 1H spectrum (C).
Detection of Z-Iminium via CEST
After successfully preparing the system for complying the prerequisites, slow exchange regime and two site equilibrium, the system is examined for iminium detection by CEST. The temperature was cooled stepwise, each step down by 10 K. At each temperature, the 1D CEST experiments were recorded as described above, while selectively saturating around 9 ppm and monitoring the intensity of the oxazolidinone peaks. Above 250 K, no reduction was observed, but at 250 K, the measured CEST experiment showed a decrease in intensity for the exo-oxazolidinone peak (Figure 4A). The decrease in intensity is pronounced as selective saturation approaches 9.12 ppm. At 9.12 ppm a maximum drop in intensity was observed, which lessens as the selective saturation moves away from 9.12 ppm. This indicates the presence of a transient iminium ion intermediate at 9.12 ppm, which chemically exchanges with exo-oxazolidinone. As discussed above, the high energy barrier between exo- and endo-oxazolidinone (Figure 3C: ΔG⧧300exo → endo = +72.9 kJ/mol; endo → exo = +72.5 kJ/mol) completely excludes interconversion between exo- and endo-oxazolidinone via C=N double bond rotation at T ≤ 250 K, which is evidenced by the EXSY showing no exchange between the two diastereomers (Figure 4B). Since the intensity decrease is only observed for H1-exo-oxazolidinone, it implies the detected iminium ion is Z-configured (Figure 3C).
Thus, CEST enables the first detection of an iminium ion intermediate in this enamine formation. In contrast, the selective 1D 1H EXSY for the same reaction mixture at the same conditions does not show any exchange peak at 9.12 ppm on selective excitation of the exo-oxazolidinone peak (Figure 4B). Due to the low population of the iminium ion under these conditions, the sensitivity of EXSY or other conventional NMR methods is insufficient to detect the transient intermediates. The iminium ion observation only in CEST clearly highlights its potential in detection of transient reaction intermediates. Importantly it does not require any additional hyperpolarizing sources and hence gives information about intermediates without influencing the chemical systems. Additionally, the method is also possible in case of high spectral complexity (Figure 4C).
Population and Kinetics via CEST Profile
In the subsequent step, a complete CEST profile, that is, a plot of intensity change of exo-oxazolidinone peak vs chemical shift of selective saturation was generated to determine the population of the Z-iminium ion and to measure the rate of ring opening/ring closing (Figure 5, circles). To access encoded information exchange rates and population ratio [Z]/[exo], a two site exchange CEST profile (Figure 5, blue curve) was simulated by using Bloch–McConnell equations,36−38 which correlates concentration of exchange species, longitudinal relaxation rates, and exchange rate constants (Supporting Information).
Figure 5.
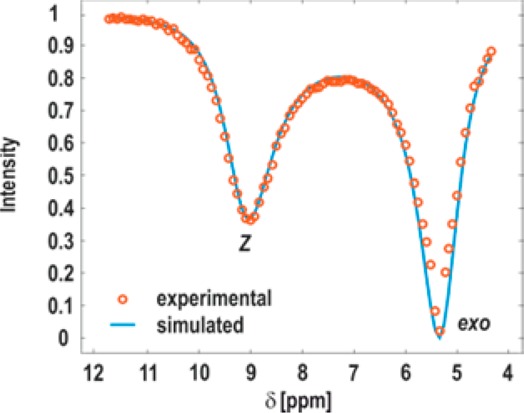
CEST profile at 250 K; intensity variation of H1exo peak on stepwise selective saturation over chemical shift. The major dip at 5.4 ppm is due to saturation of the H1exo peak itself, and minor peak is due to saturation transfer from Z-iminium ion.
Subsequently, the simulated data were fitted to the experimental data (Figure 5) with a multiparameter optimization. The parameters concentration of exo-oxazolidinone (Mexo = 1) and the longitudinal relaxation times of oxazolidinone (T1exo) and Z-iminium ion (T1z) are fixed, while varying the concentration of Z-iminium ion (Mimi) and the rate of ring closing (kZ→exo). The longitudinal relaxation time (T1exo = 1.8 s) of exo-oxazolidinone was obtained by an inversion recovery experiment while saturating the iminium ion resonance at 9.12 ppm. The same T1 value was assumed for the corresponding Z-iminium ion as well. The solutions of Bloch–McConnell equations and data fitting procedure are followed as mentioned in earlier reports37,54 and discussed in the Supporting Information. The obtained rates of exchange kZ→exo, kexo→Z and the population of Z-iminium ion are reported in Table 1. We could obtain a ring closing rate constant of kZ→exo ≈ 1300 s–1 and a ring opening rate constant kexo→Z ≈ 26 s–1 at 250 K. The relative population collected from CEST is Z/exo ≈ 0.02, which corresponds to +8.1 kJ/mol free energy difference in favor for exo. The free energy barriers at 250 K calculated for ring closing and ring opening from the rates by using Eyring equation are +45.9 and +54 kJ/mol, respectively. The energies obtained are in good agreement with our theoretical data (ΔG⧧268 = +42.2 kJ/mol Z → exo and +49.5 kJ/mol for exo → Z). This quantitative information on iminium ions fills the missing blanks in enamine reaction pathway, assisting in better understanding.
Table 1. Relative Populations and Rate Constants Measured from CEST and 1D EXSY.
| CEST |
1D EXSY | |||
|---|---|---|---|---|
| temperature (K) | [Z]/[exo] | kz/exo (s–1) | kexo/z (s–1) | kexo/z (s–1) |
| 250 | 0.02 | 1300 ± 50 | 26 ± 2 | n.a. |
| 213 | 0.08 | 50 ± 3 | 4 ± 1 | 2.15 ± 1 |
Validation of CEST Method
The CEST measurements and its profile indicated that the population of the Z-iminium is still by far too low to be detected by conventional NMR (80 μM). The traditional way to increase the population and minimize the transiency of the charge separated intermediate is to increase the dielectricity of the solvent by decreasing the measurement temperature. Indeed, at 213 K, we could observe a 4-fold enhancement of the iminium intermediate population by CEST (0.32 mM). The enhancement allows us also to detect the iminium species by conventional NMR (Figure 6A). Additionally, at this temperature we detected an exchange peak at 9.12 ppm in the conventional 1D EXSY experiment by the selective excitation of the H1exo-oxazolidinone peak (5.4 ppm; Figure 6B).
Figure 6.
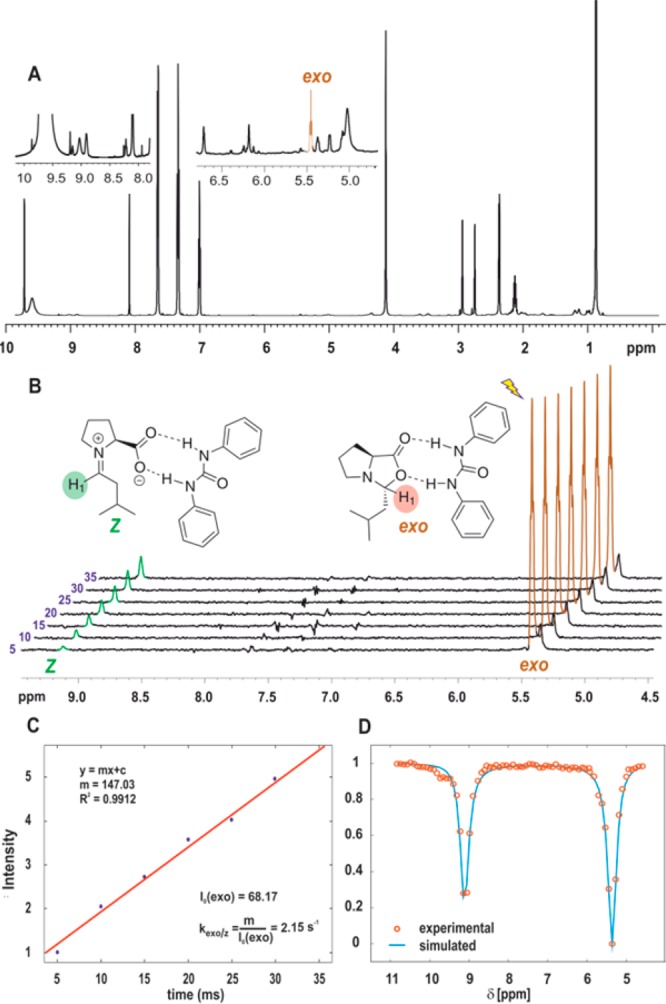
Normal 1D 1H spectrum showing two scaled regions around 5.5 and 9 ppm at 213 K (A). 1D 1H EXSY stacked spectra with different mixing time, in ms increments (B). Linear plot of intensity of iminium peak obtained from 1D EXSY vs mixing time for measurement of exchange rate (C). CEST experimental (circles) and simulated (curve) spectra at 213 K (D).
This gives us the opportunity to compare both CEST and 1D EXSY data for exchange rate measurements. Therefore, a series of 1D EXSY experiments were recorded with different mixing times (5–35 ms in 5 ms increment), and the obtained spectra are shown in Figure 6B. To determine the rate constant from the EXSY data, a plot of intensity of the Z-iminium peak vs mixing time is generated (Figure 6B–C). It is known that in the initial linear buildup, the slope directly gives the rate of exchange from exo-oxazolidinone to Z-iminium ion.15 From the rate and the initial exo-oxazolidinone concentration (I0(exo)), the rate constant for ring opening, kexo/Z ≈ 2.15 s–1 is obtained (Figure 6C). The initial intensity (I0(exo)) is obtained by back calculation from the spectra.
For comparison, CEST experiments were recorded at 213 K for the same mixture. The plotted CEST spectra are shown in Figure 6D. Again the rate constant and population of Z-iminium are extracted by comparing with simulated spectra from the Bloch–McConnell equations; the shown circles are experimental data and the curve represents a simulated profile. For simulating the CEST profile, a relaxation time T1 = 0.8 s was used for both exo-oxazolidinone and Z-iminium ion, which was obtained from an inversion recovery experiment for exo-oxazolidinone peak while on saturating at 9.12 ppm. The obtained rate constants and population are compared and are tabulated in Table 1. At 213 K, the obtained rate constants from 1D EXSY and CEST for ring opening are kexo→Z ≈ 2.15 s–1 and 4 s–1 respectively. The values obtained from both methods are of the same magnitude, and hence it validates CEST(within experimental error 5–7%). The reduced exchange rate at 213 K results in narrower line width for CEST profile (Figure 6D) compared to line widths in CEST profile at 250 K (higher exchange rates; Figure 5).
Even at 213 K, CEST shows comparatively a stronger amplified signal for Z-iminium ion than in the 1D EXSY spectra. In addition CEST provides information about the concentration of Z-iminium ion, and both rate constants of ring closing (kZ→exo) and ring opening (kexo→Z). In this case the obtained relative concentration of Z-iminium is [Z]/[exo] ≈ 0.08, rate constant for ring closing is ≈50 s–1, and rate constant for ring opening is ≈4 s–1. The corresponding activation barriers obtained for ring closing and ring opening are 44.1 and 49.1 kJ/mol, respectively. On the other hand 1D EXSY only gives the rate constant of ring opening (kexo→Z). A difficulty in the integration of 1H peak of Z-iminium ion in 1D 1H due to low intensity and overlap of other peaks (Figure 6A) restricts the extraction of population and rate constant kZ→exo. Furthermore, extraction of rate constants from 1D EXSY needs a series of experiments with varied mixing times and it needs to satisfy a linear relationship, which takes more time and is a serious problem particularly for low concentrated nuclei. This more often violates the linearity relationship between intensity buildup and mixing time.
In summary, the experimental results gained by the application of CEST in combination with 1D EXSY and high-level theoretical calculations provide detailed free energy landscape of E,Z-iminium ions, endo as well as exo-oxazolidinone in enamine formation pathway (Figure 7). The unprecedented detection of the Z-iminium ion intermediate, accessed free energies, and free energy barriers between E ↔ endo (calculated) and Z ↔ exo (experimental and calculated) verify our earlier theoretical calculations supporting the iminium pathway in the present system.
Figure 7.
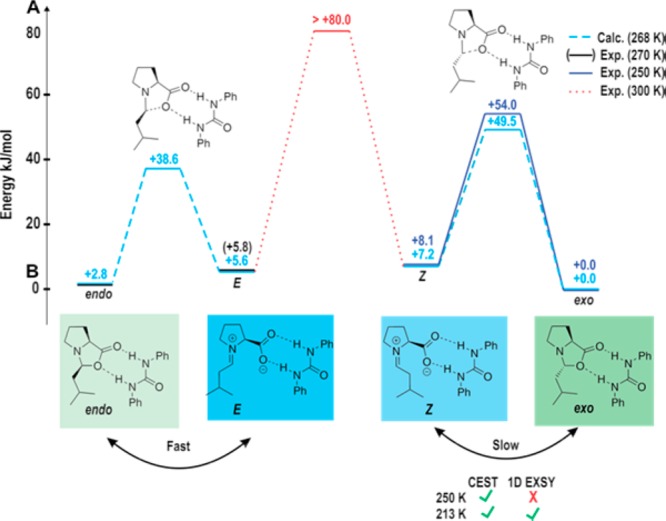
Compared thermal energy and free energy barriers obtained from experimental and theoretical calculations for endo-, exo-oxazolidinone, E and Z-iminium. For the exo ↔ endo exchange, the barrier was taken from the data at 300 K. The relative energy of endo to exo could not be obtained at 250 K, but was assumed as the similar to the theoretical value at 268 K (blue with dashed lines).
Computational Details
The geometry of all intermediates and transition states was optimized at TPSS-D3/def2-SVP level of theory in continuum (CPCM) of DMF. The dielectric constant of the solvent (DMF) was modified to mimic low-temperature conditions of the NMR measurement (ε268–215 K = 42.99–55.08). Nevertheless, the relative energy of the intermediates does not change significantly (<1 kJ/mol) upon variation of dielectric constants. However, at low-temperature, theoretical calculations fail to predict correct populations of iminium ions due to difficulties in simulating the effect of dielectricity changes of polar solvents (DMF).
Subsequently thermochemical analysis was performed to identify unambiguously the minima (zero imaginary vibrational mode) and maxima (exactly one imaginary vibrational mode). Single point calculations at DLPNO–CCSD(T)/CBS level of theory were added above the optimized geometry (for the extrapolation procedure see Supporting Information).55,56 The software used for optimization, frequency analysis, and NMR shifts calculation was Gaussian 09, D.01.57 For the single points ORCA 3.0.3 was employed.58 NBO6.0 was used for charge analysis.59
Conclusion
The study illustrates the high potential of the CEST method as a mechanistic tool to detect low populated intermediates (inaccessible to classical NMR methods), enabling new insights into the reaction pathway. In addition to the enhanced sensitivity, CEST provides thermodynamic and kinetic data of these intermediates in terms of population and exchange rates. The obtained detailed information about mechanistic steps between the intermediates assists in experimental validation of theoretically proposed mechanistic pathways. In the present mechanistic study of enamine formation, the CEST elucidates a possible mechanistic pathway by detecting and characterizing the previously missed in situ iminium ions. The obtained population and energy barriers pin pointed the iminium pathways and corroborated earlier theoretical predictions. Thus, CEST together with computational studies offer a better approach to probe missing intermediates in the reaction to pinpoint the possible mechanistic pathway.
In general, most of the chemical or catalytic reactions possess equilibria, which can be explored for application of CEST in mechanistic investigations. Further, the method can be combined with other sensitivity enhancement methods, like dissolution DNP, PHIP, or use of cryo probes, which can multiply the sensitivity to access ultralow (nano molar) concentrated intermediates.
Acknowledgments
We would like to thank the German Science Foundation (DFG grant GS 13/4-1) and the European Research Council (ERC-CoG 614182 – IonPairsAtCatalysis) for financial support.
Supporting Information Available
The Supporting Information is available free of charge on the ACS Publications website at DOI: 10.1021/jacs.7b12343.
Experimental details, NMR spectra, and computational details (PDF)
The authors declare no competing financial interest.
Supplementary Material
References
- Greindl J.; Hioe J.; Sorgenfrei N.; Morana F.; Gschwind R. M. J. Am. Chem. Soc. 2016, 138, 15965. 10.1021/jacs.6b09244. [DOI] [PMC free article] [PubMed] [Google Scholar]
- Seegerer A.; Hioe J.; Hammer M. M.; Morana F.; Fuchs P. J. W.; Gschwind R. M. J. Am. Chem. Soc. 2016, 138, 9864. 10.1021/jacs.6b04008. [DOI] [PubMed] [Google Scholar]
- Sorgenfrei N.; Hioe J.; Greindl J.; Rothermel K.; Morana F.; Lokesh N.; Gschwind R. M. J. Am. Chem. Soc. 2016, 138, 16345. 10.1021/jacs.6b09243. [DOI] [PMC free article] [PubMed] [Google Scholar]
- Schmid M. B.; Zeitler K.; Gschwind R. M. Angew. Chem., Int. Ed. 2010, 49, 4997. 10.1002/anie.200906629. [DOI] [PubMed] [Google Scholar]
- Frihed T. G.; Bols M.; Pedersen C. M. Chem. Rev. 2015, 115, 4963. 10.1021/cr500434x. [DOI] [PubMed] [Google Scholar]
- Zhang L.; Ren Y.; Yue B.; He H. Chem. Commun. 2012, 48, 2370. 10.1039/c2cc16882k. [DOI] [PubMed] [Google Scholar]
- Lodewyk M. W.; Siebert M. R.; Tantillo D. J. Chem. Rev. 2012, 112, 1839. 10.1021/cr200106v. [DOI] [PubMed] [Google Scholar]
- Marigo M.; Jørgensen K. A. In Enantioselective Organocatalysis; Wiley-VCH Verlag GmbH & Co. KGaA: Weinheim, Germany, 2007; pp 56–76. [Google Scholar]
- List B. Synlett 2001, 2001, 1675. 10.1055/s-2001-18074. [DOI] [Google Scholar]
- Mukherjee S.; Yang J. W.; Hoffmann S.; List B. Chem. Rev. 2007, 107, 5471. 10.1021/cr0684016. [DOI] [PubMed] [Google Scholar]
- Sharma A. K.; Sunoj R. B. Angew. Chem., Int. Ed. 2010, 49, 6373. 10.1002/anie.201001588. [DOI] [PubMed] [Google Scholar]
- List B.; Lerner R. A.; Barbas C. F. III J. Am. Chem. Soc. 2000, 122, 2395. 10.1021/ja994280y. [DOI] [Google Scholar]
- Bahmanyar S.; Houk K. N.; Martin H. J.; List B. J. Am. Chem. Soc. 2003, 125, 2475. 10.1021/ja028812d. [DOI] [PubMed] [Google Scholar]
- Seebach D.; Beck A. K.; Badine D. M.; Limbach M.; Eschenmoser A.; Treasurywala A. M.; Hobi R.; et al. Helv. Chim. Acta 2007, 90, 425. 10.1002/hlca.200790050. [DOI] [Google Scholar]
- Haindl M. H.; Hioe J.; Gschwind R. M. J. Am. Chem. Soc. 2015, 137, 12835. 10.1021/jacs.5b03420. [DOI] [PubMed] [Google Scholar]
- Schmid M. B.; Zeitler K.; Gschwind R. M. J. Am. Chem. Soc. 2011, 133, 7065. 10.1021/ja111544b. [DOI] [PubMed] [Google Scholar]
- List B.; Hoang L.; Martin H. J. Proc. Natl. Acad. Sci. U. S. A. 2004, 101, 5839. 10.1073/pnas.0307979101. [DOI] [PMC free article] [PubMed] [Google Scholar]
- List B. Acc. Chem. Res. 2004, 37, 548. 10.1021/ar0300571. [DOI] [PubMed] [Google Scholar]
- Schmid M. B.; Zeitler K.; Gschwind R. M. Chem. - Eur. J. 2012, 18, 3362. 10.1002/chem.201102660. [DOI] [PubMed] [Google Scholar]
- Schmid M. B.; Zeitler K.; Gschwind R. M. Chem. Sci. 2011, 2, 1793. 10.1039/c1sc00274k. [DOI] [Google Scholar]
- Ashley M. A.; Hirschi J. S.; Izzo J. A.; Vetticatt M. J. J. Am. Chem. Soc. 2016, 138, 1756. 10.1021/jacs.5b10876. [DOI] [PubMed] [Google Scholar]
- Gajan D.; Bornet A.; Vuichoud B.; Milani J.; Melzi R.; van Kalkeren H. A.; Veyre L.; Thieuleux C.; Conley M. P.; Gruning W. R.; Schwarzwalder M.; Lesage A.; Coperet C.; Bodenhausen G.; Emsley L.; Jannin S. Proc. Natl. Acad. Sci. U. S. A. 2014, 111, 14693. 10.1073/pnas.1407730111. [DOI] [PMC free article] [PubMed] [Google Scholar]
- Bornet A.; Maucourt M.; Deborde C.; Jacob D.; Milani J.; Vuichoud B.; Ji X.; Dumez J. N.; Moing A.; Bodenhausen G.; Jannin S.; Giraudeau P. Anal. Chem. 2016, 88, 6179. 10.1021/acs.analchem.6b01094. [DOI] [PubMed] [Google Scholar]
- Chen C.; Shih W.; Hilty C. J. Am. Chem. Soc. 2015, 137, 6965. 10.1021/jacs.5b04479. [DOI] [PubMed] [Google Scholar]
- Duckett S. B.; Mewis R. E. Acc. Chem. Res. 2012, 45, 1247. 10.1021/ar2003094. [DOI] [PubMed] [Google Scholar]
- Barskiy D. A.; Shchepin R. V.; Coffey A. M.; Theis T.; Warren W. S.; Goodson B. M.; Chekmenev E. Y. J. Am. Chem. Soc. 2016, 138, 8080. 10.1021/jacs.6b04784. [DOI] [PMC free article] [PubMed] [Google Scholar]
- Eshuis N.; Hermkens N.; Van Weerdenburg B. J. A.; Feiters M. C.; Rutjes F. P. J. T.; Wijmenga S. S.; Tessari M. J. Am. Chem. Soc. 2014, 136, 2695. 10.1021/ja412994k. [DOI] [PubMed] [Google Scholar]
- Lee J. H.; Sekhar A.; Cavagnero S. J. Am. Chem. Soc. 2011, 133, 8062. 10.1021/ja111613c. [DOI] [PMC free article] [PubMed] [Google Scholar]
- Eisenreich W.; Joshi M.; Weber S.; Bacher A.; Fischer M. J. Am. Chem. Soc. 2008, 130, 13544. 10.1021/ja805856r. [DOI] [PubMed] [Google Scholar]
- Roth H. D.; Manion Schilling M. L. J. Am. Chem. Soc. 1980, 102, 4303. 10.1021/ja00533a003. [DOI] [Google Scholar]
- Morris J. I.; Morrison R. C.; Smith D. W.; Garst J. F. J. Am. Chem. Soc. 1972, 94, 2406. 10.1021/ja00762a035. [DOI] [Google Scholar]
- Kiryutin A. S.; Sauer G.; Yurkovskaya A. V.; Limbach H.-H.; Ivanov K. L.; Buntkowsky G. J. Phys. Chem. C 2017, 121, 9879. 10.1021/acs.jpcc.7b01056. [DOI] [Google Scholar]
- Guivel-Scharen V.; Sinnwell T.; Wolff S. D.; Balaban R. S. J. Magn. Reson. 1998, 133, 36. 10.1006/jmre.1998.1440. [DOI] [PubMed] [Google Scholar]
- Ward K.; Aletras A.; Balaban R. J. Magn. Reson. 2000, 143, 79. 10.1006/jmre.1999.1956. [DOI] [PubMed] [Google Scholar]
- Liu G.; Song X.; Chan K. W. Y.; Mcmahon M. T. NMR Biomed. 2013, 26, 810. 10.1002/nbm.2899. [DOI] [PMC free article] [PubMed] [Google Scholar]
- McMahon M. T.; Gilad A. A.; Zhou J.; Sun P. Z.; Bulte J. W. M.; van Zijl P. C. M. Magn. Reson. Med. 2006, 55, 836. 10.1002/mrm.20818. [DOI] [PMC free article] [PubMed] [Google Scholar]
- Woessner D. E.; Zhang S.; Merritt M. E.; Sherry A. D. Magn. Reson. Med. 2005, 53, 790. 10.1002/mrm.20408. [DOI] [PubMed] [Google Scholar]
- Zaiss M.; Bachert P. Phys. Med. Biol. 2013, 58, R221. 10.1088/0031-9155/58/22/R221. [DOI] [PubMed] [Google Scholar]
- Yuwen T.; Sekhar A.; Kay L. E. Angew. Chem., Int. Ed. 2017, 56, 6122. 10.1002/anie.201610759. [DOI] [PubMed] [Google Scholar]
- Lee J.-S.; Regatte R. R.; Jerschow A. J. Magn. Reson. 2012, 215, 56. 10.1016/j.jmr.2011.12.012. [DOI] [PMC free article] [PubMed] [Google Scholar]
- Xu X.; Lee J. S.; Jerschow A. Angew. Chem., Int. Ed. 2013, 52, 8281. 10.1002/anie.201303255. [DOI] [PMC free article] [PubMed] [Google Scholar]
- Döpfert J.; Witte C.; Schröder L. J. Magn. Reson. 2013, 237, 34. 10.1016/j.jmr.2013.09.007. [DOI] [PubMed] [Google Scholar]
- Zhao B.; Hansen A. L.; Zhang Q. J. Am. Chem. Soc. 2014, 136, 20. 10.1021/ja409835y. [DOI] [PMC free article] [PubMed] [Google Scholar]
- Ling W.; Eliav U.; Navon G.; Jerschow A. J. Magn. Reson. 2009, 194, 29. 10.1016/j.jmr.2008.05.026. [DOI] [PMC free article] [PubMed] [Google Scholar]
- Long D.; Delaglio F.; Sekhar A.; Kay L. E. Angew. Chem., Int. Ed. 2015, 54, 10507. 10.1002/anie.201504070. [DOI] [PubMed] [Google Scholar]
- Thorarinsdottir A. E.; Du K.; Collins J. H. P.; Harris T. D. J. Am. Chem. Soc. 2017, 139, 15836. 10.1021/jacs.7b08574. [DOI] [PubMed] [Google Scholar]
- Ling W.; Regatte R. R.; Navon G.; Jerschow A. Proc. Natl. Acad. Sci. U. S. A. 2008, 105, 2266. 10.1073/pnas.0707666105. [DOI] [PMC free article] [PubMed] [Google Scholar]
- Cai K.; Haris M.; Singh A.; Kogan F.; Greenberg J. H.; Hariharan H.; Detre J. A.; Reddy R. Nat. Med. 2012, 18, 302. 10.1038/nm.2615. [DOI] [PMC free article] [PubMed] [Google Scholar]
- Vallurupalli P.; Bouvignies G.; Kay L. E. J. Am. Chem. Soc. 2012, 134, 8148. 10.1021/ja3001419. [DOI] [PubMed] [Google Scholar]
- Schmid M. B. Ph.D. Thesis, University of Regensburg Regensburg-Germany, 2011. [Google Scholar]
- Lakhdar S.; Tokuyasu T.; Mayr H. Angew. Chem., Int. Ed. 2008, 47, 8723. 10.1002/anie.200802889. [DOI] [PubMed] [Google Scholar]
- Grošelj U.; Beck A.; Schweizer W. B.; Seebach D. Helv. Chim. Acta 2014, 97, 751. 10.1002/hlca.201400110. [DOI] [Google Scholar]
- El-Hamdouni N.; Companyó X.; Rios R.; Moyano A. Chem. - Eur. J. 2010, 16, 1142. 10.1002/chem.200902678. [DOI] [PubMed] [Google Scholar]
- Zaiss M.; Zu Z.; Xu J.; Schuenke P.; Gochberg D. F.; Gore J. C.; Ladd M. E.; Bachert P. NMR Biomed. 2015, 28, 217. 10.1002/nbm.3237. [DOI] [PMC free article] [PubMed] [Google Scholar]
- Riplinger C.; Neese F. J. Chem. Phys. 2013, 138, 34106. 10.1063/1.4773581. [DOI] [PubMed] [Google Scholar]
- Riplinger C.; Sandhoefer B.; Hansen A.; Neese F. J. Chem. Phys. 2013, 139, 134101. 10.1063/1.4821834. [DOI] [PubMed] [Google Scholar]
- Frisch M. J.; Trucks G. W.; Schlegel H. B.; Scuseria G. E.; Robb M. A.; Cheeseman J. R.; Scalmani G.; Barone V.; Mennucci B.; Petersson G. A.; Nakatsuji H.; Caricato M.; Li X.; Hratchian H. P.; Izmaylov A. F.; Bloino J.; Zheng G.; Sonnenberg J. L.; Hada M.; Ehara M.; Toyota K.; Fukuda R.; Hasegawa J.; Ishida M.; Nakajima T.; Honda Y.; Kitao O.; Nakai H.; Vreven T.; Montgomery J. A. Jr.; Peralta J. E.; Ogliaro F.; Bearpark M.; Heyd J. J.; Brothers E.; Kudin K. N.; Staroverov V. N.; Kobayashi R.; Normand J.; Raghavachari K.; Rendell A.; Burant J. C.; Iyengar S. S.; Tomasi J.; Cossi M.; Rega N.; Millam J. M.; Klene M.; Knox J. E.; Cross J. B.; Bakken V.; Adamo C.; Jaramillo J.; Gomperts R.; Stratmann R. E.; Yazyev O.; Austin A. J.; Cammi R.; Pomelli C.; Ochterski J. W.; Martin R. L.; Morokuma K.; Zakrzewski V. G.; Voth G. A.; Salvador P.; Dannenberg J. J.; Dapprich S.; Daniels A. D.; Farkas Ö.; Foresman J. B.; Ortiz J. V.; Cioslowski J.; Fox D. J.. Gaussian 09; Gaussian, Inc.: Wallingford, CT, 2009.
- Neese F. Wiley Interdiscip. Rev. Comput. Mol. Sci. 2012, 2, 73. 10.1002/wcms.81. [DOI] [PMC free article] [PubMed] [Google Scholar]
- Glendening E. D.; Badenhoop J. K.; Reed A. E.; Carpenter J. E.; Bohmann J. A.; Morales C. M.; Landis C. R.; Weinhold F.. NBO 6.0; Theoretical Chemistry Institute, University of Wisconsin: Madison, WI, 2013.
Associated Data
This section collects any data citations, data availability statements, or supplementary materials included in this article.


