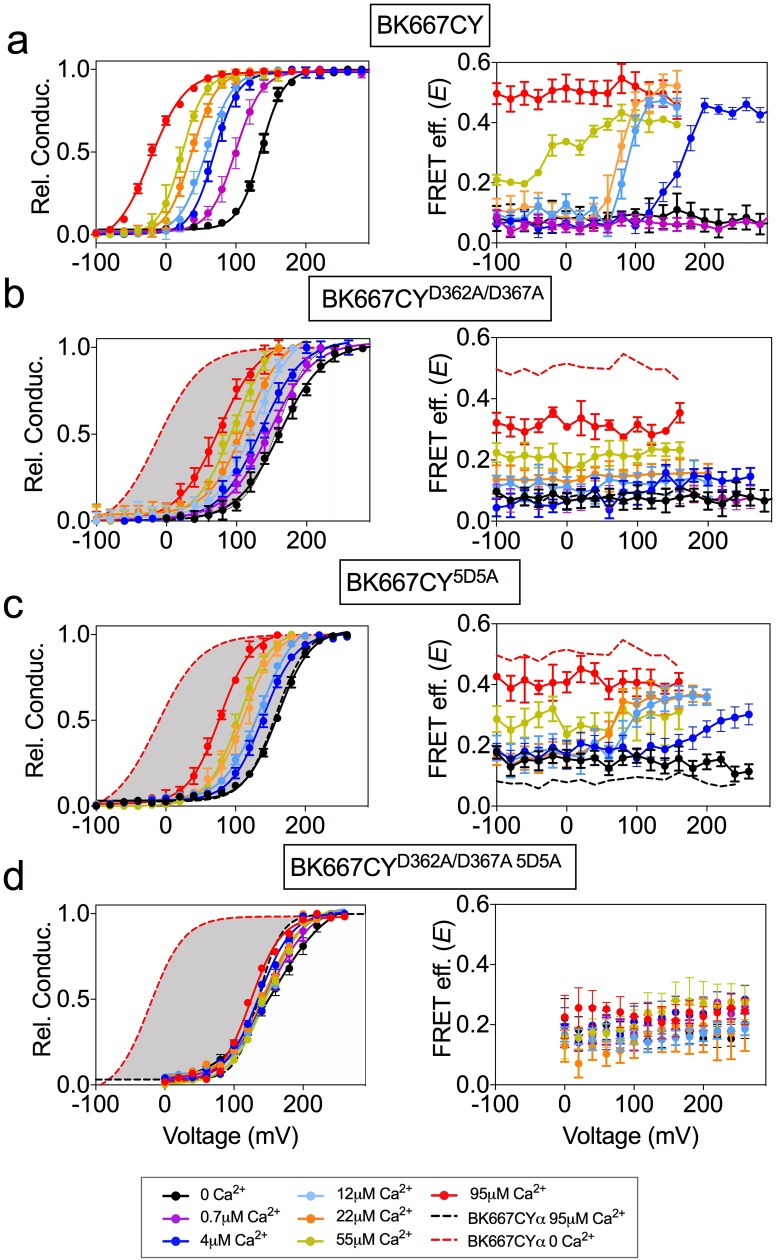
Figure 1. Voltage dependence of gating ring rearrangements is associated to activation of the RCK1 binding site.
G-V (left panels) and E-V curves (right panels) obtained simultaneously at several Ca2+concentrations from (a) the BK667CY construct, (b) mutation of the RCK1 high-affinity site (D362A/D367A), (c) mutation of the Ca2+ bowl (5D5A), or (d) both (D362A/D367A 5D5A). Note that the voltage dependence of the E signal is only abolished after mutating the RCK1 high-affinity binding site (b) or both (d). Data corresponding to each Ca2+ concentration are color-coded as indicated in the legend at the bottom. Solid curves in the G-V graphs represent Boltzmann fits. For reference, grey shadows in (a–d) left panels represent the full range of G-V curves corresponding to non-mutated BK667CY channels from 0 μM Ca2+ to 95 µM Ca2+ (indicated with colored dashed lines). Data points and error bars represent average ± SEM (n = 3–14, N = 2–8). Part of the data in (a, b and c) are taken from (Miranda et al., 2013) and (Miranda et al., 2016).

