

Summary
Mitochondria are key players in the regulation of T cell biology by dynamically responding to cell needs, but how these dynamics integrate in T cells is still poorly understood. We show here that the mitochondrial pro-fission protein Drp1 fosters migration and expansion of developing thymocytes both in vitro and in vivo. In addition, we find that Drp1 sustains in vitro clonal expansion and cMyc-dependent metabolic reprogramming upon activation, also regulating effector T cell numbers in vivo. Migration and extravasation defects are also exhibited in Drp1-deficient mature T cells, unveiling its crucial role in controlling both T cell recirculation in secondary lymphoid organs and accumulation at tumor sites. Moreover, the observed Drp1-dependent imbalance toward a memory-like phenotype favors T cell exhaustion in the tumor microenvironment. All of these findings support a crucial role for Drp1 in several processes during T cell development and in anti-tumor immune-surveillance.
Keywords: mitochondrial dynamics, Drp1, T cells, thymocytes, tumor immune-surveillance, metabolic reprogramming, cMyc, cell migration, exhaustion, cell proliferation
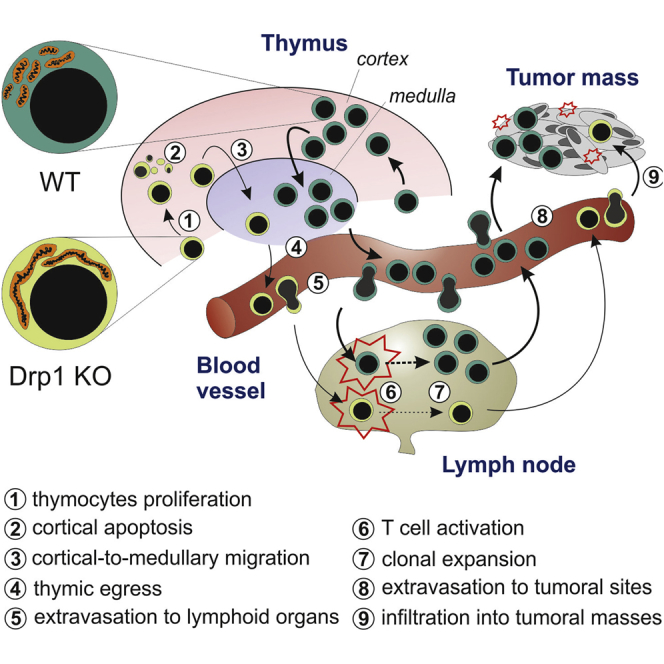
Graphical Abstract
Highlights
-
•
The pro-fission protein Drp1 sustains correct thymocyte maturation
-
•
Drp1 promotes T cell metabolic reprogramming and expansion upon activation
-
•
Drp1 allows efficient T cell extravasation from blood and infiltration into tumors
-
•
An optimal T cell anti-tumor response requires Drp1
Mitochondria are emerging as key players for optimal T cell functionality. Simula et al. demonstrate that the mitochondrial pro-fission factor Drp1 controls thymocyte maturation and plays multiple roles in mature T cells by promoting their proliferation, migration, and cMyc-dependent metabolic reprogramming upon activation; this activity sustains efficient anti-tumor immune-surveillance.
Introduction
Mitochondrial dynamics proteins orchestrate the morphology of mitochondria in eukaryotic cells. The main protein implicated in mitochondrial fragmentation is the GTPase dynamin-related protein-1 (Drp1) (Otera et al., 2013). This protein is recruited from the cytosol upon different post-translational modifications (Chang and Blackstone, 2010) and accumulates on mitochondria through interaction with different receptors (Losón et al., 2013). Besides regulating mitochondrial metabolism, mitophagy, and cytochrome c release (Twig and Shirihai, 2011, Youle and Karbowski, 2005), Drp1 is also essential for cell division (Ishihara et al., 2009, Qian et al., 2012, Zhan et al., 2016). In addition, Drp1 controls in vitro migration of both metastatic cells (Ferreira-da-Silva et al., 2015, Zhao et al., 2013) and lymphocytes (Campello et al., 2006).
Most of these processes, such as proliferation, apoptosis, migration, and metabolic reprogramming, occur physiologically in T cells. During their development, T cell precursors massively proliferate and migrate extensively inside the thymus, undergoing the processes of positive and negative selection (Klein et al., 2014). When matured, these cells re-circulate in the peripheral blood and accumulate into secondary lymphoid organs (SLOs) or in target tissues (Muller, 2014) by crossing the endothelial blood barrier, a process heavily relying on myosin activity (Jacobelli et al., 2013). T lymphocytes accumulating in a tumor lesion are known as tumor-infiltrating lymphocytes (TILs). High amounts of infiltrating cytotoxic CD8+ TILs have been associated with better survival in patients affected by different tumors (Galon et al., 2006) and are emerging as a promising tool for adoptive cell immunotherapy (ACI) (Fridman et al., 2011). Nevertheless, in the tumor microenvironment, TILs may also undergo functional inactivation, acquiring a so-called exhausted phenotype (Wherry and Kurachi, 2015).
Interestingly, optimal T cell activation requires Drp1-dependent mitochondrion accumulation at the immunological synapse (IS) (Baixauli et al., 2011). In addition, although effector T (TE) cells show a fragmented network and rely on aerobic glycolysis, memory T (TM) cells show a more fused network and switch their metabolism toward oxidative phosphorylation (OXPHOS) (Buck et al., 2016).
Given the elucidated physiological roles of mitochondrial fission, we investigated and unveiled a role of Drp1-dependent mitochondrial fission in regulating T lymphocyte development, homeostasis, and, consequently, immune-surveillance in vivo. Our findings show that Drp1 is essential to produce a correct number of thymocytes by affecting their development, to allow efficient TE activation and expansion upon stimulation through the mammalian target of rapamycin (mTOR)-cMyc axis, to exert effective migration into both SLOs and tumor sites, and to regulate TIL exhaustion by controlling the effector or memory differentiation balance. Moreover, we found that extracellular signal-regulated kinase (ERK) mainly regulates Drp1 activation during both T cell receptor (TCR) stimulation and migration. Therefore, chronic inhibition of the main fission-promoting factor Drp1 in T cell lineages determines deficiency of the immune system, reflecting impairment of immune-surveillance by these cells.
Results
Drp1 Controls Developing Thymocyte and Mature T Cell Homeostasis by Regulating Their Number without Affecting Differentiation
Given the emerging role of Drp1 in orchestrating cell proliferation, migration, and death, crucial events during T cell thymic development, we hypothesized that this pro-fission protein had the potential to affect the homeostasis of the developing immune system. We therefore analyzed the effect of specific Drp1 ablation during T cell development in Drp1fl/fl Lck:Cre conditional knockout (Drp1 KO) mice (Ishihara et al., 2009). In 3-month-old mice, we observed a strong reduction in total thymocyte number (Figure 1A), paralleled by a reduction in the volume of the thymic parenchyma (Figure 1B). Together with the absence of Drp1, we confirmed the evidence of a more fused mitochondrial network in KO thymocytes (Figures S1A–S1C) without any significant alteration of organelle functionality (Figures S1D–S1F). Notably, although significantly reduced in number (Figures 1C and 1D), the main subsets of thymocytes were correctly represented (Figure 1E), as well as the levels of TCRγδ+ cells and thymic regulatory T cells (Tregs) and of the maturation markers CD69 and CD62L (Figures S1G–S1I) and the viability of isolated subpopulations (Figure S1J). In line with reduced thymocyte numbers, we also found a specific 2-fold reduction in mature T cell numbers in Drp1 KO mice, both in the blood and spleen (Figure 1F), left unrelieved in other leukocyte subpopulations (Figure 1G). The spleen, similar to the thymus, also showed a slightly reduced volume (Figure 1H). All main mature T cell subtypes (naive, effector, and memory) as well as other secondary populations were normally represented in the spleen or lymph nodes (LNs) (Figures S1K–S1N). Moreover, the viability of splenic T cells was unaltered (Figure S1O). Therefore, mature Drp1 KO T cells also show a reduction in cell number while keeping the capability to effectively differentiate into the main T cell subsets.
Figure 1.

Drp1 Regulates the Number of Developing Thymocytes and Mature T Cells
(A) Total number of thymocytes isolated from +/+ cre+ control and fl/fl cre+ Drp1 conditional KO mice (n = 19).
(B) Representative pictures and size quantification of thymic lobes from +/+ cre+ and fl/fl cre+ mice (n = 6).
(C–E) Total numbers of thymocytes subsets (C and D) and relative percentage (E) according to CD4 and CD8 expression in +/+ cre+ control and fl/fl cre+ Drp1 KO mice (DN, double negative; DP, double positive; SP4/8, single positive-4 and -8 (n = 7).
(F and G) Total number of CD4+ and CD8+ T cells (F), B cells, natural killer (NK) cells, macrophages (Mph), and other major histocompatibility complex class II (I-A and I-E) (MHC-IA and -IE+) myeloid cells (G) isolated from the spleen (n = 9) and blood per milliliter (n = 4) in +/+ cre+ control and fl/fl cre+ Drp1 conditional KO mice.
(H) Representative pictures and size quantification of spleens from +/+ cre+ and fl/fl cre+ mice (n = 6).
Data are reported as mean ± SEM. Significance is indicated as follows: ∗p < 0.05, ∗∗p < 0.01, ∗∗∗p < 0.001. See also Figure S1.
Altogether, these data indicate that the absence of Drp1 does not compromise T cell differentiation; rather, it strongly restrains the number of mature T cells that can patrol the organism against external challenges.
Drp1 Modulates Proliferation of Thymocytes and Activated Mature T Cells
Given such a reduction in cell number, we then investigated whether Drp1 ablation could influence the clonal expansion of thymocytes and of their naive T cell progeny. We observed that both Drp1 KO thymocytes and mature T cells proliferated less in vitro than control cells (Figures 2A–2C). This reduced proliferation rate was not due to defective redistribution of mitochondria to daughter cells during mitosis (Figure S2A). In cancer cells, Drp1 ablation prolongs mitosis length because of hyperfused mitochondria, which engulf centrosomes and disrupt their normal morphology (Qian et al., 2012). Interestingly, we also found the same defects in Drp1 KO thymocytes and mature T cells after stimulation (Figures S2B and S2C; Figures 2D–2G). We also ruled out the possibility of reduced viability (Figure S2D) or of impaired S-phase engagement in mature Drp1 KO T cells (Figures S2E and S2F) without altered levels of reactive oxygen species (ROS) (Figure S2G) or of DNA damage (Figure S2H). Last, we confirmed such a specific role for Drp1 by rescuing KO T cell clonal expansion through active Drp1-S616E overexpression (Figure 2H). Next, we checked whether such a delay in Drp1 KO T cell clonal expansion could also be observed in vivo after antigen recognition. To verify this hypothesis, we pulsed control and conditional Drp1 KO mice with lipopolysaccharide (LPS) and a protein extract of MC38 tumor cells. After 3 days, we found a reduced number of H2Kb:KSPWFTTL dextramer-positive CD8+ cells (which specifically recognize the immuno-dominant MC38 antigen; Chiodoni et al., 1999) in the spleen of KO mice compared with controls (Figure 2I). Similarly, the expansion of CD8+ T cells in the draining LN (DLN) of MC38-derived tumor-bearing (McIntyre et al., 2015) Drp1 KO mice, was strongly reduced compared with control mice (Figure 2J).
Figure 2.

Drp1 Is Involved in the Regulation of Thymocytes and Mature T Cell Proliferation
(A and B) Number of EdU+ +/+ cre+ control and fl/fl cre+ Drp1 KO thymocytes 3 and 4 days after in vitro activation (A, n = 5), also distinguishing DP and the mean of single positive 4 and single positive 8 (SP) thymocytes at 3 days (B, n = 6).
(C) Fold increase in the total number of viable (annexin V [annV−]) CD8+ and CD4+ T cells 3, 4, and 6 days after in vitro activation (n = 5).
(D and E) Release from overnight (o.n.) nocodazole block for CFSE-labeled +/+ cre+ control and fl/fl cre+ Drp1 KO 5-day in vitro-activated CD8+ (D, n = 4) and CD4+ (E, n = 4) T cells. The percentage of divided cells (halving of CFSE mean fluorescence index [MFI]) for each time point is shown in the corresponding graphs.
(F) Representative confocal planes of the centrosome (γ-tubulin) morphology and quantification of the percentage of 6-day in vitro-activated +/+ cre+ control and fl/fl cre+ Drp1 KO T cells with aberrant centrosome morphology (n = 3).
(G) Relative position of centrosomes (the white arrow points to an altered centrosome structure) and mitochondria (TOM20, low resolution because of methanol fixation) in T cells, irrespective of the genotype (n = 3).
(H) Fold increase in cell number upon in vitro IL-2-induced expansion in +/+ cre+ control and fl/fl cre+ Drp1 KO T cells after electroporating either empty vector pEYFP-C1 or pEYFP-C1-Drp1-S616E plasmids (n = 3).
(I) Total number of dextramer+ CD8+ cells recovered from spleens of +/+ cre+ control and fl/fl cre+ Drp1 KO mice 4 days after i.p. injection with LPS alone (unpulsed) or LPS and MC38 extract (pulsed) (n = 9 control [ctrl]; 8 KO).
(J) Total number of CD8+ T cells isolated from contralateral inguinal lymph nodes (CLNs) and draining inguinal LNs (DLNs) of +/+ cre+ control and fl/fl cre+ Drp1 KO mice bearing 14-day-old MC38-derived tumors (n = 6 ctrl, 4 KO).
Data are represented as mean ± SEM. Scale bar, 5 μm in (F) and (G). Significance is indicated as follows: ∗p < 0.05, ∗∗p < 0.01, ∗∗∗p < 0.001. See also Figure S2.
Altogether, these data suggest that Drp1 is crucial to sustain the generation of an optimal number of both developing thymocytes and activated T cells upon challenge.
Drp1 Is Required to Promote cMyc Activation upon TCR Engagement
Alterations in mitochondrial dynamics can influence the effector or memory differentiation after T cell activation by directly modulating T cell metabolism, which, in turn, dictates T cell fate (Buck et al., 2016). However, the molecular mechanism of this association is not fully understood. Interestingly, Drp1 silencing in T cells prevents mitochondrial accumulation at IS and excessively increases calcium influx upon activation (Baixauli et al., 2011). Consistent with this, although our Drp1 KO T cells correctly expressed several activation markers upon stimulation, they did not accumulate mitochondria at IS and displayed a stronger calcium influx (Figures S3A, 3A, and 3B). To investigate the consequences of such dysregulation, we reasoned that stimulation-dependent calcium increase promotes the activation of AMP-activated protein kinase α (AMPKα) (Tamás et al., 2006), which, in turn, controls metabolic adaptation, by negatively regulating mTOR (Blagih et al., 2015). mTOR is a master gene in promoting the metabolic reprogramming of T cells upon activation and also by positively acting on cMyc translation (West et al., 1998). We therefore asked whether such an AMPK-mTOR-cMyc axis may be altered in KO cells. We first confirmed the presence of this regulatory pathway in our wild-type (WT) T cells (Figures S3B–S3D). Then we looked at Drp1 KO T cells, in which calcium influx is increased. As expected, we found increased levels of active AMPKα, reduced levels of active mTOR, and lower expression of cMyc (Figure 3C). Last, we confirmed that the observed alterations in KO T cells originate from such a dysregulated pathway because in KO T cells, increased AMPKα activation upon TCR stimulation depends on calcium influx, as shown by using calcium chelators (Figure 3D), and downregulation of mTOR signaling and cMyc expression are due to AMPKα over-activation, as shown in AMPKα inhibitor-driven rescue experiments (Figure 3E).
Figure 3.

Drp1 Controls the Metabolic Reprogramming of Activated T Cells
(A) Mitochondria (TOM20) distribution in +/+ cre+ control and fl/fl cre+ Drp1 KO T cells stimulated with anti-CD3-coated beads (referred to as B, labeled with anti-CD3 antibody, red) (n = 4).
(B) Fluo3-AM-loaded +/+ cre+ control and fl/fl cre+ Drp1 KO T cells were incubated with the aCD3 antibody. After acquiring Fluo3-AM baseline fluorescence, a secondary antibody was added, and fluorescence was acquired up to 6 min. The fold increase in maximum (at 2 min) and residual (at 5 min) Fluo3-AM fluorescence relative to baseline is reported in the graph on the right (n = 5 ctrl, 4 KO).
(C) Expression levels of the indicated (phospho)-protein in +/+ cre+ control and fl/fl cre+ Drp1 KO T cells stimulated in vitro for the indicated time. Quantification of the KO:ctrl ratio for the indicated (phospho)-proteins is reported in the graph on the right (AMPK-mTOR, n = 5; cMyc, n = 4; S6, n = 3). cMyc levels are reported 48 hr post-stimulation (maximal upregulation), but similar results were also obtained at 5 hr.
(D and E) Expression levels and relative quantifications of the indicated (phospho)-protein from +/+ cre+ control and fl/fl cre+ Drp1 KO T cells activated in vitro for 5 hr in the presence of the calcium chelators 1,2-bis(o-aminophenoxy)ethane-N,N,N′,N′-tetraacetic acid acetoxymethyl ester (BAPTA-AM) and EDTA (D, n = 3) or the AMPK inhibitor Compound-C (E, n = 3).
(F and G) RNA sequencing (RNA-seq) analysis in 3-day in vitro-activated +/+ cre+ control and fl/fl cre+ Drp1 KO T cells.
(F) Heatmap of cMyc-dependent metabolic genes in T cells (cMyc-MG) expression in +/+ cre+ control and fl/fl cre+ Drp1 KO T cells, with glycolytic genes highlighted.
(G) The differential mRNA expressions (normalized association score) from enrichment gene set association analysis (GSAA) of the cMyc-MG group from (F) and additional metabolic pathways (whose heatmaps are reported in Figure S3F). TCA, tricarboxylic acid; PPP, pentose phosphate pathway; FAS, fatty acid synthesis; FAO, fatty acid oxidation. For each group, transcriptional enrichment in KO cells compared with controls is highlighted in red, downregulation in blue and no net difference in black (n = 3).
(H–J) Seahorse analysis of extracellular acidification rate (ECAR) (H) and oxygen consumption rate (OCR) (I and J) rates in 6-day in vitro-activated +/+ cre+ control and fl/fl cre+ Drp1 KO CD8+ T cells (2-DG, 2-deoxyglucose; Rot/an, rotenone and antimycin). FA oxidation was measured with BSA-palmitate with or without etomoxir (J). The following parameters were quantified: glycolysis (Glyc), maximal glycolytic capacity (MGC); basal OXPHOS (basal OX), maximum respiratory capacity (MRC), and basal (basal) and maximal (max) FA oxidation (n = 3).
(K) MFI for IL7Ra (n = 17), CD44 (n = 12), KLRG1 (n = 9), IFNγ (n = 10), TNF-α (n = 6), IL-2 (n = 4), and IL-4 (n = 7) and for the Tbet:Eomes ratio (n = 8) in 6-day in vitro-activated CD8+ +/+ cre+ control and fl/fl cre+ Drp1 KO T cells under the indicated polarizing conditions.
Data are represented as mean ± SEM. Scale bar, 10 μm in (A). Significance is indicated as follows: ∗p < 0.05, ∗∗p < 0.01, ∗∗∗p < 0.001. See also Figure S3.
In sum, the altered calcium influx in the absence of Drp1 impairs cMyc upregulation following T cell activation.
Drp1 Supports Metabolic Reprogramming of TE Cells upon Activation
Because cMyc is required for the transcription of metabolic genes in T cells upon activation (Wang et al., 2011), its reduced expression in Drp1 KO T cells may affect the transcription profile of these cells. Indeed, we observed that KO cells show reduced transcription of many cMyc-dependent metabolic genes (Wang et al., 2011), particularly those related to the glycolytic pathway (Figures 3F, 3G, S3E, and S3F; Table S1). Consequently, glycolysis is downregulated at the transcriptional level in Drp1 KO cells, at variance with OXPHOS, tricarboxylic acid (TCA) cycle and fatty acid (FA) synthesis, and β-oxidation, which are upregulated (Figures 3G, S3E, and S3F; Table S1). This altered gene expression may predispose Drp1 KO T cells to an altered metabolic status. Indeed, KO T cells showed a reduction in their glycolytic rate (Figures 3H and S3G) and an increase in their OXPHOS (Figures 3I and S3H), which can be at least partially due to augmented levels of FA oxidation (Figures 3J and S3I). These alterations are not related to the amount of mitochondrial mass and the membrane potential or to the levels of glucose uptake or the amount of ATP produced because these parameters are not affected in KO T cells (Figures S3J–S3L). Although TE cells are mainly glycolytic, TM cells preferentially rely on FA-dependent oxidative metabolism (O’Sullivan et al., 2014). Interestingly, both inhibition of glycolysis (Sukumar et al., 2013) and a forced increase in FA oxidation rate (O’Sullivan et al., 2014) or OXPHOS (Buck et al., 2016) promote a TE-to-TM shift after activation. Because the metabolism of Drp1 KO T cells is completely re-shaped from a glycolytic (TE-like) toward an oxidative (TM-like) one, we asked whether our Drp1 KO T cells may also show a TM-like phenotype, even when cultured under effector-promoting conditions. Indeed, we observed such a TE-to-TM shift, as indicated by altered CD127 and KLRG1 expression and the ratio between Tbet and Eomes expression, with a higher production of interleukin-2 (IL-2) (only for CD8+) and interferon γ (IFNγ) (Figures 3K and S3M). The latter is correctly released after stimulation (Figure S3N), suggesting that the Drp1 absence does not per se compromise cytokine release from T cells.
Therefore, Drp1 KO T cells shifted toward a memory-like phenotype upon in vitro activation because of their inability to fragment their mitochondrial network and the consequent downregulation of cMyc activity.
Drp1 Avoids Thymocyte Cell Death in Thymic Cortical Areas and Directs Their Cortico-medullary Migration
Given the existing data in vitro regarding the role of mitochondrial dynamics in human lymphocyte migration (Campello et al., 2006), we hypothesized that the impairment in Drp1 KO thymocyte development could be partially ascribed to a migratory defect of these cells. As expected, upon chemokine stimulation, WT thymocyte mitochondria accumulate at the uropod around the microtubule-organizing center (MTOC) in a microtubule-dependent way and actively fragment prior to transport along microtubules, in line with the observed activation of the pro-fission protein Drp1 by Ser616 phosphorylation (Figures 4A–4E). Such mitochondrial fragmentation failed in Drp1 KO thymocytes, which, as a consequence, showed defective cell polarization upon chemokine stimulation (Figures 4D and 4F), thus indeed recapitulating the same mechanism observed in other mature cells (Campello et al., 2006, da Silva et al., 2014, Zhao et al., 2013). Because accumulation of mitochondria at the uropod is required for phosphorylation of myosin light chain 2 (MLC2) (Campello et al., 2006), which sustains lymphocyte migration (Jacobelli et al., 2013), we consistently found a lower uropodal pMLC2 signal in WT cells treated with oligomycin (despite any prevention of mitochondrial relocalization) and in Drp1 KO thymocytes compared with WT ones (Figures S4A and S4B) and a reduced in vitro migration rate in all main Drp1 KO thymocyte subsets irrespective of the thymic chemokines used and despite correct expression of the corresponding receptors (Figure 4G and S4C). Interestingly, we observed a slight increase in the percentage of single positive (SP) thymocytes expressing Sphingosine-1 phosphate receptor 1 (S1p-R1) (Figure S4D). This could be a consequence of a defective thymocyte migration rate in response to the S1p gradient, which is normally required for thymus exit toward blood circulation of “freshly matured” thymocyte (Matloubian et al., 2004). Indeed, an in vitro S1p gradient-mediated migration assay on SP thymocytes confirmed our hypothesis (Figure S4E). Because chemokine-driven cell migration is essential for cortical area crawling and recruitment of maturing thymocytes to medullary islets (Nitta et al., 2009, Plotkin et al., 2003), the reduced in vitro migration rate of Drp1 KO thymocytes could suggest an in vivo altered distribution of these cells in different thymic areas. Indeed, we found a reduced proportion of medullary thymocytes compared with cortical ones in KO mice (Figure 4H). Such disproportion could be indicative of a thymocyte inability to reach these areas and of a longer persistence in the thymic cortex. We also found a slight reduction in medullary islet (keratin-5+) mean area in Drp1 KO mice (Figure S4F), a phenotype normally associated with reduced amounts of medullary thymocytes (Nitta et al., 2009). Thymocyte migration is also essential for correct progression along the positive and negative selection processes; therefore, as an outcome of their (in)efficiency, we looked at apoptosis in situ. Increased apoptotic cell density limited to cortical areas of KO thymi (Figure 4I) was found, not as a result of different sensitivity to apoptotic stimuli, as assessed in vitro (Figure S4G). However, these alterations did not lead to the development of auto-reactive T cells, as assessed by the absence of salivary gland infiltration (Figure S4H), a common target of negative selection-dependent auto-immunity (Nitta et al., 2009).
Figure 4.

Drp1 Is Necessary to Sustain Thymocyte Migration, Controlling Their Distribution and Survival in Thymic Areas
(A–C) Mitochondria (TOM20) with the uropod marker ICAM1 (A, n = 3) or tubulin (B, n = 3) in WT thymocytes stimulated with CXCL12 or with tubulin in WT thymocytes pre-treated with nocodazole (C, n = 3).
(D) Mitochondrial morphology (TOM20) in +/+ cre+ control and fl/fl cre+ Drp1 KO thymocytes treated with nocodazole and then stimulated with CXCL12. The fusion index (STAR Methods) is reported in the graph (n = 2).
(E) Expression levels of the indicated (phospho)-proteins in +/+ cre+ control and fl/fl cre+ Drp1 KO thymocytes stimulated with CXCL12 or CCL21 chemokines (n = 3).
(F) Mitochondria (TOM20) and the uropod marker ICAM1 in +/+ cre+ control and fl/fl cre+ Drp1 KO thymocytes stimulated with CXCL12. The percentage of cells with colocalized mitochondria and ICAM1 is reported in the graph (n = 3).
(G) Transwell migration assay of +/+ cre+ control and fl/fl cre+ Drp1 KO thymocytes in the presence of the indicated chemokines (n = 4).
(H) Representative images and relative quantification of cells’ MFI of CD4+ and CD8+ staining distribution in medulla (Keratin5+) and cortex (Keratin5−) areas from +/+ cre+ control and fl/fl cre+ Drp1 KO thymic sections (n = 8). Shown on the right are magnifications of the yellow squares on the left.
(I) Representative terminal deoxynucleotidyl transferase dUTP nick end labeling (TUNEL) assay in +/+ cre+ control and fl/fl cre+ Drp1 KO thymic sections with differentiated medulla (K5+) or cortical areas. Shown below is a relative quantification of the Drp1 KO:control ratio of TUNEL+ cell density (cell number per area, automatically identified by Volocity software, indicated as yellow spots in the “count” panel) for cortical (K5−) and medullary (K5+) areas (n = 5).
Data are represented as mean ± SEM. Scale bars, 5 μm in (A)–(D) and (F), 50 μm in (H), and 200 μm in (I). Significance is indicated as follows: ∗p < 0.05, ∗∗p < 0.01, ∗∗∗p < 0.001. See also Figure S4.
Taken together, these data indicate that Drp1 is required to sustain the proper migration and survival of thymocytes in the thymic parenchyma, thus being crucial for the correct development of a normal T cell repertoire.
Drp1 Regulates Mature T Cell Extravasation and Homing to Secondary Lymphoid Organs through Its ERK1/2-Dependent Activation
We next investigated whether the defect in cell migration was maintained in mature Drp1 KO T cells following in vitro activation and whether this could lead to an impairment in extravasation toward SLOs and inflamed or endangered sites (Muller, 2014). As expected, in vitro-activated Drp1 KO mature T cells recapitulated the same results obtained in thymocytes in terms of impairment in mitochondria and cell polarization and MLC2 phosphorylation (Figures 5A and S5A). Notably, myosin activity, depending on ATP-fueled phosphorylation of its MLC2 subunit (Tan et al., 1992), is even more critical in T cell extravasation (Jacobelli et al., 2013); Drp1 KO lymphocytes were indeed defective upon crossing a tumor necrosis factor α (TNF-α)-activated endothelial cell monolayer. Despite normal adhesion, diapedesis was severely impaired in KO cells, and their crawling was severely altered (Figure 5B; Video S1). The transmigration defect was independent of the chemokine used and of defective expression of adhesion molecules or chemokine receptors (Figures S5B and S5C). Prompted by our in vitro results, we next investigated the extravasation in vivo. Indeed, in vitro-activated and Carboxyfluorescein succinimidyl ester (CFSE)-labeled Drp1 KO T cells showed defective accumulation inside SLOs compared with eFluor670-labeled WT control cells 24 hr after intravenous (i.v.) injection into recipient WT mice (Figure 5C). By contrast, when inside the LNs, Drp1 KO T cells were evenly distributed among B and T cell zones (Figure S5D). Also, we confirmed the context-specific role of Drp1 by rescuing KO T cell migration upon active Drp1-S616E overexpression (Figure S5E).
Figure 5.

Drp1 Is Essential to Promote Mature T Cell Extravasation and Homing into Secondary Lymphoid Organs and Is Regulated by ERK-Mediated Phosphorylation
(A) Mitochondria (TOM20) and the uropodal marker (ICAM1) in +/+ cre+ control and fl/fl cre+ Drp1 KO 6-day in vitro-activated T cells stimulated with CCL21 (n = 6).
(B) Activated eFluor 670-control (red) and CFSE-Drp1 KO (green) T cell extravasation across an endothelial monolayer. Shown are representative images and quantifications of the Drp1 KO:control cell ratio for adhesion or extravasation by distinguishing the cells above (no arrows) or below (control, black arrows; KO, white arrow) the endothelial monolayer (top, n = 4). Also shown is a representative image and quantifications of the mean speed and displacement rate for tracks of control and Drp1 KO T cells migrating on and through the endothelial monolayer (bottom, n = 3). See also Video S1.
(C) I.v. injection of 1:1 in vitro-activated +/+ cre+ control (eFluor 670-labeled) and fl/fl cre+ Drp1 KO (CFSE-labeled) T cells into a WT recipient. After 24 hr, the KO:control ratio between cells recovered from the blood, spleen, and LN pool was quantified (n = 9).
(D) Expression levels of the indicated (phospho)-protein in +/+ cre+ control and fl/fl cre+ Drp1 KO T cells stimulated with the CCL21 chemokine in the presence or absence of the ERK inhibitor FR180204 (ERKi). Quantification of the fold increase in the expression level of the indicated phospho-proteins over control upon CCL21 stimulation is reported in the graph (n = 4).
(E and F) Mitochondrial network (E, TOM20, in green) and western blot (WB) analysis (F) of the levels of the indicated (phospho)-proteins in WT T cells unstimulated (0 hr) or activated in vitro for 48 hr in the presence or absence of FR180204 (ERKi) (n = 3).
Data are represented as mean ± SEM. Scale bars, 10 μm in (A) and (E) and 30 μm in (B). Significance is indicated as follows: ∗p < 0.05, ∗∗p < 0.01, ∗∗∗p < 0.001. See also Figure S5.
Live imaging of T cells activated in vitro for 6 days and then stained with CFSE (+/+ cre+ control cells) or CMTMR (fl/fl cre+ Drp1 KO cells), mixed at 1:1 ratio and plated upon an endothelial monolayer in humidified chamber at 37°C, 5% CO2. Bright field, green and red channel images were taken every 30 s. Automatic identification of +/+ cre+ control (CMTMR) and fl/fl cre+ Drp1 KO (green) T cells tracks by Volocity software. Position and tracks of the cells at the end of the video are reported in the Figure 5B.
Last, we found that, similarly to thymocytes, Drp1 is actively phosphorylated on Ser616 upon chemokine stimulation in mature T cells, further linking chemokine receptor stimulation with mitochondrial fission (Figure 5D). Interestingly, the mitogen-activated protein kinase (MAPK)-ERK pathway is activated downstream of chemokine receptor signaling (Bonacchi et al., 2001), and ERK is a known regulator of Drp1 phosphorylation on Ser616 (Kashatus et al., 2015). Consistently, the ERK inhibitor FR180204 prevented Drp1 phosphorylation and mitochondrial fragmentation in lymphocytes upon chemokine stimulation and in TE cells upon TCR engagement (Figures 5D–5F), and another signal, the latter, triggering both MAPK-ERK activation (Lapinski and King, 2012) and mitochondrial fission (Buck et al., 2016). Of note, we observed that mitochondrial fragmentation is impaired in Drp1 KO cells upon TCR engagement, confirming its direct dependence on Drp1 activity under these conditions (Figures S5F and S5G).
Altogether, these results indicate a reduced ability of Drp1-deficient T cells to recirculate in vivo inside SLOs, a pivotal process for immune-surveillance.
Drp1 Ablation Favors Accelerated Tumor Growth by Locally Reducing Infiltration and Increasing an Exhausted Phenotype of T Cells
Given the reduced extravasation rate of Drp1 KO T cells in vivo, we hypothesized that Drp1 ablation in the T cell lineage could also affect local infiltration of these cells in a solid tumor site. To explore this hypothesis, we chose a highly immunogenic solid tumor model. We injected in vitro-activated and differently labeled control and KO T cells in WT recipient mice bearing MC38-derived tumors (McIntyre et al., 2015). We observed a reduced ability of exogenous KO T cells to accumulate in the inguinal DLN and isolated fewer KO TILs from the dissected tumor mass (Figure 6A). This finding was also confirmed by immunofluorescence on tumor slices (Figure S6A) and was even more striking when limiting the analysis to CD8+ cells, the cell population preferentially recruited into tumor masses compared with the CD4+ one (Figure 6B). Therefore, these data suggest that Drp1 KO T cells, besides recirculating less inside SLOs, also have an impaired ability to reach a tumor mass from the blood circulation.
Figure 6.

Drp1 Is Required for T Cell Accumulation into Draining LNs and for Infiltration and Exhaustion into Tumor Masses during Immune-Surveillance
(A and B) In vitro-activated control (eFluor670-labeled) and Drp1 KO (CFSE-labeled) T cells were injected i.v. into WT recipient mice bearing 13 day-old MC38-derived tumors. After 24 hr, peripheral blood (PB), inguinal DLNs, and tumor masses (TILs) were collected, and the KO:control ratio (A, both total T cells or CD8+ T cells only) and the exogenous CD8+:CD4+ T cell ratio (B) (considering both control and KO cells) were quantified by flow cytometry (TILs, n = 4; DLNs, n = 6).
(C) Size of MC38-induced s.c. tumors in +/+ cre+ control and fl/fl cre+ Drp1 conditional KO mice at the indicated times (n = 11 ctrl, 8 KO).
(D) Tumor weight graphs and pictures of representative MC38-derived tumors isolated 18 days after cell injection (n = 11 ctrl, 8 KO).
(E and F) Absolute number of +/+ cre+ control and fl/fl cre+ Drp1 KO CD4+ and CD8+ T cells collected from inguinal DLNs (E) or from MC38-derived tumors (TILs) (F) 18 days after s.c. tumor cell injection (n = 14 ctrl, 11 KO).
(G) CD8+ or CD4+ IHC staining on 18-day-grown isolated MC38-derived tumor slices. Quantification of CD8+ and CD4+ TILs density is reported in the corresponding graph (n = 5 ctrl, 6 KO).
(H) Density of dextramer+ CD8+ TILs per field, calculated by combining the percentage of recovered CD8+ dextramer+ cells by cytofluorimetric analysis with the quantification of total CD8+ TIL density by IHC (n = 5 ctrl, 5 KO).
(I) Correlation between tumor size and CD8+ TIL percentage among CD45+ cells in tumor-bearing +/+ cre+ control and fl/fl cre+ Drp1 KO mice. R = −0.661, p = 0.019 (n = 5 ctrl, 7 KO).
(J and K) Relative expression of CX3CR1 (negatively, intermediately, or highly expressed) (J, n = 9) or PD1 (K, n = 9) in +/+ cre+ control and fl/fl cre+ Drp1 KO CD8+CD44+ T cells collected from DLNs or from MC38-derived tumors (TILs) 18 days after s.c. tumor cell injection.
(L) Percentage of CD44+ cells among all CD8+ and of IFNγ+, Tbet+, and Eomes+ cells among all CD8+CD44+ T cells isolated from DLNs or in the tumors (TILs) of +/+ cre+ control and fl/fl cre+ Drp1 KO mice 18 days after s.c. tumor cell injection and after 6 hr of in vitro T cell re-stimulation (n = 5 ctrl, 7 KO).
Data are represented as mean ± SEM in (C), (E), and (J) and as dot density plots in (A), (B), (D), (F)–(H), (K), and (L). Data are from two representative of four independent experiments. Scale bars, 5 mm in (D) and 100 μm in (G). Significance is indicated as follows: ∗p < 0.05, ∗∗p < 0.01, ∗∗∗p < 0.001. See also Figure S6.
Based on such in vivo evidence, we next asked whether the adaptive immune-surveillance against tumors could be compromised in mice with a specific Drp1 deficiency in the T cell lineage. To this end, we subcutaneously (s.c.) injected MC38 tumor cells into WT and Drp1 conditional KO mice and monitored the tumor mass growth for up to 18 days. Interestingly, tumors grew faster in Drp1 KO mice (Figure 6C; Figure S6B) and, after surgical excision, had a significantly higher volume and weight compared with time-matched tumors grown in WT mice (Figures 6C and 6D). As expected, we found fewer CD8+ and CD4+ T cells in the inguinal DLNs (Figure 6E) and the tumor masses of KO mice (Figure 6F), whereas this was not observed in other leukocyte populations (Figure S6C). Moreover, we found a normal ratio between CD4+ effector and regulatory T cells (Figure S6D). The density reduction of lymphocytes infiltrating tumor foci was also confirmed in situ by immunohistochemistry (IHC) (Figure 6G) and also observed when considering only the dextramer+ Drp1 KO CD8+ TILs (Figure 6H), which specifically recognize the main tumor immuno-antigen for the correct elimination of tumor cells. Indeed, supporting the idea of T lymphocyte-mediated control of the tumor growth in this model, we found that the tumor mass strongly and inversely correlated with CD8+ TIL frequency among all leukocytes (Figure 6I).
Of note, the faster tumor growth in Drp1 KO mice did not depend on defective KO T cell cytotoxicity. Indeed, KO CD8+ splenocytes of MC38 tumor-bearing mice correctly degranulated and released granzymeB in vitro upon stimulation or in the presence of MC38 target cells, which were efficiently killed by WT and KO T cells at the same rate (Figures S6E–S6H).
Interestingly, in line with our in vitro data indicating a TE-to-TM shift after Drp1 KO T cell activation, we found, in vivo, a significantly increased proportion of CX3CR1neg memory precursor effector cells (MPECs) over CX3CR1high short-living effector cells (SLECs) (Gerlach et al., 2016) among KO CD8+ TILs (Figure 6J). This, when combined with the overall reduction in KO CD8+ TILs in the tumor mass, leads to a specific reduction in the total number of SLECs (Figure S6I). Interestingly, memory T cells may also spontaneously arise in vivo from naive T cells because of lymphopenia-induced proliferation (Cho et al., 2000, Goldrath et al., 2000). However, WT and Drp1 KO naive T cells do not convert into memory ones, regardless of the genetic background of recipient mice (Figure S6J), excluding that the partial reduction in mature T cell number observed in Drp1 KO mice may be a driver of such increased generation of a memory-like phenotype in vivo, further strengthening the role of the altered metabolism in such regulation.
Eventually, because MPECs are more prone to acquire an exhausted phenotype (TEX) than SLECs (Angelosanto et al., 2012), we investigated whether their increased proportion in Drp1 KO TILs could correlate with a TEX increase. Indeed, we found an increase in PD-1+ (marker of TEX) cells among KO CD8+ TILs and, consistent with such increased MPECs and TEX generation, lower production of IFNγ, lower expression of Tbet, and higher expression of Eomes (Figures 6K and 6L). Notably, Drp1 ablation does not affect, per se, PD-1 expression in SLOs of tumor-free or tumor-bearing mice (Figures S6K and 6K) or in any of the three CX3CR1 subsets (negatively, intermediately, and highly expressed) of TILs from MC38-derived tumors (Figure S6L). By contrast, we observed in vitro that PD-1 upregulation upon repetitive cell stimulation cycles correlates with increased levels of memory cells in Drp1 KO mice during expansion phases (Figure S6M), further supporting the existing correlation between Drp1 ablation, a MPEC phenotype, and the tendency to undergo functional exhaustion. This evidence suggests that the increased amount of TEX cells in Drp1 KO TILs is most likely a local consequence of the SLEC-to-MPEC shift in the absence of Drp1.
Last, Drp1 KO T cells were also less able than WT cells to control tumor growth when injected i.v. into tumor-bearing WT mice and poorly infiltrated the tumor mass (Figures 7A–7C), suggesting the importance of preserving Drp1 activity in T cells for immuno-therapeutic applications in human cancer patients.
Figure 7.

Reduced Protection in the Absence of Drp1 during Adoptive Cell Immunotherapy
(A) Experimental plan.
(B) Tumor size assessed in WT mice bearing MC38-derived tumors and receiving mitochondria-tagged yellow fluorescent protein (mtYFP+) control (+/+ cre+) or Drp1 KO (fl/fl cre+) T cell i.v. injection (n = 5 mice per group).
(C) Number of exogenous mtYFP+ control (+/+ cre+) or Drp1 KO (fl/fl cre+) T cells injected into tumor-bearing WT mice and recovered from the tumor mass after isolation (n = 4 ctrl, 3 KO).
Data are represented as mean ± SEM. Significance is indicated as follows: ∗p < 0.05, ∗∗p < 0.01.
Overall, we can conclude that the faster tumor growth observed in Drp1 KO mice correlates with a strong reduction in TIL infiltration and effector functions. The former is due to impaired (trans)migration and the latter due to a SLEC-to-MPEC phenotype shift with the consequent generation of more exhausted TILs.
Discussion
Our data demonstrate that tumors have accelerated growth in a mouse model in which mitochondrial fission is impaired by specific deletion, early in development, of Drp1 in T lymphocytes. This is mainly due to reduced T cell infiltrates in the tumor mass and increased levels of exhaustion, highlighting a crucial impairment of lymphocyte immune-surveillance.
Interestingly, these defects involve T cell development as a whole because proliferative and migratory defects are observed starting from developing thymocytes. The reduction in thymocyte cell number is partly due to a reduced proliferation rate and partly due to increased apoptosis in cortical areas of the thymus, where positive selection occurs (Klein et al., 2014). Interestingly, Drp1-mediated thymocyte migration seems to be required for their correct interaction with cortical, but not medullary, antigen-presenting cells (APCs), locally promoting their survival. Of note, because medullary thymocytes move more rapidly and straighter than cortical ones (Ehrlich et al., 2009), defective mitochondrial relocation to the uropod could more severely affect thymocytes’ capability to efficiently change trajectory over time rather than their absolute migration rate.
In mature T cells, our data indicate that Drp1 regulates three distinct cellular processes, all dependent on mitochondrial dynamics and all contributing to immune-surveillance against tumor growth: metabolic reprogramming, proliferation, and migration.
It has been reported that, during TE cell differentiation, mitochondrial fragmentation favors disassembly of electron transport chain (ETC) complexes, reducing the OXPHOS rate while favoring glycolysis (Buck et al., 2016). Besides recapitulating these metabolic data under our conditions, we observed that such fragmentation is dependent on ERK-mediated Drp1 activation. Of the highest importance is that our data indicate that Drp1 may also sustain glycolysis in TE cells, with an additional, but not mutually exclusive, transcriptional mechanism still dependent on mitochondrial shaping. Indeed, in T cells lacking Drp1, upon TCR engagement, we found increased extracellular calcium uptake, most likely because of impaired relocation of non-fragmented mitochondria at the IS (Baixauli et al., 2011). This has as a consequence dramatic alteration of the AMPK-mTOR-cMyc axis and reduced cMyc expression. Because cMyc promotes the transcription of glycolytic enzymes in T cells upon activation (Wang et al., 2011), it is not surprising to observe that Drp1 KO T cells show defective transcription of such enzymes and, as a consequence, a more oxidative metabolism compared with WT cells. This, in turn, generates a persistent mitochondrial morphology-dependent oxidative metabolism that drives the generation of a memory-like phenotype, as suggested by Sukumar et al. (2013). Whether this mechanism may also explain the connection between mitochondrial fission or fusion and glycolysis or OXPHOS in cancer cells will be an important aspect to investigate in the future (Simula et al., 2017). In addition, the OXPHOS-based metabolism of Drp1 KO T cells also affects the generation of memory-like T cells in vivo without any significant contribution of lymphopenia-induced proliferation in the conversion of naive T cells into memory ones.
Our data also indicate that Drp1 is required to sustain optimal T cell proliferation. However, this is not associated with the altered metabolism of Drp1 KO T cells, as also demonstrated for Drp1-silenced cancer cells (Qian et al., 2012). Indeed, nucleoside synthesis enzymes (data not shown), lipid metabolism, ATP or ROS levels, and DNA damage are unaltered in Drp1 deficiency. Consistent with this, KO T cells do not show any alteration in their progression into S phase, as suggested by a similar rate of 5-ethynyl-2'-deoxyuridine (EdU) incorporation. So how to explain the effect of Drp1 on the rate of cell proliferation? Interestingly, in cancer cells (Qian et al., 2012), Drp1 ablation prolongs mitosis length because of hyperfused mitochondria, which do not redistribute in the cytoplasm, as physiologically occurs during mitosis, but accumulate and engulf the centrosomes and disrupt their normal morphology, a phenotype clearly recapitulated in our T cells.
Last, we found that Drp1 is required in mature T cells for their correct migration. Although we already showed most of the mechanistic details regarding the regulation of T cell migration by mitochondrial dynamics (Campello et al., 2006), our study directly identifies Drp1 as a key mediator of this process. Interestingly, we also observed that Drp1 is actively phosphorylated by ERK upon chemokine stimulation, similar to what was observed upon T cell activation. This suggests that, besides cancer cells (Kashatus et al., 2015), the MAPK-ERK pathway is also a key general regulator of mitochondrial dynamics in T cells in different contexts. Because PD1+ exhausted T cells in chronic viral infection show reduced motility and associated reduced ERK activity (Zinselmeyer et al., 2013), it will be interesting in the future to investigate whether enhancing Drp1 functionality may restore TEX motility downstream of PD-1 and ERK de-regulation. Further, the phosphorylation-driven impairment in myosin activation we observed in KO T cells has been previously associated with the requirement of mitochondrion-derived ATP locally produced at the uropod (Campello et al., 2006). Interestingly, defective migration is observed in KO T cells even though they show a shift toward an OXPHOS-based metabolism, which should, in principle, drive a higher migration rate, given the higher competence to produce mitochondrion-derived ATP. This apparent paradox further highlights the importance of a fine-tuning modulation of mitochondria distribution to drive localized production of mitochondria-derived ATP rather than that of the general mitochondria functionality. Moreover, in the absence of Drp1, cells are even unable to transmigrate. Drp1-deficient T cells lacking mitochondria at the uropod do not promote correct activation of the motor myosin, crucial for diapedesis (Jacobelli et al., 2013), affecting the capacity of these cells to join secondary lymphoid organs and to infiltrate any specific inflamed target site, such as a tumor lesion. It is thus not surprising that the phenotype we observe in our model closely resembles that observed in myosin-deficient mice (Jacobelli et al., 2013). Also, the transmigration defects are nicely highlighted in the tumor IHC pictures, where Drp1-deficient T cells are fewer, and the few present ones are intriguingly retained in the capillaries or in their strict proximity.
Taken together, our data can comprehensively explain our main observation that mice lacking Drp1 in T cells were not able to mount a correct immune response to tumor development under conditions requiring very rapid and optimal SLEC infiltration (Ebert et al., 2016). Moreover, such a TM-like shift driven by Drp1 deficiency was also associated in vivo with increased levels of exhausted T cells, which preferentially originate from memory rather than TE cells (Angelosanto et al., 2012), further impairing immune-surveillance in a tumor mouse model where an optimal TE cell response is required (Ebert et al., 2016).
In conclusion, our findings show that the absence of a single protein, Drp1, in the T cell lineage determines defective proliferation and migration during T cell thymic development. Consequently, mice have a reduced number of mature circulating T cells that inherited the proliferative and migratory defects from their progenitors and show defective production of TE progeny, too. Thus, these cells recirculate less in secondary lymphoid organs, proliferate less, and, eventually, do not reach target tissues, where they would exploit their full defensive functions.
We can thus assign to Drp1 a crucial role in correct T cell development and in the essential regulation of lymphocyte immune-surveillance.
STAR★Methods
Key Resources Table
| REAGENT or RESOURCE | SOURCE | IDENTIFIER |
|---|---|---|
| Antibodies | ||
| anti-mouse CD28 | Biolegend | Cat# 102102; RRID: AB_312867 |
| anti-mouse TCRb | Biolegend | Cat# 109202; RRID: AB_313425 |
| anti-mouse CD2 | Biolegend | Cat# 100102; RRID: AB_312649 |
| anti-mouse CD3e | Biolegend | Cat# 100302; RRID: AB_312667 |
| anti-mouse IL4 | Biolegend | Cat# 504102; RRID: AB_315316 |
| anti-mouse IL12 | Biolegend | Cat# 505303; RRID: AB_315375 |
| anti-mouse IFNγ | Biolegend | Cat# 505702; RRID: AB_315390 |
| anti-CD107a-PE | Biolegend | Cat# 121620; RRID: AB_2562147 |
| anti-mouse CD4-PECy7 | Biolegend | Cat# 100422; RRID: AB_312707 |
| anti-mouse CD4-APC | Biolegend | Cat# 100424; RRID: AB_389324 |
| anti-mouse CD8-Alexa Fluor 488 | Biolegend | Cat# 100723; RRID: AB_389304 |
| anti-mouse CD25-PE | Biolegend | Cat# 102008; RRID: AB_312857 |
| anti-mouse/human CD44-APC | eBioscience | Cat# 17-0441-82; RRID: AB_469390 |
| anti-mouse CXCR5-PE | eBioscience | Cat# 12-7185-82; RRID: AB_11217882 |
| anti-mouse PD-1-PECy7 | eBioscience | Cat# 25-9985-82; RRID: AB_10853805 |
| anti-mouse CD69-PECy7 | Biolegend | Cat# 104512; RRID: AB_493564 |
| anti-mouse CD62L-PE | Biolegend | Cat# 104408; RRID: AB_313095 |
| anti-mouse CXCR4-APC | eBioscience | Cat# 17-9991-82; RRID: AB_10670878 |
| anti-mouse CCR7-PECy7 | eBioscience | Cat# 25-1971-82; RRID: AB_469652 |
| anti-mouse TCRγδ-Alexa Fluor 488 | Biolegend | Cat# 118128; RRID: AB_2562771 |
| anti-mouse CD45-PE | Biolegend | Cat# 103105; RRID: AB_312970 |
| anti-mouse S1p-R1-eFluor660 | eBioscience | Cat# 50-3639-42; RRID: AB_2574208 |
| anti-mouse ICAM1-PE | eBioscience | Cat# 12-0542-81; RRID: AB_529542 |
| anti-mouse IL7Rα-Alexa Fluor 488 | Biolegend | Cat# 135018; RRID: AB_1937205 |
| anti-mouse KLRG1-APC | eBioscience | Cat# 17-5893-82; RRID: AB_469469 |
| anti-mouse CD38-FITC | eBioscience | Cat# 11-0381-82; RRID: AB_465024 |
| anti-mouse B220-APC | Biolegend | Cat# 103226; RRID: AB_389330 |
| anti-mouse F4/80-APC | Biolegend | Cat# 123116; RRID: AB_893481 |
| anti-mouse IFNγ-PE | eBioscience | Cat# 12-7311-82; RRID: AB_466193 |
| anti-mouse TNFα-APC | Biolegend | Cat# 506307; RRID: AB_315428 |
| anti-mouse IL2-A488 | Biolegend | Cat# 503813; RRID: AB_493515 |
| anti-mouse cd11c | Biolegend | Cat# 117311; RRID: AB_389306 |
| anti-mouse cd11b PECy7 | Biolegend | Cat# 101215; RRID: AB_312798 |
| anti-mouse MHC I-A/I-E APC | Biolegend | Cat# 107613; RRID: AB_313328 |
| anti-mouse NK1.1 APC | Biolegend | Cat# 108709; RRID: AB_313396 |
| anti-mouse CD49b PE | Biolegend | Cat# 108907; RRID: AB_313414 |
| anti-mouse CX3CR1-FITC | Biolegend | Cat# 149020; RRID: AB_2565703 |
| anti-mouse granzymeB | Biolegend | Cat# 515403; RRID: AB_2114575 |
| anti-mouse H2AX-pSer139 A647 | BD Bioscience | Cat# 560447; RRID: AB_1645414 |
| anti-mouse Tbet-PE | eBioscience | Cat# 12-5825-82; RRID: AB_925761 |
| anti-mouse Eomes-PECy7 | eBioscience | Cat# 25-4875-82; RRID: AB_2573454 |
| anti-mouse Foxp3-Alexa Fluor 488 | eBioscience | Cat# 53-5773-82; RRID: AB_763537 |
| anti-mouse CD8 BV785 | Biolegend | Cat# 100750; RRID: AB_2562610 |
| anti-mouse CD44 BV510 | Biolegend | Cat# 103043; RRID: AB_2561391 |
| anti-mouse IFNγ BV711 | Biolegend | Cat# 505835; RRID: AB_11219588 |
| anti-mouse Tbet BV421 | BD Bioscience | Cat# 563318; RRID: AB_2687543 |
| anti-mouse TOM20 | Santa Cruz | Cat# sc-11415; RRID: AB_2207533 |
| anti-mouse tubulin-alpha | Biolegend | Cat# 627902; RRID: AB_439761 |
| anti-mouse tubulin-gamma | Thermo Fisher | Cat# MA1-19421; RRID: AB_1075282 |
| anti-ICAM1 purified | Biolegend | Cat# 116102; RRID: AB_313693 |
| anti-mouse CD4 purified | Biolegend | Cat# 100402; RRID: AB_312687 |
| anti-mouse CD8 purified | Biolegend | Cat# 100702; RRID: AB_312741 |
| anti-mouse B220 A647 | Biolegend | Cat# 103226; RRID: AB_389330 |
| anti-mouse ATPb | Abcam | Cat# ab14730; RRID: AB_301438 |
| anti-mouse pMLC2 | Cell Signaling | Cat# 3671S; RRID: AB_330248 |
| anti-mouse Drp1 | BD PharMingen | Cat# 611113; RRID: AB_398424 |
| anti-mouse keratin5 | Abcam | Cat# ab53121; RRID: AB_869889 |
| anti-mouse pSer616-Drp1 | Cell Signaling | Cat# 4494S; RRID: N/A |
| anti-mouse Opa1 | BD PharMingen | Cat# 612607; RRID: AB_399889 |
| anti-mouse Mfn1 | Santa Cruz | Cat# sc-50330; RRID: AB_2250540 |
| anti-mouse Mfn2 | Abcam | Cat# ab56889; RRID: AB_2142629 |
| anti-mouse Fis1 | Abcam | Cat# ab71498; RRID: AB_1271360 |
| anti-mouse Mff | Abcam | Cat# ab129075; RRID: AB_11155454 |
| anti-mouse MiD51 | Abcam | Cat# ab89944; RRID: AB_2041224 |
| anti-mouse MnSOD | Enzo Life Science | Cat# ADI-SOD-110; RRID: AB_10616816 |
| anti-mouse actin | Millipore | Cat# MAB1501; RRID: AB_2223041 |
| anti-mouse CD8a (4SM15) | eBioscience | Cat# 14-0808-82; RRID: AB_2572861 |
| anti-Drp1 pSer616 | Cell Signaling | Cat# 3455; RRID: AB_2085352 |
| anti-mTOR | Cell Signaling | Cat# 2983; RRID: AB_2105622 |
| anti-pmTOR-S2481 | Cell Signaling | Cat# 2974; RRID: AB_2262884 |
| anti-pAMPKα-T172 | Cell Signaling | Cat# 2535; RRID: AB_331250 |
| anti-AMPKα | Cell Signaling | Cat# 2532; RRID: AB_330331 |
| anti-cMyc | Cell Signaling | Cat# 13987; RRID: AB_2631168 |
| anti-pS6RP-S240/244 | Cell Signaling | Cat# 5364; RRID: AB_10694233 |
| anti-ERK1/2 | Cell Signaling | Cat# 4695; RRID: AB_390779 |
| anti-pERK1/2-T202T204 | Cell Signaling | Cat# 4377; RRID: AB_331775 |
| anti-mouse CD4 (4SM95) | eBioscience | Cat# 14-9766-80; RRID: AB_2573007 |
| goat anti-Rat IgG (H+L) Secondary Antibody, HRP conjugate | Novex by Life Technologies | Cat# A24555; RRID: AB_2536023 |
| Chemicals, Peptides, and Recombinant Proteins | ||
| Phytohemagglutinin (PHA) | Calbiochem Millipore | M5030 |
| mouse IL2 | R&D System | 402-ML-020 |
| etoposide | Sigma Aldrich | E1383-25MG |
| mouse IL12 | R&D System | 419-ML-010 |
| RAD-001 | Novartis Oncology | N/A |
| FR180204 | Tocris | 3706 |
| AICAR | Sigma | A9978 |
| EDTA | Sigma | E6758 |
| BAPTA | Sigma | A1076 |
| Compound C (Dorsomorphin) | Sigma | P5499 |
| Fluo3-AM | Thermo Fisher | F1241 |
| Fx Cycle Red | Thermo Fisher | F10348 |
| Mitotracker Green | Thermo Fisher | M7514 |
| 2-NBDG | Thermo Fisher | N13195 |
| Recombinant human TNFα | R&D System | 210-TA |
| 2-Deoxyglucose | Sigma | D6134 |
| FCCP | Sigma | C2920 |
| Rotenone | Sigma | R8875 |
| Antimycin | Sigma | A8674 |
| XF Palmitate-BSA FAO substrate | Agilent | 102720-100 |
| etomoxir | Sigma | E1905 |
| Sulfate Latex 4% w/v 5um Beads | Molecular Probes | S37227 |
| monensin | BD PharMingen | 00-4505-51 |
| nocodazole | Sigma Aldrich | M1404-2MG |
| CFSE | eBioscience | 65-0850-50 |
| Cell-Tracker Orange CMTMR Dye | Thermo Fisher | C2927 |
| Cell Viability Dye eFluo670 | eBioscience | 65-0840-50 |
| Bovine Serum Albumin | Sigma Aldrich | A6003-100G |
| CXCL12 | R&D System | 460-SD-010/CF |
| CCL19 | R&D System | 440-M3-025/CF |
| CCL21 | R&D System | 457-6C-025/CF |
| Spinghosine-1-phosphate | Tocris | 1370 |
| mdivi-1 | Sigma Aldrich | M1099-25MG |
| oligomycin | Sigma Aldrich | 75351-5MG |
| formaldehyde 4% | Carlo Erba Reagent | 415661 |
| Triton X-100 | Sigma Aldrich | X100-500ML |
| Sucrose | Sigma Aldrich | S0389-500G |
| OCT compound | Sakura | 4583 |
| poly-L-lysine | Sigma Aldrich | P1274-100MG |
| Gelatin | Biorad | #170-6537 |
| Human Fibronectin | Sigma Aldrich | F2006-1MG |
| PMA | Sigma Aldrich | 79346-5MG |
| Ionomycin | Sigma Aldrich | I3909-1ML |
| Go-Taq G2-Flexi DNA Polymerase 2500u | Promega | M7806 |
| Halt Protease Inhibitor Cocktail | Thermo Fisher | 78425 |
| NuPage LDS Sample Buffer | Invitrogen | NP0008 |
| Tween 20 | Sigma Aldrich | P1379-100ML |
| Medium200 | Thermo Fisher | M200500 |
| Low Serum Growth Supplement | Thermo Fisher | S-003-10 |
| Percoll | GE Healthcare | 17089101 |
| H-2Kb/KSPWFTTL Dextramer | Immudex | JD3702-APC |
| Fixable Viability Dye eFluor780 | eBioscience | 65-0865-18 |
| Xylene for histology and citology | DIAPATH | X0053 |
| Epitope Retrieval Solution pH 9 (x10 Concentrate) | Leica Biosystems | RE7119-CE |
| Novocastra Reagent NovoPen | Leica Biosystems | NCL-PEN |
| Novolink Polymer Detection Kit | Leica Biosystems | RE7280-CE |
| AEC Substrate-Chromogen, Ready-to-Use | DAKO | K3464 |
| Ultramount Acqueous Permanent Mounting Medium | DAKO | S196430-2 |
| Harris’s Hematoxylin for histology | DIAPATH | c0283 |
| Eosin G or Y acqueous solution 1% | DIAPATH | c0363 |
| Bradford Protein Assay | BioRad | 5000002 |
| Lipopolysaccharide | Sigma | L4005 |
| Amersham ECL Detection Reagent | GE Healthcare | RPN2106 |
| Critical Commercial Assays | ||
| Click-iT EdU AlexaFluor-488 Flow Cytometry Assay Kit | Thermo Fisher | C10633 |
| CD4+ T Cell Isolation kit, mouse | Miltenyi | 130-104-454 |
| CD8+ T Cell Isolation kit, mouse | Miltenyi | 130-104-075 |
| Pan T Cell isolation kit II, mouse | Miltenyi | 130-095-130 |
| Naive CD4+ T Cell Isolation kit, mouse | Miltenyi | 130-104-453 |
| Foxp3 Staining Buffer Set | eBioscience | 00-5523-00 |
| AnnexinV-FITC Apoptosis Detection kit | eBioscience | BMS500FI/300CE |
| ATP assay kit | Abcam | ab83355 |
| DCFDA Cellular ROS Detection Assay kit | Abcam | ab113851 |
| Mitochondrial Membrane Potential Assay Kit | Abcam | ab113852 |
| ApopTag Red in situ Apoptosis Detection Kit | Merck Millipore | S7165 |
| Deposited Data | ||
| RNA sequencing data at Gene Expression Omnibus | This paper | GSE112143 |
| Experimental Models: Cell Lines | ||
| HUVEC cell line | Thermo Fisher | C0035C |
| MC38 cell line | Chiodoni et al., 1999 | http://jem.rupress.org/content/190/1/125.long |
| Experimental Models: Organisms/Strains | ||
| c57BL6/J Drp1 floxed mice | Ishihara et al., 2009 | N/A |
| c57BL6/J Lck::Cre transgenic mice | The Jackson Laboratory | Cat #003802 |
| c57BL6/J ROSA26::mtYFP mice | Sterky et al., 2011 | N/A |
| Oligonucleotides | ||
| Lck:cre forward primer | This paper | N/A |
| 5′-cggtcgatgcaacgagtgatgagg-3′ | ||
| Lck:cre reverse primer | This paper | N/A |
| 5′-ccagagacggaaatccatcgctcg-3′ | ||
| Drp1 floxed allele primer #42 | Ishihara et al., 2009 | N/A |
| 5′-cagctgcactggcttcatgactc-3′ | ||
| Drp1 floxed allele primer #43 | Ishihara et al., 2009 | N/A |
| 5′-gtcaacttgccataaaccagag-3′ | ||
| Drp1 floxed allele primer #39 | Ishihara et al., 2009 | N/A |
| 5′-tgccaagaatgattacagtcagg-3′ | ||
| ROSA-26 R1 allele primer (for mtYFP genotyping) | Sterky et al., 2011 | N/A |
| 5′-AAAGTCGCTCTGAGTTGTTAT-3′ | ||
| ROSA-26 R2 allele primer (for mtYFP genotyping) | Sterky et al., 2011 | N/A |
| 5′-GCGAAGAGTTTGTCCTCAACC-3′ | ||
| ROSA-26 R3 allele primer (for mtYFP genotyping) | Sterky et al., 2011 | N/A |
| 5′-GGAGCGGGAGAAATGGATATG-3′ | ||
| Generation of pEYFP-C1-Drp1S616E plasmid: | This paper | N/A |
| Fw: 5′-ATTCCAATTATGCCAGCCGAGCCACAA AAAGGTC ATGCCGTgaacctgctagatgtgccag-3′ | ||
| Generation of pEYFP-C1-Drp1S616E plasmid: | This paper |
N/A |
| Rv: 5′-ACGGCATGACCTTTTTGTGGCTCGGC TGGCATA ATTGGAATgggttttgatttttcttctg-3′ | ||
| Recombinant DNA | ||
| pEYFP-C1 | This paper | N/A |
| pEYFP-C1-Drp1S616E | This paper | N/A |
| pEYFP-C1-Drp1 | Addgene | #45160 |
| Software and Algorithms | ||
| ImageJ Mito-Morphology Macro | Dagda et al., 2009 | http://imagejdocu.tudor.lu/doku.php?id=plugin:morphology:mitochondrial_morphology_macro_plug-in:start |
| Volocity 6.3 software | Perkin-Elmer | http://www.perkinelmer.com/lab-products-and-services/resources/cellular-imaging-software-downloads.html |
| Graphpad Prisme 6 | Graphpad Software | https://www.graphpad.com/scientific-software/prism/ |
| Sigma Plot v.12 | Systat Software | http://www.sigmaplot.co.uk/index.php |
| FlowJo v. 10.1r5 | FlowJo, LLC | https://www.flowjo.com/ |
| Other | ||
| Ultraview VoX 3D Live Cell Imaging System Microscope | Perkin Elmer | L7267000 |
| Glass Bottom Culture Dishes plates | Mak-Tek | P35G-1.5-10-C |
| Cryostat | Leica | CM1850UV |
| 10well 6.7mm Diagnostic Microscope Slides | Thermo Fisher | ER-308B-CE24 |
| Superfrost slides Plus | Thermo Fisher | 4951PLUS4 |
| Automated Vacuum Tissue Processor | Leica Biosystems | 14049543267 |
| Heated Paraffin Embedding Module | Leica Biosystems | 14038881107RevG |
| Paraffin Bio Plast Plus | Bio Optica | ago-20 |
| Sliding MicrotomeSM2010R | Leica Biosystems | 1492010RDSN |
| Water bath with slide dryer thermostatic WB1770 | Bio Optica | 40-300-000 |
| Low-profile disposable blades 819 | Leica Biosystems | 14035838382 |
| Superfrost Plus Menzel-Gläsermicroscope slides | DIAPATH | 060SFP |
| Microscope slides/ Ground edges/Frosted end | DIAPATH | 0610MS |
| BD Accuri C6 Flow Cytometer | Becton Dickinson | https://www.bdbiosciences.com/instruments/accuri/ |
| LSR Fortessa Flow Cytometer | Becton Dickinson | http://www.bdbiosciences.com/in/instruments/lsr/index.jsp |
| 3 μm-pore size transwell filters 24well | Corning Costar | Cat #3452 |
| 8 μm-pore size transwell filters 24well | Corning Costar | Cat #3464 |
| Zeiss Axioscope A1 | Zeiss | https://www.zeiss.com/microscopy/int/products/light-microscopes/axio-scope-a1-for-biology.html |
| Volocity 6.5 Software | ZeQuorum Technologies | http://quorumtechnologies.com/index.php/2014-06-19-13-10-00/2014-06-19-13-14-30/image-analysis/2-uncategorised/110-volocity-downloads |
| Neon Transfection System | Thermo Fisher | MPK5000 |
| XFe-96 Extracellular Flux Analyzer | Agilent | https://www.agilent.com/en/products/cell-analysis/seahorse-analyzers/seahorse-xfe96-analyzer |
Contact for Reagent and Resource Sharing
Further information and requests for resources and reagents should be directed to and will be fulfilled by the Lead Contact, Silvia Campello (silvia.campello@uniroma2.it).
Experimental Model and Subject Details
Mouse Models
C57BL/6 Lck:Cre transgenic mice purchased from Jackson Laboratory were crossed with C57BL/6 Drp1 floxed mice (Ishihara et al., 2009), kind gift from Prof. Luca Scorrano (Venetian Institute of Molecular Medicine), to generate KO Drp1 fl/fl Lck:Cre mice (indicated as fl/fl cre+ in the Fig.s) and control Drp1 +/+ Lck:Cre mice (+/+ cre+). ROSA26:mtYFP fl/fl mice (Sterky et al., 2011) have been crossed to Drp1 floxed and Lck:cre mice to obtain mice with mtYFP-expressing T cells. All mice were bred and maintained under conventional conditions at Plaisant (Castel Romano) and IRCCS Fondazione Santa Lucia Animal Facilities. They were kept in cages of no more than 5-6 mice each, divided by sex, under 12h/12h light/dark cycle, with standard temperature, humidity and pressure conditions according to FELASA guidelines. Small red squared mice house and paper were used for cage enrichment. From breeding until weaning a specific food (richer in fat and protein than the standard one used for maintenance) were used in all cages. Mice health were monitored daily by veterinary staff and health analysis for pathogens were performed every three months according to FELASA guidelines. Weaning was performed not earlier than 28 post-natal days. For all the experiments, mice were sacrificed by neck dislocation at 2-3 months of age. Male mice have been used for tumor experiments, while all other analyses were performed independently of sex. Blood has been collected from heart ventricles by syringe needle or from submandibular plexus. For thymus area measurements, the following formula has been used: major axis∗minor axis∗pi-greek (approximated elliptical surface). Spleen area has been quantified as a rectangular surface: major axis∗minor axis. The mice protocols have been approved by the IRCCS Fondazione Santa Lucia and the Plaisant Ethical Committees as well as by the Italian Ministry of Health (Authorization # 459/2015-PR). They have been written following both the ARRIVE Guidelines, and the numeric details have been chosen following the criteria described in The National Centre for the Replacement, Refinement and Reduction of Animals in Research (NC3Rs) (https://www.nc3rs.org.uk/).
Primary Cells
Murine thymocytes and murine T cells have been cultivated in RPMI 1640 medium (GIBCO) supplemented with 10% Fetal Bovine Serum (GIBCO), 2mM L-glutamine, 100U/ml penicillin/streptomycin, 1x GIBCO MEM Non-essential amino-acids, 1mM Sodium piruvate, 100μg/ml Gentamycin and 55μM beta-mercaptoethanol (Thermo Fisher).
Cell lines
MC38 tumor cells have been cultured in complete DMEM medium (GIBCO) supplemented with 10% Fetal Bovine Serum (GIBCO), 2mM L-glutamine, 100U/ml penicillin/streptomycin, 1x GIBCO MEM Non-essential amino-acids,1mM Sodium pyruvate and 55μM beta-mercaptoethanol (Thermo Fisher).
HUVEC cells (Thermo Fisher) have been cultured in Medium 200 (Thermo Fisher) supplemented with Low Growth Serum Supplement (Thermo Fisher),
Method Details
Cell culture and drug treatments
Thymocytes have been isolated using 70μm Corning Cell Strainers and cultured in RPMI medium. For proliferation experiments, 5x 10⁶ thymocytes have been activated in vitro for up to 4 days in 48well plate with 1mg/ml PHA (Calbiochem) and 10ng/ml mouse IL2 (R&D System). 10μM EdU 2 hours pulse has been given to the cells to stain the proliferating ones. 10μM nocodazole (Sigma-Aldrich) o.n. treatment has been performed to synchronize in vitro 3-days activated thymocytes in G2-M phase after pre-treatment with 1μM CFSE (eBioscience) for 15min at 37°C. Then, to visualize dividing cells (halving of CFSE fluorescence), cells have been washed twice and resuspended in RPMI complete medium with 1mg/ml PHA and 20ng/ml mouse IL-2. Thymocyte apoptosis has been induced in 96well plate stimulating 5x 10⁵ thymocytes with 50μM etoposide (Sigma) or using o.n. plate-coated 96well plate with 10μg/ml anti-TCRb, 10μg/ml anti-CD28 and 50μg/ml anti-CD2 (Biolegend) antibodies as described (Punt et al., 1994).
Mature CD4+ and CD8+ T cells have been isolated from spleen or LNs by magnetic sorting, using the mouse CD4+ or CD8+ T cell Isolation Kit (Miltenyi) and then cultured in RPMI medium as described for thymocytes. For in vitro activation, 2x 10⁵ CD4+ or CD8+ T cells have been stimulated with 5μg/ml anti-CD3 (plate-coated) (Biolegend), 1μg/ml anti-CD28 (Biolegend) and 20ng/ml mouse IL-2 (R&D System) for 2 days. Then the cells have been cultured for additional 3 or 4 days in presence of mIL2 only. For evaluation of IFNγ, TNFα, IL2, Tbet and Eomes expression, 20ng/ml mouse IL12 (R&D System) and 10μg/ml anti-mouse-IL4 antibody (Biolegend) have been added to the cells all the days (th1 or tc1 polarizing conditions). For evaluation of IL4 in CD4+ T, 100ng/ml mouse IL4 (R&D System) and 10μg/ml anti-mouse-IL12 and anti-mouse IFNγ antibodies (Biolegend) have been added to the cells all the days (th2 polarizing conditions). To inhibit mTOR and ERK signaling, activated T cells have been incubated with 10nM RAD-001 (Novartis Oncology) or 33μM FR180204 (R&D System) respectively for 48 hours. Wild-type T cells have been also treated with 1μg/ml ionomycin 1h or with 2mM AICAR (Sigma-Aldrich) for 5h (in presence of aCD3/CD28/IL2). Activated T cells have been also incubated with 10μM BAPTA-AM (Sigma) and 10mM EDTA (Sigma) or with Compound-C (Sigma) at 2 μM. Calcium uptake has been analyzed by pre-incubating isolated T cells with 2.5nM Fluo3-AM for 30min at 37°C and then stimulating the cells with rat aCD3 antibody (eBioscience) on ice for 30min. Fluo3-AM baseline fluorescence has been measured by flow cytometry and then secondary anti-rat antibody have been added immediately to the cells. Fluo3-AM fluorescence have been then acquired for up to 6min. Maximum (at 2min) and residual (at 6min) calcium uptake has been calculated as the ratio of Fluo3-AM fluorescence between indicated point (maximum or residual) and baseline value. To study mitochondrial accumulation at immunological synapse (IS), CD4+ and CD8+ T cells have been mixed 1:1 ratio for 2h at 37°C with 25μg/ml anti-CD3 antibody (Biolegend) coated latex sulfate 5μm beads (Molecular Probes) in presence of 1μg/ml anti-CD28 (Biolegend) and 20ng/ml mouse IL-2 and then fixed and processed for immunostaining. For the analysis of intracellular cytokine production (IFNγ, TNFα, IL2), activated T cells have been restimulated with 5μg/ml anti-CD3 (plate-coated), 1μg/ml anti-CD28 and 20ng/ml mouse IL2 for 6h (2mM monensin (BD PharMingen) added for the last 3 hours). T cell cytotoxicity has been evaluated 6 days after initial activation by stimulating the cells for 4 hours with 5μg/ml anti-CD3 (plate-coated) and 1μg/ml anti-CD28 antibodies in 96well plate or at 1:1 ratio with 25μg/ml anti-CD3 antibody- and 100μg/ml anti-CD28 antibody-coated beads (then fixed for immunostaining). For detection of T cell degranulation, 1:200 anti-CD107a (LAMP1, eBioscience) antibody and 2mM monensin have been added for the entire assay. 10μM nocodazole (Sigma-Aldrich) o.n. treatment has been performed to synchronize in vitro activated T cells in G2-M phase after pre-treatment with 1μM CFSE (eBioscience) for 15min at 37°C. Then, to visualize dividing cells (halving of CFSE fluorescence) cells have been washed twice and resuspended in RPMI complete medium with 20ng/ml mouse IL-2. The Click-iT EdU AlexaFluor-488 Flow Cytometry Assay Kit has been used to identify EdU+ proliferating cells by flow cytometry, after 10μM EdU pulse of 2 or 24 hours (as described in detail for each experiment) (Thermo Fisher) and FxCycle Red has been used to quantify DNA content. To investigate lymphopenia, mtYFP+ +/+ cre+ control and fl/fl cre+ Drp1 KO CD3+ T cells have been isolated from spleen and naive T cells purified with magnetic sorting (using CD44 Microbeads from Naive CD4+ T cell Isolation kit, Miltenyi). Then cells have been injected i.v. into either +/+ cre+ control and fl/fl cre+ Drp1 conditional KO recipient mice. After 10 days, cells have been collected from spleen and the percentage of exogenous cells expressing the memory marker CD44 analyzed by flow-cytometry.
Flow cytometry
Staining of membrane bound or intracellular antigens has been performed using the following fluorochrome-conjugated monoclonal antibodies: anti-CD4, anti-CD8a, anti-CD25, anti-CD62L, anti-CD69, anti-TCRγδ, anti-CD45, anti-ICAM1, anti-IL7Rα, anti-B220, anti-F4/80, anti-TNFα, anti-IL2, anti-cd11c, anti-cd11b, anti-IAIE, anti-NK1.1, anti-CD49b (Biolegend), anti-KLRG1, anti-CD38, anti-S1p-R1, anti-CXCR4, anti-CCR7, anti-CD44, anti-IFNγ, anti-Tbet, anti-Eomes, anti-CXCR5, anti-PD1, anti-CX3CR1, anti-CD107a, anti-granzymeB, anti-Foxp3 (eBioscience) and anti-H2AX-pSer139 (BD Bioscience). For extracellular staining, cells have been incubated with the indicated antibodies in Dulbecco Phosphate Buffer Saline (DPBS) with 0,5% Bovine Serum Albumin (BSA, Sigma) at RT for 20min, then washed once before flow-cytometric measurement. For intracellular staining, the cells have been fixed and permeabilized using the Foxp3 Staining Buffer Set (eBioscience). Thymocytes and mature T cells viability has been assayed by AnnexinV-FITC Apoptosis Detection kit (eBioscience). For evaluation of mitochondrial membrane potential in thymocytes, 1μM TMRE (Mitochondrial Membrane Potential Assay Kit, Abcam) has been added for 30min and then, after washing, the cells have been analyzed by flow cytometry. 20μM FCCP (Mitochondrial Membrane Potential Assay Kit, Abcam) has been added 10min before TMRE, as a positive control for membrane potential reduction. Total ATP amount has been measured by using the ATP assay kit (Abcam). ROS amounts have been quantified using the DCFDA Cellular ROS Detection Assay kit (Abcam). Mitochondrial mass has been evaluated by incubating cells with 100nM Mitotracker Green (Thermo Fisher) and then, after washing, the cells have been analyzed by flow cytometry. Glucose uptake has been evaluated by preincubating T cells for 2 hours in sterile glucose-free medium (Dulbecco BPS supplemented with 10% FBS, 2mM L-glutamine, 100U/ml penicillin/streptomycin, 1x GIBCO MEM Non-essential amino-acids, 1mM Sodium pyruvate, 100μg/ml Gentamycin and 55μM beta-mercaptoethanol). Then 2-NBDG has been added to the cells at the final concentration of 60μM. After 30min, cells have been analyzed by flow cytometry. Data were acquired on LSR Fortessa (Becton Dickinson) or BD Accuri C6 (Becton Dickson) and analyzed with FlowJo software (version 10.1r5).
Polarization and migration assay
Polarization and transwell migration assays have been performed as previously described (Campello et al., 2006). Briefly, thymocytes or 6 days in vitro activated T cells have been starved 4 hours in RPMI medium FBS-free (replaced by BSA). For the polarization assay, 1-5x 10⁵ cells have been allowed to adhere to 10μg/ml fibronectin-coated (Sigma Aldrich) microscope slides (Thermo Fisher) for 30min and then stimulated by adding 50nM of CXCL12, CCL19 or CCL21 50nM (R&D System) for 15min. When indicated, cells have been pre-treated with 50μM mdivi-1 (Sigma Aldrich), 30μM nocodazole or 1 μM oligomycin (Sigma Aldrich) one hour before chemokine addition and drugs were left during the whole assay duration. When indicated, mature T cells have been stimulated with 100nM CCL21 in presence of 33μM FR180204 for 20min (DMSO as control).
For transwell assays 5x 10⁵ thymocytes or 1x 10⁵ activated T cells have been plated on 3μm- (thymocytes) or 8μm- (T cells) pore size transwell filters and allowed to migrate for 1h in presence or not of 50nM CXCL12, 25nM CCL19, 50nM CCL21 and 100nM S1p (Tocris). For transendothelial migration, transwell 1mg/ml gelatin- (Biorad) and 10μg/ml fibronectin-coated (Sigma-Aldrich) 8μm-pore filters have been coated 5 days before the assay with 5x 10⁴ HUVEC (Thermo Fisher) grown in Medium 200 plus Low Growth Serum Supplement (Thermo Fisher), to reach a confluent monolayer.
Live imaging migration has been performed on 6 days in vitro activated T cells. 1x 10⁴ T cells loaded with 1μM CFSE or 5μM CMTMR (Thermo Fisher) were mixed at 1:1 ratio and added to gelatin- (Bio-Rad) and fibronectin- coated Glass Bottom Culture Dishes plates (MakTek) in which 5x 10⁴ HUVEC were plated 5 days before the assay, to reach a confluent monolayer. HUVEC has been pre-activated o.n. with 10ng/ml TNFα (R&D system) before the assay. Video recording has been performed using a Perkin Elmer Ultraview VoX every 30sec for up to 1 hour at 37°C with 5% CO2 in RPMI complete medium.
Immunofluorescence on cells and frozen sections
For immunofluorescence staining, cells have been fixed in 4% formaldehyde (Carlo Erba Reagents) 15min, permeabilized in Triton-X 0,3% (Sigma) 20min, blocked 1h at RT with 1% BSA (Sigma Aldrich) and immunostained with the following primary anti-mouse antibodies o.n. at 4°C: anti-TOM20 (Santa Cruz), anti-β-tubulin, anti-ICAM1 (Biolegend), anti-ATPb (Abcam), anti-pMLC2 (Cell Signaling), anti-Drp1 (BD PharMingen). All primary antibody incubations have been followed by incubation with appropriated fluorochrome-conjugated secondary antibodies 1h at RT. For γ-tubulin staining cells have been fixed with methanol 3min at −20°C and then immediately immunostained with the primary antibody o.n. at 4°C. Images were acquired using a Perkin Elmer Ultraview VoX. The mitochondrial network has been always evaluated upon 0.4μm slices z stack reconstructions. For the identification/quantification of mitochondrial morphology, the mean (area/perimeter)/circularity index of the mitochondrial network has been calculated, for each cell, by using the ImageJ Mito-Morphology macro (Dagda et al., 2009); it is indicated in the Figures as “fusion index.”
Mice thymus, LNs and salivary glands were fixed o.n. in 4% para-formaldehyde (Sigma Aldrich) followed by 2-days incubation in 30% sucrose (Sigma Aldrich). Then, they have been mixed in 50:50 sucrose:OCT (Sakura) solution 3h at RT and frozen at −80°C. Cryostat sections were obtained by using Leica CM1850UV cryostat and 100μg/ml poly-L-lysine-coated (Sigma Aldrich) Superfrost slides (Thermo Fisher). Sections were let air-dry on slides, fixed again in 4% para-formaldehyde 10min at RT, permeabilized with Triton-X 0,3% and blocked 1h with 10% FBS (GIBCO) and incubated with the following anti-mouse primary antibodies o.n. at 4°C: anti-keratin-5 (Abcam), anti-CD4, anti-CD8, anti-B220 (Biolegend). All primary antibody incubations were followed by incubation with appropriate fluorochrome-conjugated secondary antibodies 1h at RT. TUNEL assay was performed on cryostat sections before immunofluorescence by using the ApopTag Red in situ Apoptosis Detection Kit (Merck Millipore), following manufacturer instructions. Sections were then directly blocked with 10% Fetal Bovine Serum 1h at RT and incubated with primary antibodies o.n. at 4°C.
MCA38-induced subcutaneous tumors
5 × 10⁵ MCA38 cells were injected subcutaneously into the right flank of two-month old male control and Drp1 conditional KO mice. Mice were kept for up to 18 days in animal facility, and tumor growth was monitored twice per week and recorded as longest diameter × (shortest diameter)2 (in cubic millimeters). After 18 days, mice were sacrificed and tumors, spleen and inguinal DLNs were collected. Tumor tissue were mechanically dissociated over 70 μm-cell strainers, and mononuclear cells were enriched from tumor-derived cell suspensions by 40%/80% Percoll (GE Healthcare) density gradient, by collecting cells at the interface between 40% and 80% Percoll solution. T cells were extracted from LNs and spleen as previously described. After isolation, cells were restimulated 4h with 50ng/ml PMA (Sigma Aldrich), 1μg/ml ionomycin (Sigma Aldrich) and 2μM monensin (eBioscience), and then staining for surface and intracellular antigens was performed. Dead cells have been excluded using Fixable Viability Dye eFluor780 (eBioscience) staining. CD8+ T cells recognizing the H-2Kb-restricted immunodominant MCA38 epitope have been identified using H-2Kb/KSPWFTTL dextramer APC (Immudex). Mixed tumor cell lymphocyte culture (MTLC) have been established to expand CD8+ T cells from spleen of MC38-bearing mice. Briefly, 5 × 10⁶ splenocytes have been cultivated in vitro with 20ng/ml IL2, 20ng/ml IL15 and 2.5 × 10⁴ UV-irradiated MC38 cells for 10 days in 48well plates (last two days without MC38 cells). Then CD8+ T cells have been magnetically purified (Miltenyi) and re-stimulated for 6 hours with a-CD3 antibodies (plate coated) or with MC38 cells (1:10 target:effector ratio), in presence of 1:200 anti-CD107a antibody and 2mM monensin, in 48well plate to study their cytotoxicity. MC38 viability has been evaluated by AnnexinV-FITC Apoptosis Detection kit (eBioscience) and CD8+ T cell degranulation by cytofluorimetric analysis of CD107a staining.
Adoptive Cell Immunotherapy
Splenocytes from ROSA26:mtYFP fl/fl control (+/+ cre+) or Drp1 KO (fl/fl cre+) mice have been isolated and expanded in vitro 14 days in presence of IL2, IL15 and an irradiated layer of MC38 tumor cells. Medium and MC38 layer have been changed every two days. Then expanded T cells have been purified using CD3+ Pan T cell Isolation Kit (Miltenyi) and injected i.v. into wild-type mice bearing a 7days-old MC38-derived tumor. Receiving mice have been randomized into two groups with either control cells or Drp1 KO cells injection. Tumor size has been assessed three times a week and after two weeks mice have been sacrificed and TILs isolated from tumor mass for cytofluorimetric analysis.
In vivo homing
Control and Drp1 KO mature CD4+ and CD8+ cells from 2-months old mice have been activated in vitro for 6 days as previously described. Then cells have been labeled with 1μM CFSE (KO) or 5μM Cell Viability dye eFluor670 (eBioscience) (control), mixed at 1:1 ratio, and 4x 10⁶ mixed cells have been injected intravenously (i.v.) through lateral tail veins of wild-type age-matched recipient tumor-free or tumor-bearing mice (the latter subcutaneously injected with MCA38 cells 13 days before adoptive T cell transfer). After 24h, mice were sacrificed and blood, spleen, LNs and tumor were harvested. After T cell isolation from LN, spleen and tumor, the number of transferred control and Drp1 KO T cells was quantified by flow cytometry and the KO/control T cells ratio in the blood, LNs, spleen and tumor of recipient mice was determined, after correcting for the starting injected ratio. Ectopic TILs density has been evaluated also on cryostat tumor slice by manually counting control (+/+ cre+; Cell Viability Dye eFluor670+) and KO (fl/fl cre+; CFSE+) T cells after applying fluorescence masking filter by Volocity software to enhance and better detect fluorescent labeled cells.
Immunohistochemistry
The tumors were fixed in 10% neutral buffered formalin and included in paraffin. 4μm-thick tissue sections obtained from paraffin embedded tissues were deparaffinized, rehydrated and stained with H&E to define tumor histotypes. Immunohistochemistry was performed using a polymer detection method. Briefly, the antigen retrieval was performed using Novocastra Epitope Retrieval Solution pH 9 in a PT Link Dako pre-treatment module at 98°C for 30 minutes. Subsequently, the sections were brought to room temperature and washed in PBS. After neutralization of the endogenous peroxidase with 3% H2O2 and Fc blocking by a specific protein block (Novocastra UK), the samples were incubated with primary antibodies. For rat anti-mouse monoclonal CD8a (4SM15) or CD4 (4SM95) 1:100 pH9 (eBioscience) antibodies, the staining was revealed using goat anti-rat IgG (H&L) specific secondary antibody 1:500 (Novex by Life Technologies) and AEC (3-Amino-9-ethylcarbazole) substrate-chromogen. Slides were analyzed under a Zeiss Axioscope A1 and microphotographs were collected using a Zeiss Axiocam 503 Color with the Zen 2.0 Software (Zeiss). Quantitative IHC data for CD8 and CD4 marker was calculated by counting the number of CD8+ or CD4+ cells in five fields at 40X magnification.
Electroporation
6-days in vitro expanded control and Drp1 KO T cells have been electroporated with pEYFP-C1 (empty vector) or pEYFP-C1-Drp1S616E plasmids following manufacturer instructions (Neon Transfection System, Thermo Fisher). After 24 hours, cells have been used for transwell assays or have been expanded in IL2 medium for analyzing proliferation. pEYFP-C1-Drp1S616E plasmid have been generated from pEYFP-C1-Drp1 plasmid using the following primers:
-
•)
Fw primer: 5′-ATTCCAATTATGCCAGCCGAGCCACAAAAAGGTC ATGCCGTgaacctgctagatgtgccag-3′;
-
•)
Rv primer: 5′-ACGGCATGACCTTTTTGTGGCTCGGCTGGCATA ATTGGAATgggttttgatttttcttctg-3′
In vivo stimulation with LPS plus MC38 extract
MC38 tumor cell lysate has been obtained by 5 consecutive freeze-thaw (−80°C/37°C) cycles of MC38 cells. Then, lysate has been centrifuged at 15000g 15min and quantified using Bradford reagent (Bio-Rad). All procedures have been performed under sterile conditions. Mice have been injected i.p. with 50μg lipopolysaccharide (LPS) (unpulsed) or with 50μg LPS plus 30μg of MC38 lysate (pulsed). After 4 days, mice have been sacrificed and T cells isolated from spleen for cytofluorimetric analysis.
Seahorse analysis
The metabolic profile has been evaluated in 6-days in vitro activated T cells. Real-time measurements of extracellular acidification rate (ECAR) and oxygen consumption rate (OCR) were performed using an XFe-96 Extracellular Flux Analyzer (Seahorse Bioscience). Cells were plated in XFe-96 plates (Seahorse Bioscience) at the concentration of 4 × 10⁵ cells/well, 12 hours before making the assay, in complete RPMI-1640 medium. ECAR was measured in XF media in basal condition and in response to 10mM glucose, 4μM oligomycin and 100mM of 2-DG (all from Sigma Aldrich). Indices of glycolysis were calculated from ECAR profile: glycolysis (glyc) (calculated as the difference of ECAR induced by glucose and ECAR induced by 2-DG) and maximal glycolytic capacity (MGC) (calculated as the difference of ECAR induced by oligomycin and ECAR induced by 2-DG). OCR was measured in XF media (non-buffered DMEM medium, containing 10mM glucose, 2mM L-glutamine, and 1mM sodium pyruvate), under basal conditions and in response to 5μM oligomycin, 1.5μM of carbonylcyanide-4-(trifluoromethoxy)-phenylhydrazone (FCCP) and 1μM of rotenone and antimycin (all from Sigma Aldrich). Indices of mitochondrial respiration were calculated from OCR profile: basal OXPHOS (Basal OX) (calculated as the difference of basal OCR and OCR induced by rotenone+antimycin) and maximum respiratory capacity (MRC) (calculated as the difference of OCR induced by FCCP and OCR induced by rotenone+antimycin). For the analysis of FA oxidation (FAO), we used the XF Palmitate-BSA FAO substrate (Seahorse Bioscience). Briefly FAO was measured in FAO buffer containing NaCl 111mM, KCl 4.7mM, MgSO4 2.0mM, Na2HPO4 1.2mM, supplemented with 2.5mM glucose, 0.5mM carnitine and 5mM HEPES (final concentrations) with pH to 7.4. We added etomoxir (Sigma Aldrich) (40μM final) 15min prior to the XF assay being initiated (t = 0). Indices of FAO were calculated from FAO profile: basal (calculated as the ratio of basal OCR in the presence of palmitate and basal OCR in the presence of palmitate+etomoxir) and maximal (calculated as the ratio of OCR induced by FCCP in the presence of palmitate and OCR induced by FCCP the presence of palmitate+etomoxir). Experiments with the Seahorse system were done with the following assay conditions: 3min mixture; 3min wait; and 3min measurement.
RNA-sequencing
T cells have been stimulated with a-CD3 plate-coated and CD28/IL2 for 3 days and then frozen for RNA extraction and analysis. Next generation RNA-sequencing experiments, comprising samples quality control and Bioinformatics analysis, were performed by Genomix4life S.R.L. (Baronissi, Salerno, Italy). Indexed libraries were prepared from 1μg/ea purified RNA with TruSeq Stranded mRNA (Illumina) Library Prep Kit according to the manufacturer’s instructions. Libraries were quantified using the 4200 TapeStation (Agilent Technologies) and pooled such that each index-tagged sample was present in equimolar amounts, with final concentration of the pooled samples of 2nM. The pooled samples were subject to cluster generation and RNA-sequencing using an Illumina NextSeq500 (Illumina) in a 1x75 single end (mRNA-sequencing) format.
Data analysis
Bioinformatics analysis was performed by Genomix4Life srl (Baronissi (SA), Italy). The raw sequence files generated (.fastq files) underwent quality control analysis using FastQC (http://www.bioinformatics.babraham.ac.uk/projects/fastqc/) and then aligned to the mouse genome (mm10 assembly) using STAR v.2.5.2 (Dobin et al., 2013), with standard parameters. Raw counts were computed with HTSeq-count v.0.6.1 (Anders et al., 2015) and differentially expressed mRNAs were identified using DESeq2 v.1.12 (Love et al., 2014). FPKM counts were computed using Cufflinks (Trapnell et al., 2010). Gene Set Association Analysis (GSAA) (Xiong et al., 2014) of the expression data was used to assess enrichment of our selected gene lists derived from the following target lists:
-
•)
glycolysis: REACTOME_GLYCOLISYS, integrated with genes from KEGG_GLYCOLYSIS_ GLUCONEOGENESIS and Pdk1-2-3-4 (Gerriets et al., 2015) and Ldha-b (Rogatzki et al., 2015);
-
•)
for TCA cycle: KEGG_CITRATE_CYCLE_TCA_CYCLE;
-
•)
for OXPHOS: KEGG_OXIDATIVE_PHOSPHORYLATION;
-
•)
for pentose pathway: KEGG_PENTOSE_PHOSPHATE_PATHWAY;
-
•)
for FA synthesis: REACTOME_FATTY_ACYL_COA_BIOSYNTHESIS;
-
•)
for FA catabolism REACTOME_MITOCHONDRIAL_FATTY_ACID_BETA_OXIDATION integrated with genes from KEGG_FATTY_ACID_METABOLISM;
-
•)
cMyc-dependent metabolic genes, i.e., those metabolic genes which are downregulated in cMyc KO T cells upon activation, have been obtained from (Wang et al., 2011).
We used the GSAASeqSP tool, a Java based desktop application (software GSAA 2.0), according to the manufacturer’s instructions (Xiong et al., 2014). We have used the default setting choosing Signal2Noise_log2Ratio for differential expression analysis of individual genes. For each pathway, the Normalized Association Score (NAS) indicates the relative enrichment (positive value) or downregulation (negative value) in KO cells compared to controls. The corresponding adjusted p values (pval) and the False Discovery Rates (FDR) are also reported.
PCR and Western Blotting
DNA from tails and thymus of +/+ cre+ control and fl/fl cre+ Drp1 conditional KO mice has been isolated using alkaline lysis (Tris-HCl pH8 50mM - EDTA 100mM - NaCl 100mM - SDS 1%) followed by incubation into saturated salt solution and isopropanol precipitation. For PCR mixture preparation G2-Flexi Polymerase has been used (Promega). The following primers have been used for Lck:cre genotyping: Lck:cre forward (5′-cggtcgatgcaacgagtgatgagg-3′), Lck:cre reverse (5′-ccagagacggaaatccatcgctcg-3′). Primers for Drp1 alleles are described in literature (Ishihara et al., 2009).
For western Blotting, cells have been lysed in RIPA buffer 20min on ice (Tris-HCl 50mM pH8, NaCl 150mM, Nonidet-P40 1%, Sodium deoxycolate 0.5%, SDS 0.1%) supplemented with Protease Inhibitor Cocktail (Thermo Fisher) and 1μM NaVO4. Samples were then centrifuged at 4°C 20min and denatured 5min at 95°C in NuPage LDS Sample Buffer (Invitrogen) (with 5% beta-mercaptoethanol). Samples were run on 8%, 10% or 13% polyacrylamide gels and transferred on PVDF membranes (Biorad) by using Mini-Trans Blot Cell (Bio-Rad). Membranes were blocked in 3% w/v milk (Bio-Rad) plus 0.1% Tween20 (Sigma-Aldrich) and incubated with the appropriate antibodies o.n. at 4°C. The following antibodies were used: anti-Drp1 (BD PharMingen), anti-pS616-Drp1, anti-pmTOR-S2481, anti-mTOR, anti-pAMPKα-T172, anti-AMPKα, anti-cMyc, anti-pS6-S240/244, anti-ERK, anti-pERK-T202T204 (Cell Signaling), anti-Opa1 (BD PharMingen), anti-MnSOD (Enzo Life Science), anti-actin (Millipore), anti-TOM20, anti-Mfn1 (Santa Cruz), anti-Fis1, anti-Mff, anti-MiD51 and anti-Mfn2 (Abcam). All primary antibody incubations were followed by incubation with appropriated secondary HRP-conjugated antibodies (GE Healthcare) in 3% milk plus 0.1% Tween20. Detection of protein signals was performed using Amersham ECL Detection Reagent (GE Healthcare) on Amersham hyperfilms (GE Healthcare).
Quantification and Statistical Analysis
For all experiments shown, n (number of mice used) is indicated in the Fig. legends. Data are expressed as mean ± SEM from at least three independent experiments unless specified otherwise (Microsoft Office Excel, Prisme and SigmaPlot have been used for analysis). In dot density plot, mean value is shown in red. Comparison between two groups was done using homoscedastic unpaired two-tailed Student’s t test, unless data were normalized (control value set as one) in which case heteroscedastic unpaired two-tailed Student’s t test was used. One-way and two-way ANOVA have been used for multiple comparison (with post hoc Holm-Sidak’s test). P-values are indicated in the Fig.s as follows: ∗ = p < 0.05, ∗∗ = p < 0.01, ∗∗∗ = p < 0.001.
Data and Software Availability
The RNA sequencing data have been deposited in the Gene Expression Omnibus (GEO) Database under ID code GEO: GSE112143.
Acknowledgments
We thank L. Scorrano for kindly providing us with the Drp1flox/flox mice and F.R. Mariotti for technical help. We are extremely grateful to F. Cecconi for critically reading the manuscript. This work was funded by the Italian Ministry of Health (GR-2011-02351643) and AIRC IG-2017 19826 (to S.C.), European Research Council grant “menTORingTregs” 310496, Fondazione Italiana Sclerosi Multipla (FISM) grant 2016/R/18, and Telethon GGP17086 (to G.M.). C.P. was supported by Italian Ministry of Health GR-2016-02363749. V.B. was supported by AIRC IG-2014 15199 and IG-2017 19939, MIUR RF-2010-2310438, RF 2010-2318269, MIUR PRIN 2010-2011 prot. 2010LC747T_004, FISM onlus (cod. 2015/R/04), and FIRB-2011/13 RBAP10TPXK. S.P. was supported by AIRC IG-2017 19784, Istituto Pasteur Italia – Fondazione Cenci Bolognetti (grant 2014-2016), and Fondazione Roma grant for biomedical research NCDS-2013-000000345. V.B. and S.P. were supported by International Network Institut Pasteur PTR 20-16. C.T. was supported by AIRC MultiUnit-5 per Mille 12162.
Author Contributions
Conceptualization, L.S. and S.C.; Methodology, L.S.; Investigation, L.S., S.P., C.T., I.P., V.C., M.C., A.C., C.P., M.B., C.T., and M.P.; Formal Analysis and Visualization, L.S. and S.P.; Writing – Original Draft, L.S. and S.C.; Writing – Review and Editing, S.P., C.T., V.B., and G.M.; Supervision and Funding Acquisition, S.C.
Declaration of Interests
The authors declare no competing interests.
Published: December 11, 2018
Footnotes
Supplemental Information includes six figures, one table, and one video and can be found with this article online at https://doi.org/10.1016/j.celrep.2018.11.018.
Supplemental Information
References
- Anders S., Pyl P.T., Huber W. HTSeq--a Python framework to work with high-throughput sequencing data. Bioinformatics. 2015;31:166–169. doi: 10.1093/bioinformatics/btu638. [DOI] [PMC free article] [PubMed] [Google Scholar]
- Angelosanto J.M., Blackburn S.D., Crawford A., Wherry E.J. Progressive loss of memory T cell potential and commitment to exhaustion during chronic viral infection. J. Virol. 2012;86:8161–8170. doi: 10.1128/JVI.00889-12. [DOI] [PMC free article] [PubMed] [Google Scholar]
- Baixauli F., Martín-Cófreces N.B., Morlino G., Carrasco Y.R., Calabia-Linares C., Veiga E., Serrador J.M., Sánchez-Madrid F. The mitochondrial fission factor dynamin-related protein 1 modulates T-cell receptor signalling at the immune synapse. EMBO J. 2011;30:1238–1250. doi: 10.1038/emboj.2011.25. [DOI] [PMC free article] [PubMed] [Google Scholar]
- Blagih J., Coulombe F., Vincent E.E., Dupuy F., Galicia-Vázquez G., Yurchenko E., Raissi T.C., van der Windt G.J., Viollet B., Pearce E.L. The energy sensor AMPK regulates T cell metabolic adaptation and effector responses in vivo. Immunity. 2015;42:41–54. doi: 10.1016/j.immuni.2014.12.030. [DOI] [PubMed] [Google Scholar]
- Bonacchi A., Romagnani P., Romanelli R.G., Efsen E., Annunziato F., Lasagni L., Francalanci M., Serio M., Laffi G., Pinzani M. Signal transduction by the chemokine receptor CXCR3: activation of Ras/ERK, Src, and phosphatidylinositol 3-kinase/Akt controls cell migration and proliferation in human vascular pericytes. J. Biol. Chem. 2001;276:9945–9954. doi: 10.1074/jbc.M010303200. [DOI] [PubMed] [Google Scholar]
- Buck M.D., O’Sullivan D., Klein Geltink R.I., Curtis J.D., Chang C.H., Sanin D.E., Qiu J., Kretz O., Braas D., van der Windt G.J. Mitochondrial Dynamics Controls T Cell Fate through Metabolic Programming. Cell. 2016;166:63–76. doi: 10.1016/j.cell.2016.05.035. [DOI] [PMC free article] [PubMed] [Google Scholar]
- Campello S., Lacalle R.A., Bettella M., Mañes S., Scorrano L., Viola A. Orchestration of lymphocyte chemotaxis by mitochondrial dynamics. J. Exp. Med. 2006;203:2879–2886. doi: 10.1084/jem.20061877. [DOI] [PMC free article] [PubMed] [Google Scholar]
- Chang C.R., Blackstone C. Dynamic regulation of mitochondrial fission through modification of the dynamin-related protein Drp1. Ann. N Y Acad. Sci. 2010;1201:34–39. doi: 10.1111/j.1749-6632.2010.05629.x. [DOI] [PMC free article] [PubMed] [Google Scholar]
- Chiodoni C., Paglia P., Stoppacciaro A., Rodolfo M., Parenza M., Colombo M.P. Dendritic cells infiltrating tumors cotransduced with granulocyte/macrophage colony-stimulating factor (GM-CSF) and CD40 ligand genes take up and present endogenous tumor-associated antigens, and prime naive mice for a cytotoxic T lymphocyte response. J. Exp. Med. 1999;190:125–133. doi: 10.1084/jem.190.1.125. [DOI] [PMC free article] [PubMed] [Google Scholar]
- Cho B.K., Rao V.P., Ge Q., Eisen H.N., Chen J. Homeostasis-stimulated proliferation drives naive T cells to differentiate directly into memory T cells. J. Exp. Med. 2000;192:549–556. doi: 10.1084/jem.192.4.549. [DOI] [PMC free article] [PubMed] [Google Scholar]
- da Silva A.F., Mariotti F.R., Máximo V., Campello S. Mitochondria dynamism: of shape, transport and cell migration. Cell. Mol. Life Sci. 2014;71:2313–2324. doi: 10.1007/s00018-014-1557-8. [DOI] [PMC free article] [PubMed] [Google Scholar]
- Dagda R.K., Cherra S.J., 3rd, Kulich S.M., Tandon A., Park D., Chu C.T. Loss of PINK1 function promotes mitophagy through effects on oxidative stress and mitochondrial fission. J. Biol. Chem. 2009;284:13843–13855. doi: 10.1074/jbc.M808515200. [DOI] [PMC free article] [PubMed] [Google Scholar]
- Dobin A., Davis C.A., Schlesinger F., Drenkow J., Zaleski C., Jha S., Batut P., Chaisson M., Gingeras T.R. STAR: ultrafast universal RNA-seq aligner. Bioinformatics. 2013;29:15–21. doi: 10.1093/bioinformatics/bts635. [DOI] [PMC free article] [PubMed] [Google Scholar]
- Ebert P.J.R., Cheung J., Yang Y., McNamara E., Hong R., Moskalenko M., Gould S.E., Maecker H., Irving B.A., Kim J.M. MAP Kinase Inhibition Promotes T Cell and Anti-tumor Activity in Combination with PD-L1 Checkpoint Blockade. Immunity. 2016;44:609–621. doi: 10.1016/j.immuni.2016.01.024. [DOI] [PubMed] [Google Scholar]
- Ehrlich L.I., Oh D.Y., Weissman I.L., Lewis R.S. Differential contribution of chemotaxis and substrate restriction to segregation of immature and mature thymocytes. Immunity. 2009;31:986–998. doi: 10.1016/j.immuni.2009.09.020. [DOI] [PMC free article] [PubMed] [Google Scholar]
- Ferreira-da-Silva A., Valacca C., Rios E., Pópulo H., Soares P., Sobrinho-Simões M., Scorrano L., Máximo V., Campello S. Mitochondrial dynamics protein Drp1 is overexpressed in oncocytic thyroid tumors and regulates cancer cell migration. PLoS ONE. 2015;10:e0122308. doi: 10.1371/journal.pone.0122308. [DOI] [PMC free article] [PubMed] [Google Scholar]
- Fridman W.H., Galon J., Pagès F., Tartour E., Sautès-Fridman C., Kroemer G. Prognostic and predictive impact of intra- and peritumoral immune infiltrates. Cancer Res. 2011;71:5601–5605. doi: 10.1158/0008-5472.CAN-11-1316. [DOI] [PubMed] [Google Scholar]
- Galon J., Costes A., Sanchez-Cabo F., Kirilovsky A., Mlecnik B., Lagorce-Pagès C., Tosolini M., Camus M., Berger A., Wind P. Type, density, and location of immune cells within human colorectal tumors predict clinical outcome. Science. 2006;313:1960–1964. doi: 10.1126/science.1129139. [DOI] [PubMed] [Google Scholar]
- Gerlach C., Moseman E.A., Loughhead S.M., Alvarez D., Zwijnenburg A.J., Waanders L., Garg R., de la Torre J.C., von Andrian U.H. The Chemokine Receptor CX3CR1 Defines Three Antigen-Experienced CD8 T Cell Subsets with Distinct Roles in Immune Surveillance and Homeostasis. Immunity. 2016;45:1270–1284. doi: 10.1016/j.immuni.2016.10.018. [DOI] [PMC free article] [PubMed] [Google Scholar]
- Gerriets V.A., Kishton R.J., Nichols A.G., Macintyre A.N., Inoue M., Ilkayeva O., Winter P.S., Liu X., Priyadharshini B., Slawinska M.E. Metabolic programming and PDHK1 control CD4+ T cell subsets and inflammation. J. Clin. Invest. 2015;125:194–207. doi: 10.1172/JCI76012. [DOI] [PMC free article] [PubMed] [Google Scholar]
- Goldrath A.W., Bogatzki L.Y., Bevan M.J. Naive T cells transiently acquire a memory-like phenotype during homeostasis-driven proliferation. J. Exp. Med. 2000;192:557–564. doi: 10.1084/jem.192.4.557. [DOI] [PMC free article] [PubMed] [Google Scholar]
- Ishihara N., Nomura M., Jofuku A., Kato H., Suzuki S.O., Masuda K., Otera H., Nakanishi Y., Nonaka I., Goto Y. Mitochondrial fission factor Drp1 is essential for embryonic development and synapse formation in mice. Nat. Cell Biol. 2009;11:958–966. doi: 10.1038/ncb1907. [DOI] [PubMed] [Google Scholar]
- Jacobelli J., Estin Matthews M., Chen S., Krummel M.F. Activated T cell trans-endothelial migration relies on myosin-IIA contractility for squeezing the cell nucleus through endothelial cell barriers. PLoS ONE. 2013;8:e75151. doi: 10.1371/journal.pone.0075151. [DOI] [PMC free article] [PubMed] [Google Scholar]
- Kashatus J.A., Nascimento A., Myers L.J., Sher A., Byrne F.L., Hoehn K.L., Counter C.M., Kashatus D.F. Erk2 phosphorylation of Drp1 promotes mitochondrial fission and MAPK-driven tumor growth. Mol. Cell. 2015;57:537–551. doi: 10.1016/j.molcel.2015.01.002. [DOI] [PMC free article] [PubMed] [Google Scholar]
- Klein L., Kyewski B., Allen P.M., Hogquist K.A. Positive and negative selection of the T cell repertoire: what thymocytes see (and don’t see) Nat. Rev. Immunol. 2014;14:377–391. doi: 10.1038/nri3667. [DOI] [PMC free article] [PubMed] [Google Scholar]
- Lapinski P.E., King P.D. Regulation of Ras signal transduction during T cell development and activation. Am. J. Clin. Exp. Immunol. 2012;1:147–153. [PMC free article] [PubMed] [Google Scholar]
- Losón O.C., Song Z., Chen H., Chan D.C. Fis1, Mff, MiD49, and MiD51 mediate Drp1 recruitment in mitochondrial fission. Mol. Biol. Cell. 2013;24:659–667. doi: 10.1091/mbc.E12-10-0721. [DOI] [PMC free article] [PubMed] [Google Scholar]
- Love M.I., Huber W., Anders S. Moderated estimation of fold change and dispersion for RNA-seq data with DESeq2. Genome Biol. 2014;15:550. doi: 10.1186/s13059-014-0550-8. [DOI] [PMC free article] [PubMed] [Google Scholar]
- Matloubian M., Lo C.G., Cinamon G., Lesneski M.J., Xu Y., Brinkmann V., Allende M.L., Proia R.L., Cyster J.G. Lymphocyte egress from thymus and peripheral lymphoid organs is dependent on S1P receptor 1. Nature. 2004;427:355–360. doi: 10.1038/nature02284. [DOI] [PubMed] [Google Scholar]
- McIntyre R.E., Buczacki S.J., Arends M.J., Adams D.J. Mouse models of colorectal cancer as preclinical models. BioEssays. 2015;37:909–920. doi: 10.1002/bies.201500032. [DOI] [PMC free article] [PubMed] [Google Scholar]
- Muller W.A. How endothelial cells regulate transmigration of leukocytes in the inflammatory response. Am. J. Pathol. 2014;184:886–896. doi: 10.1016/j.ajpath.2013.12.033. [DOI] [PMC free article] [PubMed] [Google Scholar]
- Nitta T., Nitta S., Lei Y., Lipp M., Takahama Y. CCR7-mediated migration of developing thymocytes to the medulla is essential for negative selection to tissue-restricted antigens. Proc. Natl. Acad. Sci. USA. 2009;106:17129–17133. doi: 10.1073/pnas.0906956106. [DOI] [PMC free article] [PubMed] [Google Scholar]
- O’Sullivan D., van der Windt G.J., Huang S.C., Curtis J.D., Chang C.H., Buck M.D., Qiu J., Smith A.M., Lam W.Y., DiPlato L.M. Memory CD8(+) T cells use cell-intrinsic lipolysis to support the metabolic programming necessary for development. Immunity. 2014;41:75–88. doi: 10.1016/j.immuni.2014.06.005. [DOI] [PMC free article] [PubMed] [Google Scholar]
- Otera H., Ishihara N., Mihara K. New insights into the function and regulation of mitochondrial fission. Biochim. Biophys. Acta. 2013;1833:1256–1268. doi: 10.1016/j.bbamcr.2013.02.002. [DOI] [PubMed] [Google Scholar]
- Plotkin J., Prockop S.E., Lepique A., Petrie H.T. Critical role for CXCR4 signaling in progenitor localization and T cell differentiation in the postnatal thymus. J. Immunol. 2003;171:4521–4527. doi: 10.4049/jimmunol.171.9.4521. [DOI] [PubMed] [Google Scholar]
- Punt J.A., Osborne B.A., Takahama Y., Sharrow S.O., Singer A. Negative selection of CD4+CD8+ thymocytes by T cell receptor-induced apoptosis requires a costimulatory signal that can be provided by CD28. J. Exp. Med. 1994;179:709–713. doi: 10.1084/jem.179.2.709. [DOI] [PMC free article] [PubMed] [Google Scholar]
- Qian W., Choi S., Gibson G.A., Watkins S.C., Bakkenist C.J., Van Houten B. Mitochondrial hyperfusion induced by loss of the fission protein Drp1 causes ATM-dependent G2/M arrest and aneuploidy through DNA replication stress. J. Cell Sci. 2012;125:5745–5757. doi: 10.1242/jcs.109769. [DOI] [PMC free article] [PubMed] [Google Scholar]
- Rogatzki M.J., Ferguson B.S., Goodwin M.L., Gladden L.B. Lactate is always the end product of glycolysis. Front. Neurosci. 2015;9:22. doi: 10.3389/fnins.2015.00022. [DOI] [PMC free article] [PubMed] [Google Scholar]
- Simula L., Nazio F., Campello S. The mitochondrial dynamics in cancer and immune-surveillance. Semin. Cancer Biol. 2017;47:29–42. doi: 10.1016/j.semcancer.2017.06.007. [DOI] [PubMed] [Google Scholar]
- Sterky F.H., Lee S., Wibom R., Olson L., Larsson N.G. Impaired mitochondrial transport and Parkin-independent degeneration of respiratory chain-deficient dopamine neurons in vivo. Proc. Natl. Acad. Sci. USA. 2011;108:12937–12942. doi: 10.1073/pnas.1103295108. [DOI] [PMC free article] [PubMed] [Google Scholar]
- Sukumar M., Liu J., Ji Y., Subramanian M., Crompton J.G., Yu Z., Roychoudhuri R., Palmer D.C., Muranski P., Karoly E.D. Inhibiting glycolytic metabolism enhances CD8+ T cell memory and antitumor function. J. Clin. Invest. 2013;123:4479–4488. doi: 10.1172/JCI69589. [DOI] [PMC free article] [PubMed] [Google Scholar]
- Tamás P., Hawley S.A., Clarke R.G., Mustard K.J., Green K., Hardie D.G., Cantrell D.A. Regulation of the energy sensor AMP-activated protein kinase by antigen receptor and Ca2+ in T lymphocytes. J. Exp. Med. 2006;203:1665–1670. doi: 10.1084/jem.20052469. [DOI] [PMC free article] [PubMed] [Google Scholar]
- Tan J.L., Ravid S., Spudich J.A. Control of nonmuscle myosins by phosphorylation. Annu. Rev. Biochem. 1992;61:721–759. doi: 10.1146/annurev.bi.61.070192.003445. [DOI] [PubMed] [Google Scholar]
- Trapnell C., Williams B.A., Pertea G., Mortazavi A., Kwan G., van Baren M.J., Salzberg S.L., Wold B.J., Pachter L. Transcript assembly and quantification by RNA-Seq reveals unannotated transcripts and isoform switching during cell differentiation. Nat. Biotechnol. 2010;28:511–515. doi: 10.1038/nbt.1621. [DOI] [PMC free article] [PubMed] [Google Scholar]
- Twig G., Shirihai O.S. The interplay between mitochondrial dynamics and mitophagy. Antioxid. Redox Signal. 2011;14:1939–1951. doi: 10.1089/ars.2010.3779. [DOI] [PMC free article] [PubMed] [Google Scholar]
- Wang R., Dillon C.P., Shi L.Z., Milasta S., Carter R., Finkelstein D., McCormick L.L., Fitzgerald P., Chi H., Munger J., Green D.R. The transcription factor Myc controls metabolic reprogramming upon T lymphocyte activation. Immunity. 2011;35:871–882. doi: 10.1016/j.immuni.2011.09.021. [DOI] [PMC free article] [PubMed] [Google Scholar]
- West M.J., Stoneley M., Willis A.E. Translational induction of the c-myc oncogene via activation of the FRAP/TOR signalling pathway. Oncogene. 1998;17:769–780. doi: 10.1038/sj.onc.1201990. [DOI] [PubMed] [Google Scholar]
- Wherry E.J., Kurachi M. Molecular and cellular insights into T cell exhaustion. Nat. Rev. Immunol. 2015;15:486–499. doi: 10.1038/nri3862. [DOI] [PMC free article] [PubMed] [Google Scholar]
- Xiong Q., Mukherjee S., Furey T.S. GSAASeqSP: a toolset for gene set association analysis of RNA-Seq data. Sci. Rep. 2014;4:6347. doi: 10.1038/srep06347. [DOI] [PMC free article] [PubMed] [Google Scholar]
- Youle R.J., Karbowski M. Mitochondrial fission in apoptosis. Nat. Rev. Mol. Cell Biol. 2005;6:657–663. doi: 10.1038/nrm1697. [DOI] [PubMed] [Google Scholar]
- Zhan L., Cao H., Wang G., Lyu Y., Sun X., An J., Wu Z., Huang Q., Liu B., Xing J. Drp1-mediated mitochondrial fission promotes cell proliferation through crosstalk of p53 and NF-κB pathways in hepatocellular carcinoma. Oncotarget. 2016;7:65001–65011. doi: 10.18632/oncotarget.11339. [DOI] [PMC free article] [PubMed] [Google Scholar]
- Zhao J., Zhang J., Yu M., Xie Y., Huang Y., Wolff D.W., Abel P.W., Tu Y. Mitochondrial dynamics regulates migration and invasion of breast cancer cells. Oncogene. 2013;32:4814–4824. doi: 10.1038/onc.2012.494. [DOI] [PMC free article] [PubMed] [Google Scholar]
- Zinselmeyer B.H., Heydari S., Sacristán C., Nayak D., Cammer M., Herz J., Cheng X., Davis S.J., Dustin M.L., McGavern D.B. PD-1 promotes immune exhaustion by inducing antiviral T cell motility paralysis. J. Exp. Med. 2013;210:757–774. doi: 10.1084/jem.20121416. [DOI] [PMC free article] [PubMed] [Google Scholar]
Associated Data
This section collects any data citations, data availability statements, or supplementary materials included in this article.
Supplementary Materials
Live imaging of T cells activated in vitro for 6 days and then stained with CFSE (+/+ cre+ control cells) or CMTMR (fl/fl cre+ Drp1 KO cells), mixed at 1:1 ratio and plated upon an endothelial monolayer in humidified chamber at 37°C, 5% CO2. Bright field, green and red channel images were taken every 30 s. Automatic identification of +/+ cre+ control (CMTMR) and fl/fl cre+ Drp1 KO (green) T cells tracks by Volocity software. Position and tracks of the cells at the end of the video are reported in the Figure 5B.