Abstract
Homeobox protein Emx2 is a transcription factor that is encoded by the EMX2 gene. In this study, using data from the Cancer Genome Atlas-Thyroid Cancer (TCGA-THCA), we aimed to examine the expression profile of EMX2 and its antisense transcript EMX2OS in papillary thyroid cancer (PTC), their prognostic value and potential regulatory networks. Results showed that in the three variants of PTC, EMX2 was significantly downregulated in classical PTC, while EMX2OS were significantly downregulated in follicular and classical PTC, compared with adjacent normal tissues. Kaplan-Meier survival curves showed that EMX2 and EMX2OS expression was not related to RFS in follicular PTC. In comparison, the high EMX2 or EMX2OS group were associated with better RFS compared with their respective low expression group in classical PTC (p = 0.007 and 0.004 respectively). Correlation analysis showed that EMX2 and EMX2OS were highly co-expressed in PTC tissues (Spearman’s r = 0.83). By performing stepwise regression, we found that EMX2OS was better than EMX2 in predicting RFS in classical PTC. Multivariate analysis confirmed that high EMX2OS expression was an independent indicator of favorable RFS in classical PTC (HR: 0.239, 95%CI: 0.100 = 0.569, p = 0.001), after adjustment of pathological stages and residual tumors. By performing in silico analysis, we found that the genes co-expressed with EMX2 or EMX2OS were highly overlapped. KEGG pathway analysis showed that these genes were enriched in the ECM-receptor interaction, focal adhesion, and PI3K-Akt signaling, protein digestion and absorption and proteoglycans in cancer pathways, which are closely related to cancer initiation and progression. Based on the findings, we infer that decreased EMX2OS expression might be a valuable prognostic biomarker of unfavorable RFS in classical PTC.
Introduction
Papillary Thyroid Cancer (PTC) is the dominant form of thyroid cancer and is usually indolent in progression [1, 2]. Although the patients with PTC usually have favorable OS (10-year OS > 95%) after standard treatment, a small proportion (5–20%) of patients have an increased risk of disease recurrence and distant metastasis, which result in aggressive diseases and lethal outcomes [3]. However, PTC is a not homogeneous disease, but has several different histological variants, including classical, follicular, and tall-cell, which have varying pathological and clinical implications [4]. Therefore, the prognostic value of a biomarker might vary in different histological variants.
Homeobox protein Emx2 is a transcription factor that is encoded by the EMX2 gene. It is a critical gene modulating the formation of the central nervous system and urogenital system during embryonic development [5–7]. In the past decade, there are emerging evidence showed that EMX2 also acts as a tumor suppressor gene in multiple cancers, such as lung cancer [8, 9], gastric cancer [10] and glioma [11]. Mechanistically, EMX2 acts as a negative regulator of the Wnt signaling pathway [10, 12]. Besides, it also suppresses the Epithelial-to-Mesenchymal Transition (EMT) of some cancer cells [8]. Preserved EMX2 expression might also have potential prognostic value in terms of overall survival (OS) and recurrence-free survival (RFS) in lung adenocarcinoma [13] and lung squamous cell carcinoma [8]. One previous study found that EMX2 and its antisense transcript EMX2OS, which is a long non-coding RNA (lncRNA), display coordinate expression in normal endometrium and endometrial tumor tissues [14]. Another following study confirmed that there might be a reciprocal EMX2/EMX2OS regulatory loop that is required for sustained transcription of EMX2 [15], suggesting that EMX2OS might regulate the expression of EMX2.
In this study, using data from the Cancer Genome Atlas-Thyroid Cancer (TCGA-THCA), we examined the expression profile of EMX2 and EMX2OS in PTC, their prognostic value and potential regulatory networks.
Materials and methods
Retrospective analysis using data from TCGA
The 3rd level data of TCGA-THCA was acquired and downloaded by using the UCSC Xena browser (https://xenabrowser.net/). In TCGA-THCA, the biospecimens were examined by experienced pathologists to ensure the accuracy [16]. Follicular variant includes those tumors with 99% follicular patterned, while the tall cell variant refers to the cases with 50% or greater tall cell features [16]. Only the cases with primary tumor and without histological neoadjuvant therapy were included. The following clinicopathological data were downloaded for re-analysis, including age at initial pathologic diagnosis, gender, sample type, histological types, pathological stage, the presence of residual tumors, the history of radiation therapy, recurrence-free survival (RFS) status and RFS time (days) were obtained.
Bioinformatic analysis using cBioPortal for cancer genomics and string
The genes that were at least moderately co-expressed with EMX2OS in PTC (Spearman’s r≥0.4) were identified using cBioPortal for Cancer Genomics [17]. Then, the potential molecular interaction network among the genes and the Kyoto Encyclopedia of Genes and Genomes (KEGG) pathways in which they are involved were identified using String 10.5 (https://string-db.org/), by setting 0.4 as the minimum required interaction score.
Statistical analysis
Statistical analysis was performed by using GraphPad Prism 7.04 (GraphPad Inc., La Jolla, CA, USA) and SPSS 25.0 software package (SPSS Inc., Chicago, IL, USA). Welch’s unequal variance t-test was performed to examine the difference in EMX2/EMX2OS expression. The association between EMX2OS expression and the clinicopathological parameters in patients with classical PTC was assessed by using the Chi-squared test by two-sided Fisher’s exact test.
Kaplan-Meier curves of RFS were generated by setting the Youden Index of EMX2/EMX2OS expression in receiver operating characteristic curve (ROC) for recurrence detection as the cutoff. Log-rank test was conducted to examine the significance of the difference between the curves. Nonparametric Spearman’s correlation analysis was performed to assess the correlation between EMX2 and EMX2OS expression. Stepwise regression was conducted to assess the value of EMX2 and EMX2OS expression as predictive variables for recurrence in classical PTC. Univariate and multivariate Cox regression models were used to evaluate the prognostic significance of EMX2OS expression. p<0.05 was considered statistically significant. Data used for Cox regression analysis was provided in S1 Table.
Results
Both EMX2 and EMX2OS expression were significantly downregulated in classical PTC compared with their adjacent normal tissues
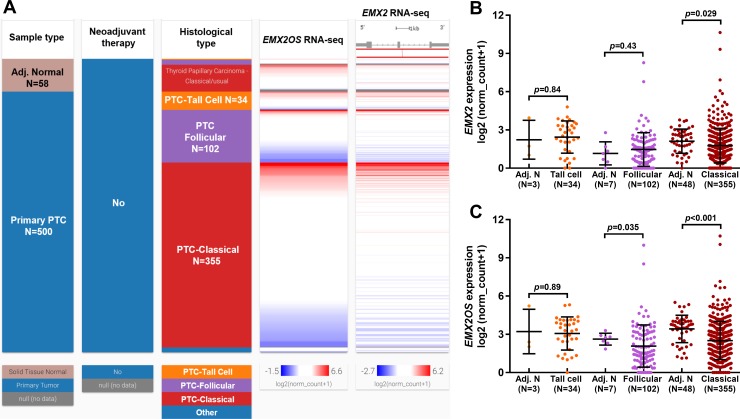
Based on the selection criteria, 500 cases of primary PTC and 58 cases of matched normal tissues were included. In the 500 primary tumor cases, there were 355 classical cases, 102 follicular cases, 34 tall cell cases and 9 cases not specified. Using the RNA-seq data of gene expression, we examined the expression of EMX2 and EMX2OS in each variant of PTC (Fig 1A). Heatmap and the following plot charts showed that compared with adjacent normal tissues, classical PTC had significantly elevated EMX2 expression (p = 0.029) (Fig 1B), while both follicular and classical PTC had significantly downregulated EMX2OS expression (p = 0.035 and p<0.001) (Fig 1C).
Fig 1. The expression profile of EMX2 and EMX2OS in each variant of PTC compared and their adjacent normal tissues.
A-C. Heatmap (A) and plots chart (B-C) showing the expression profile of EMX2 (B) and EMX2OS (C) in each variant of PTC compared and their adjacent normal tissues. The number of tumor tissues and adjacent normal tissues were as indicated.
Decreased EMX2 and EMX2OS expression was associated with unfavorable RFS in classical PTC
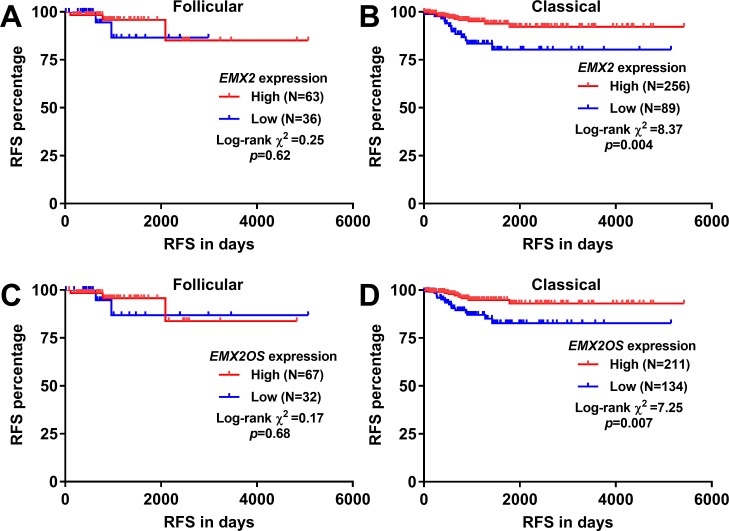
Then, we checked the association between the expression of EMX2 and EMX2OS and RFS in follicular and classical PTC respectively. By using the best cutoff of EMX2 and EMX2OS expression in ROC analysis for recurrence detection, we found that EMX2 and EMX2OS expression was not related to RFS in the follicular variant of PTC (Fig 2A and 2C). In comparison, the classical PTC patients with high EMX2 or EMX2OS expression had significantly better RFS compared with their respective low expression group (p = 0.004 and 0.007 respectively, Fig 2B and 2D).
Fig 2. Decreased EMX2 and EMX2OS expression was associated with unfavorable RFS in classical PTC, but not in follicular PTC.
A-D. Kaplan-Meier curves of RFS in follicular (A and C) and classical (B and D) PTC. Patients were grouped according to the best cutoff of EMX2 (A-B) and EMX2OS (C-D) expression in the ROC analysis for recurrence detection.
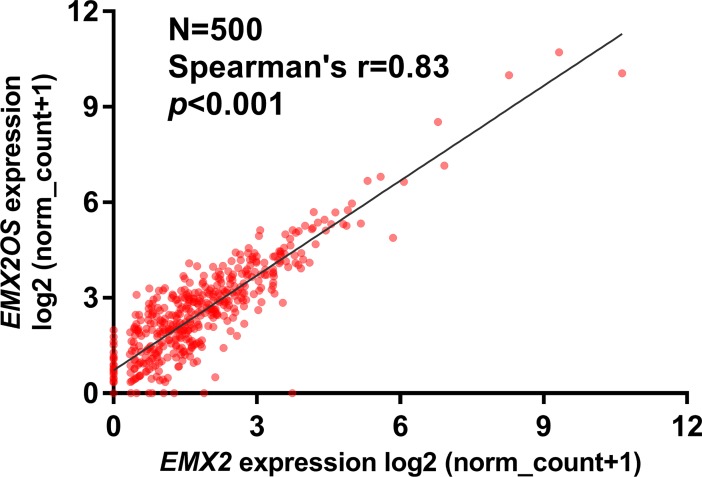
Then, we tried to explore their prognostic value in terms of RFS in classical PTC. Univariate analysis showed that advanced pathological stages, the presence of residual tumors, low EMX2 expression and low EMX2OS are risk factors of shorter RFS (Table 1). Since EMX2OS is the opposite strand of EMX2, we further analyzed their expression correlation. Results showed that these two genes were highly co-expressed in PTC cases (N = 500, Spearman’s = 0.83) (Fig 3). Therefore, these two variables should not be included simultaneously in COX regression model. By performing stepwise regression, we found that EMX2OS is better than EMX2 in predicting RFS in classical PTC (S1 Fig). Therefore, we only included EMX2OS in multivariate analysis. The clinicopathological parameters between the patients with high and low EMX2OS expression were summarized and compared in Table 2. Results showed that the high EMX2OS expression group had older age (47.89±1.13 vs. 43.83±1.34, p = 0.02) and a higher proportion of patients with pathological III/IV stage disease (36% vs. 25%, p = 0.044) and the presence of residual tumors (16% vs. 7%, p = 0.011), compared to the low EMX2OS expression group (Table 2). In multivariate analysis, we confirmed that high EMX2OS expression was an independent indicator of favorable RFS in classical PTC (HR: 0.239, 95%CI: 0.100 = 0.569, p = 0.001), after adjustment of pathological stages and residual tumors (Table 3).
Table 1. Univariate analysis of RFS in classical PTC patients.
| Parameters | Univariate analysis | |||
|---|---|---|---|---|
| p | HR | 95%CI (lower/upper) | ||
| Age (Continuous) | 0.263 | 1.013 | 0.990 | 1.037 |
| Gender | ||||
| Male (N = 94) | 1.000 | |||
| Female (N = 251) | 0.487 | 0.742 | 0.320 | 1.721 |
| Clinical stage | ||||
| I/II (N = 235) | 1.000 | |||
| III/IV (N = 110) | 0.033 | 2.348 | 1.069 | 5.155 |
| Radiotherapy | ||||
| Yes (N = 205) | 1.000 | |||
| No (N = 129) | 0.333 | 0.650 | 0.271 | 1.557 |
| Residual tumors | ||||
| No (N = 261) | 1.000 | |||
| Yes (N = 43) | 0.015 | 2.986 | 1.238 | 7.205 |
| EMX2 expression | ||||
| Low (N = 89) | 1.000 | |||
| High (N = 256) | 0.006 | 0.332 | 0.152 | 0.728 |
| EMX2OS expression | ||||
| Low (N = 134) | 1.000 | |||
| High (N = 211) | 0.010 | 0.343 | 0.151 | 0.776 |
Fig 3. Correlation analysis between the expression of EMX2 and EMX2OS.
Spearman’s correlation between the expression of EMX2 and EMX2OS in PTC cases (N = 500).
Table 2. The association between EMX2OS expression and the clinicopathological parameters in classical PTC patients.
| EMX2OS expression | p value | |||
|---|---|---|---|---|
| High (N = 211) | Low (N = 134) | |||
| Age (Mean ± SD) | 47.89±1.13 | 43.83±1.34 | 0.02 | |
| Gender | Female | 151(72%) | 100(75%) | 0.62 |
| Male | 60(28%) | 34(25%) | ||
| Pathological Stage | III/IV | 76(36%) | 34(25%) | 0.044 |
| I/II | 135(64%) | 100(75%) | ||
| Residual tumors | R0 | 151(72%) | 110(82%) | 0.011 |
| R1/R2 | 34(16%) | 9(7%) | ||
| RX/no data | 26(12%) | 15(11%) | ||
| Radiation therapy | No | 76(36%) | 53(40%) | 0.65 |
| Yes | 126(60%) | 79(59%) | ||
| No data | 9(4%) | 2(1%) | ||
| Recurrence status | No | 202(96%) | 118(88%) | 0.01 |
| Yes | 9(4%) | 16(12%) | ||
Table 3. Multivariate analysis of RFS in classical PTC patients.
| Parameters | Multivariate analysis | |||
|---|---|---|---|---|
| p | HR | 95%CI (lower/upper) | ||
| Clinical stage | ||||
| I/II (N = 235) | 1.000 | |||
| III/IV (N = 110) | 0.030 | 2.524 | 1.091 | 5.837 |
| Residual tumors | ||||
| No (N = 261) | 1.000 | |||
| Yes (N = 43) | 0.018 | 3.133 | 1.219 | 8.054 |
| EMX2OS expression | ||||
| Low (N = 134) | 1.000 | |||
| High (N = 211) | 0.001 | 0.239 | 0.100 | 0.569 |
Bioinformatic analysis of the potential regulatory network of EMX2 and EMX2OS
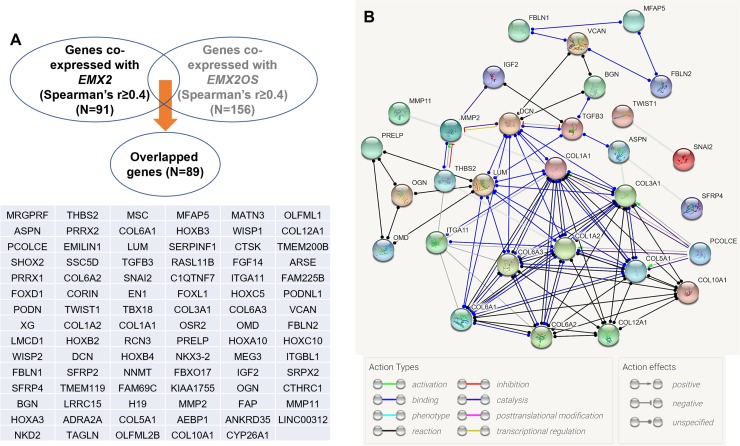
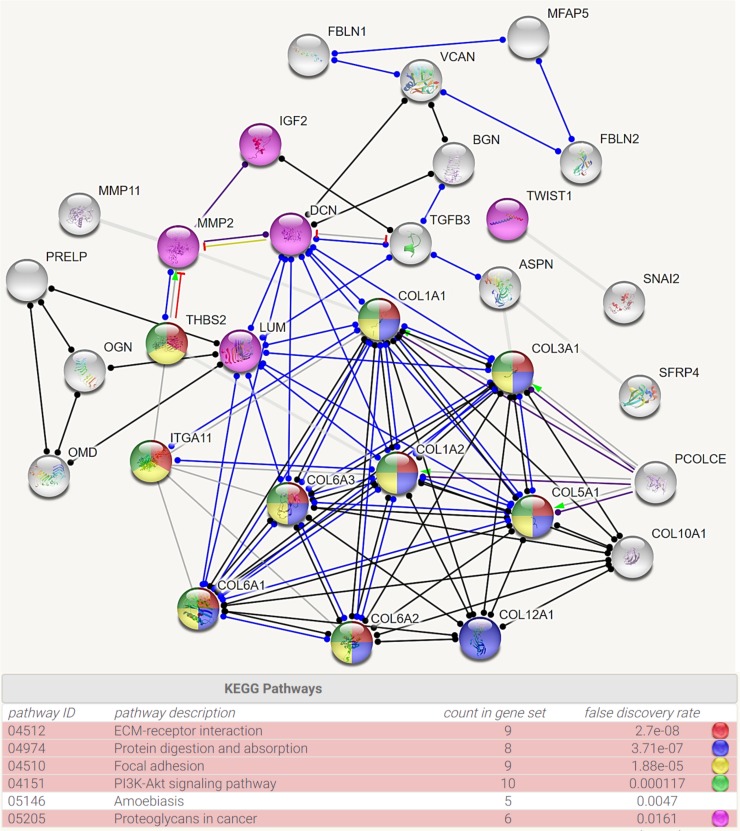
To explore the potential regulatory network of EMX2 and EMX2OS, we identified the genes that were at least moderately co-expressed with these two genes (Fig 4A). By setting Spearman’s r≥0.4 as the threshold, we found that there were 91 genes co-expressed with EMX2 and 156 genes co-expressed with EMX2OS in PTC (Fig 4A). The overlapping set included 89 genes (Fig 4A). These findings suggest that EMX2 and EMX2OS might have similar regulatory networks. Then, using STRING (version 10.5), we analyzed the potential regulatory network of the proteins encoded by these genes. Results showed that collagens (COL1A1, COL3A1, COL1A2, COL5A1, COL6A1, COL6A2, COL6A3, COL10A1, COL12A1 and PCOLCE), extracellular matrix proteins (LUM, DCN and MMP2) and cytokine TGFB3 are the key nodes in the network (Fig 4B). Then, we explored the KEGG pathway in which the genes might be enriched. Results showed that THBS2, ITGA11, COL1A1, COL3A1, COL5A1, COL6A1, COL6A2 and COL6A3 are involved in the ECM-receptor interaction, focal adhesion, and PI3K-Akt signaling pathway (Fig 5). COL1A1, COL3A1, COL5A1, COL6A1, COL6A2, COL6A3, and COL12A1 are involved in the protein digestion and absorption pathway (Fig 5). MMP2, IGF2, DCN, LUM and TWIST are involved in proteoglycans in cancer pathway (Fig 5).
Fig 4. Bioinformatic analysis of the regulatory network of EMX2 and EMX2OS co-expressed genes in PTC.
A. The overlapping gene set between EMX2 co-expressed with and EMX2OS co-expressed genes in PTC. Spearman’s r≥0.4 was set as the threshold. B. The potential regulatory network among the overlap genes. Analysis was performed using String 10.5.
Fig 5. KEGG pathways of EMX2 and EMX2OS co-expressed genes in PTC.
The enrichment of the EMX2 and EMX2OS co-expressed genes in PTC in KEGG pathways. Cancer-related pathways were colored.
Discussion
The tumor suppressor role of EMX2 has been characterized in several types of cancer. In lung cancer, EMX2 is dramatically downregulated due to its promoter methylation, which enhances cell proliferation, invasive phenotypes and canonical WNT signaling [9]. Decreased EMX2 mRNA expression is also a valuable prognostic marker of shorter OS and RFS in patients with lung adenocarcinoma [13]. Preserved EMX2 expression is significantly associated with higher chemo-sensitivity and better OS in patients with lung squamous cell carcinoma [8]. In gastric cancer, adenovirus-mediated EMX2 overexpression significantly inhibits cell proliferation and the Wnt signaling pathway both in vitro and in a gastric cancer xenograft model in vivo and prolongs the survival of tumor-bearing mice [10]. EMX2 downregulation has been considered as a critical issue in the carcinogenesis of endometrial cancer and contributes to cancer progression [18, 19].
In this study, using RNA-seq study in TCGA-THCA, we found that both EMX2 and its anti-sense transcript EMX2OS were downregulated in classical PTC compared with adjacent normal tissues. Kaplan-Meier survival curves showed that the patient group with low EMX2 or EMX2OS expression had significantly worse RFS, compared to the group with high EMX2 or EMX2OS expression. In univariate analysis, we confirmed that both high EMX2 and EMX2OS expression were associated with better RFS (HR: 0.332, 95%CI: 0.152–0.728, p = 0.006; HR: 0.343, 95%CI: 0.151–0.776, p = 0.010 respectively). Since the coordinate expression between EMX2 and EMX2OS has been reported in normal and cancerous human tissues [14], we then examined their correlation in PTC cases and confirmed that these two genes were very strongly co-expressed (Spearman’s r = 0.83). A series of previous studies demonstrated that the antisense transcript of a gene might not be transcriptional noise but may exert critical regulatory effect on the sense gene via diverse and complex mechanisms. For example, it may alter the epigenetic state of chromatin, via modulating the status of DNA methylation and/or histone modifications [20, 21]. Besides, it may also recruit transcription factors to certain regions of the sense genes, thereby modulating its transcription [22, 23]. In addition, the antisense transcript might also regulate the splicing and/or the half-life of its partner sense pre-mRNA [24, 25]. One previous study found that there might be a reciprocal EMX2/EMX2OS regulatory loop that is required for sustained transcription of EMX2 in murine cortico-cerebral precursors [15], suggesting that EMX2OS might regulate the expression of EMX2. However, the exact mechanisms of the coordinately expressed EMX2/EMX2OS in PTC cells is worthy of future studies. The results of stepwise regression showed that EMX2OS is better than EMX2 in predicting RFS in classical PTC. Multivariate analysis confirmed the independent prognostic value of EMX2OS expression in terms of RFS (HR: 0.239, 95%CI: 0.100 = 0.569, p = 0.001), after adjustment of pathological stages and residual tumors. These findings suggest that EMX2OS might serve as a valuable biomarker predicting RFS in classical PTC. One recent study found that preserved SCN4B might also be a prognostic marker of favorable RFS in classical PTC [26]. However, the authors had not explored the expression and prognostic value of SCN4B in other variants of PTC. In the current study, we found that although EMX2OS was downregulated in the follicular and classical variants, it only has prognostic value in classical variant. In addition, the prognostic of a mRNA might be discrepant with its protein expression [27–29]. The prognostic value of a lncRNA is not bothered by this phenomenon. Therefore, EMX2OS might be a specific biomarker in classical PTC.
Although the tumor suppressor role of EMX2 might help to explain the association between EMX2/EMX2OS expression and better RFS in classical PTC, the exact regulatory effect of EMX2/EMX2OS in this variant have been not explored. To provide clues for future molecular studies, we tried to explore the potential regulatory network involving EMX2 and EMX2OS in PTC by in silico analysis. Since EMX2 is a transcription factor that might participate in a series of signaling pathways, we identified its co-expressed genes and compared with the co-expressed genes of EMX2OS. Their co-expressed genes were highly overlapped, suggesting that they might have similar regulatory networks. By performing network analysis, we found that some collagens, extracellular matrix-related proteins and cytokine are the key nodes in the network. KEGG pathway analysis showed that these genes were involved the ECM-receptor interaction, focal adhesion, and PI3K-Akt signaling, protein digestion and absorption and proteoglycans in cancer pathway. These pathways are all closely related to cancer initiation and progression. Therefore, it is meaningful to further explore the regulatory effect of EMX2/EMX2OS on the expression of these genes.
Conclusion
Decreased EMX2OS expression might be a valuable prognostic biomarker of unfavorable RFS in classical PTC.
Supporting information
(DOCX)
(XLSX)
Data Availability
All relevant data are in the paper and its Supporting Information files.
Funding Statement
The authors received no specific funding for this work.
References
- 1.de Melo TG, Zantut-Wittmann DE, Ficher E, da Assumpcao LV. Factors related to mortality in patients with papillary and follicular thyroid cancer in long-term follow-up. J Endocrinol Invest. 2014;37(12):1195–200. 10.1007/s40618-014-0131-4 . [DOI] [PubMed] [Google Scholar]
- 2.Brassard M, Borget I, Edet-Sanson A, Giraudet AL, Mundler O, Toubeau M, et al. Long-term follow-up of patients with papillary and follicular thyroid cancer: a prospective study on 715 patients. J Clin Endocrinol Metab. 2011;96(5):1352–9. 10.1210/jc.2010-2708 . [DOI] [PubMed] [Google Scholar]
- 3.Toniato A, Boschin I, Casara D, Mazzarotto R, Rubello D, Pelizzo M. Papillary thyroid carcinoma: factors influencing recurrence and survival. Ann Surg Oncol. 2008;15(5):1518–22. 10.1245/s10434-008-9859-4 . [DOI] [PubMed] [Google Scholar]
- 4.Yu XM, Schneider DF, Leverson G, Chen H, Sippel RS. Follicular variant of papillary thyroid carcinoma is a unique clinical entity: a population-based study of 10,740 cases. Thyroid. 2013;23(10):1263–8. 10.1089/thy.2012.0453 [DOI] [PMC free article] [PubMed] [Google Scholar]
- 5.Zhao T, Kraemer N, Oldekamp J, Cankaya M, Szabo N, Conrad S, et al. Emx2 in the developing hippocampal fissure region. Eur J Neurosci. 2006;23(11):2895–907. 10.1111/j.1460-9568.2006.04819.x . [DOI] [PubMed] [Google Scholar]
- 6.Miyamoto N, Yoshida M, Kuratani S, Matsuo I, Aizawa S. Defects of urogenital development in mice lacking Emx2. Development. 1997;124(9):1653–64. . [DOI] [PubMed] [Google Scholar]
- 7.Tole S, Goudreau G, Assimacopoulos S, Grove EA. Emx2 is required for growth of the hippocampus but not for hippocampal field specification. J Neurosci. 2000;20(7):2618–25. . [DOI] [PMC free article] [PubMed] [Google Scholar]
- 8.Yue D, Li H, Che J, Zhang Y, Tolani B, Mo M, et al. EMX2 Is a Predictive Marker for Adjuvant Chemotherapy in Lung Squamous Cell Carcinomas. PLoS One. 2015;10(7):e0132134 10.1371/journal.pone.0132134 [DOI] [PMC free article] [PubMed] [Google Scholar]
- 9.Okamoto J, Hirata T, Chen Z, Zhou HM, Mikami I, Li H, et al. EMX2 is epigenetically silenced and suppresses growth in human lung cancer. Oncogene. 2010;29(44):5969–75. 10.1038/onc.2010.330 [DOI] [PMC free article] [PubMed] [Google Scholar]
- 10.Li J, Mo M, Chen Z, Chen Z, Sheng Q, Mu H, et al. Adenoviral delivery of the EMX2 gene suppresses growth in human gastric cancer. PLoS One. 2012;7(9):e45970 10.1371/journal.pone.0045970 [DOI] [PMC free article] [PubMed] [Google Scholar]
- 11.Falcone C, Daga A, Leanza G, Mallamaci A. Emx2 as a novel tool to suppress glioblastoma. Oncotarget. 2016;7(27):41005–16. 10.18632/oncotarget.9322 [DOI] [PMC free article] [PubMed] [Google Scholar]
- 12.Stewart DJ. Wnt signaling pathway in non-small cell lung cancer. J Natl Cancer Inst. 2014;106(1):djt356 10.1093/jnci/djt356 . [DOI] [PubMed] [Google Scholar]
- 13.Okamoto J, Kratz JR, Hirata T, Mikami I, Raz D, Segal M, et al. Downregulation of EMX2 is associated with clinical outcomes in lung adenocarcinoma patients. Clin Lung Cancer. 2011;12(4):237–44. 10.1016/j.cllc.2011.03.025 [DOI] [PMC free article] [PubMed] [Google Scholar]
- 14.Noonan FC, Goodfellow PJ, Staloch LJ, Mutch DG, Simon TC. Antisense transcripts at the EMX2 locus in human and mouse. Genomics. 2003;81(1):58–66. . [DOI] [PubMed] [Google Scholar]
- 15.Spigoni G, Gedressi C, Mallamaci A. Regulation of Emx2 expression by antisense transcripts in murine cortico-cerebral precursors. PLoS One. 2010;5(1):e8658 10.1371/journal.pone.0008658 [DOI] [PMC free article] [PubMed] [Google Scholar]
- 16.Cancer Genome Atlas Research N. Integrated genomic characterization of papillary thyroid carcinoma. Cell. 2014;159(3):676–90. 10.1016/j.cell.2014.09.050 ; PubMed Central PMCID: PMC4243044. [DOI] [PMC free article] [PubMed] [Google Scholar]
- 17.Cerami E, Gao J, Dogrusoz U, Gross BE, Sumer SO, Aksoy BA, et al. The cBio cancer genomics portal: an open platform for exploring multidimensional cancer genomics data. Cancer Discov. 2012;2(5):401–4. 10.1158/2159-8290.CD-12-0095 [DOI] [PMC free article] [PubMed] [Google Scholar]
- 18.Noonan FC, Mutch DG, Ann Mallon M, Goodfellow PJ. Characterization of the homeodomain gene EMX2: sequence conservation, expression analysis, and a search for mutations in endometrial cancers. Genomics. 2001;76(1–3):37–44. 10.1006/geno.2001.6590 . [DOI] [PubMed] [Google Scholar]
- 19.Qiu H, Yan Q, Luo X, Zhang H, Bao W, Wan X. EMX2 is downregulated in endometrial cancer and correlated with tumor progression. Int J Gynecol Pathol. 2013;32(2):193–8. 10.1097/PGP.0b013e31825d8049 . [DOI] [PubMed] [Google Scholar]
- 20.Li Q, Su Z, Xu X, Liu G, Song X, Wang R, et al. AS1DHRS4, a head-to-head natural antisense transcript, silences the DHRS4 gene cluster in cis and trans. Proc Natl Acad Sci U S A. 2012;109(35):14110–5. 10.1073/pnas.1116597109 [DOI] [PMC free article] [PubMed] [Google Scholar]
- 21.Shibata S, Wutz A. Transcript versus transcription? Epigenetics. 2008;3(5):246–9. . [DOI] [PubMed] [Google Scholar]
- 22.Yochum GS, Cleland R, McWeeney S, Goodman RH. An antisense transcript induced by Wnt/beta-catenin signaling decreases E2F4. J Biol Chem. 2007;282(2):871–8. 10.1074/jbc.M609391200 . [DOI] [PubMed] [Google Scholar]
- 23.Feng J, Bi C, Clark BS, Mady R, Shah P, Kohtz JD. The Evf-2 noncoding RNA is transcribed from the Dlx-5/6 ultraconserved region and functions as a Dlx-2 transcriptional coactivator. Genes Dev. 2006;20(11):1470–84. 10.1101/gad.1416106 [DOI] [PMC free article] [PubMed] [Google Scholar]
- 24.Watanabe T, Totoki Y, Toyoda A, Kaneda M, Kuramochi-Miyagawa S, Obata Y, et al. Endogenous siRNAs from naturally formed dsRNAs regulate transcripts in mouse oocytes. Nature. 2008;453(7194):539–43. 10.1038/nature06908 . [DOI] [PubMed] [Google Scholar]
- 25.Beltran M, Puig I, Pena C, Garcia JM, Alvarez AB, Pena R, et al. A natural antisense transcript regulates Zeb2/Sip1 gene expression during Snail1-induced epithelial-mesenchymal transition. Genes Dev. 2008;22(6):756–69. 10.1101/gad.455708 [DOI] [PMC free article] [PubMed] [Google Scholar]
- 26.Gong Y, Yang J, Wu W, Liu F, Su A, Li Z, et al. Preserved SCN4B expression is an independent indicator of favorable recurrence-free survival in classical papillary thyroid cancer. PLoS One. 2018;13(5):e0197007 10.1371/journal.pone.0197007 [DOI] [PMC free article] [PubMed] [Google Scholar]
- 27.Xu YC, Zhang FC, Li JJ, Dai JQ, Liu Q, Tang L, et al. RRM1, TUBB3, TOP2A, CYP19A1, CYP2D6: Difference between mRNA and protein expression in predicting prognosis of breast cancer patients. Oncol Rep. 2015;34(4):1883–94. 10.3892/or.2015.4183 . [DOI] [PubMed] [Google Scholar]
- 28.Xu C, Yamamoto-Ibusuki M, Yamamoto Y, Yamamoto S, Fujiwara S, Murakami K, et al. High survivin mRNA expression is a predictor of poor prognosis in breast cancer: a comparative study at the mRNA and protein level. Breast Cancer. 2014;21(4):482–90. 10.1007/s12282-012-0403-9 . [DOI] [PubMed] [Google Scholar]
- 29.Wichmann H, Guttler A, Bache M, Taubert H, Vetter M, Wurl P, et al. Inverse prognostic impact of ErbB2 mRNA and protein expression level in tumors of soft tissue sarcoma patients. Strahlenther Onkol. 2014;190(10):912–8. 10.1007/s00066-014-0655-8 . [DOI] [PubMed] [Google Scholar]
Associated Data
This section collects any data citations, data availability statements, or supplementary materials included in this article.
Supplementary Materials
(DOCX)
(XLSX)
Data Availability Statement
All relevant data are in the paper and its Supporting Information files.


