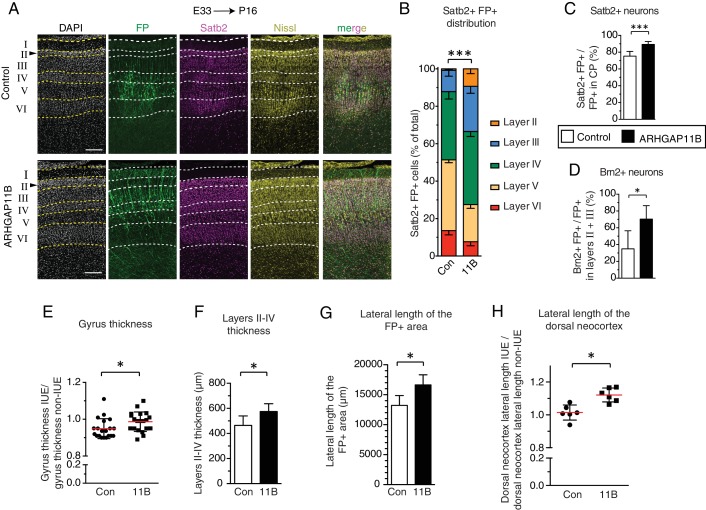
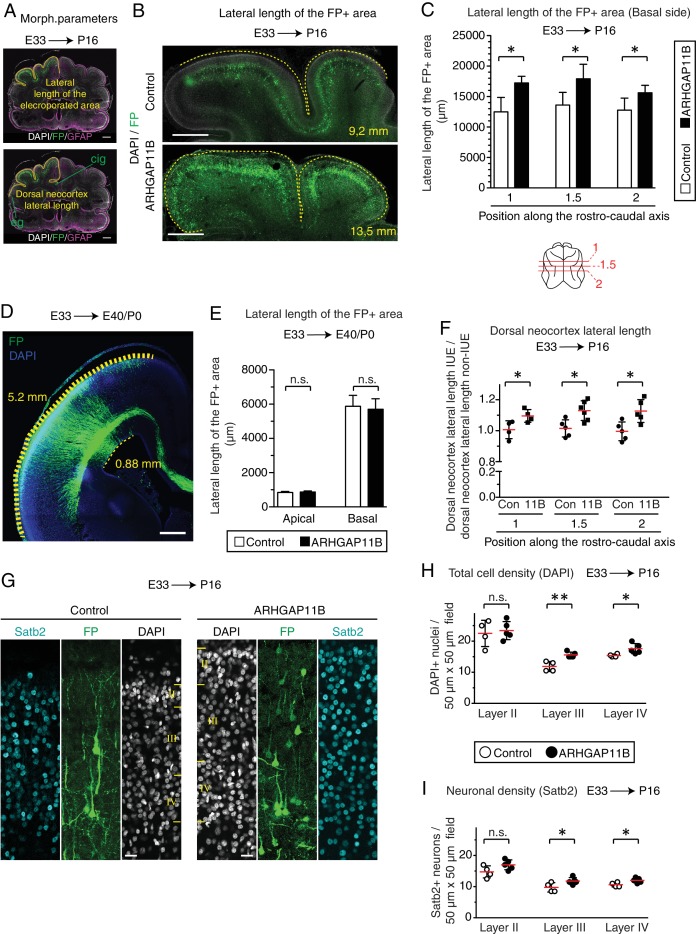
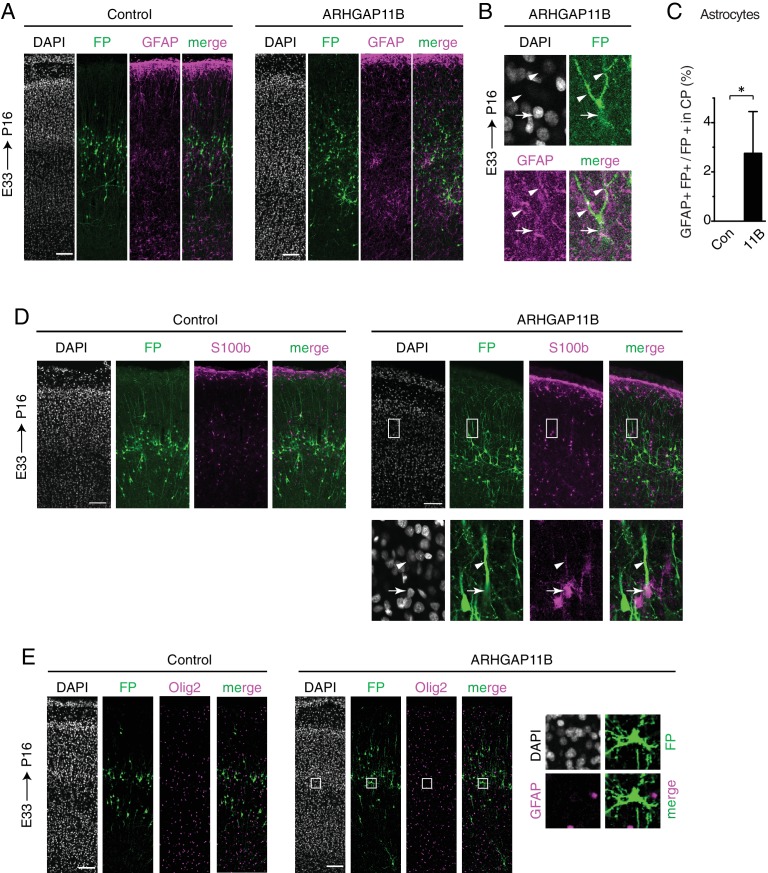
Figure 4. ARHGAP11B expression results in a greater abundance of upper-layer neurons and expansion of the developing ferret neocortex.
Ferret E33 neocortex was electroporated in utero with a plasmid encoding FP, together with either a plasmid encoding ARHGAP11B or empty vector (Control), followed by analysis at P16. (A) Double immunofluorescence for FP (green) and Satb2 (magenta), combined with DAPI (white) and Nissl (yellow) staining, of the CP (single optical sections). Neuronal layers are marked on the left. Arrowheads, increased thickness of layer II upon ARHGAP11B expression. Scale bars, 200 μm. (B) Distribution of Satb2+ FP+ neurons between the neuronal layers upon control (Con, left) and ARHGAP11B (11B, right) electroporations. Data are the mean of 6 experiments. Error bars indicate SD; ***, p <0.001; two-way ANOVA with Bonferroni post-hoc tests (Layer V, Control vs. ARHGAP11B, p <0.0001; Layer III, Control vs. ARHGAP11B, p =0.0073) (C) Percentage of FP+ cells in the CP that are Satb2+, upon control (white) and ARHGAP11B (black) electroporations. Data are the mean of 6 experiments. Error bars indicate SD; ***, p <0.001; Student's t-test. (D) Percentage of FP+ cells in layers II + III that are Brn2+, upon control (white) and ARHGAP11B (black) electroporations. Data are the mean of 5 experiments. Error bars indicate SD; *, p <0.05; Student's t-test. (E) Quantification of the gyrus thickness of control (Con) and ARHGAP11B-expressing (11B) ferret neocortex. Measurements were performed as described in Figure 4—figure supplement 3. All data are expressed as ratio between electroporated hemisphere (IUE) and non-electroporated contralateral hemisphere (non-IUE). Data are the mean (red lines) of 20 gyri per condition from six neocortices per condition. Error bars indicate SD; *, p <0.05; Student's t-test. (F) Quantification of layers II-IV thickness, upon control (Con, white) and ARHGAP11B (11B, black) electroporations. Data are the mean of 6 experiments. Error bars indicate SD; *, p <0.05; Student's t-test. (G) Quantification of the lateral length of the entire areas harbouring FP+ cells, measured as depicted in Figure 4—figure supplement 5A top, upon control (Con, white) and ARHGAP11B (11B, black) electroporations. Data are the mean of 6 experiments. Error bars indicate SD; **, p <0.01; Student's t-test. (H) Quantification of the lateral length of the dorsal neocortex, measured as depicted in Figure 4—figure supplement 5A bottom, upon control (Con) and ARHGAP11B (11B) electroporations. All data are expressed as ratio between electroporated hemisphere (IUE) and non-electroporated contralateral hemisphere (non-IUE). Data are the mean of 6 experiments. Error bars indicate SD; *, p <0.05; Student's t-test.

