Abstract
The number of microbes on Earth may be 1030, exceeding all other diversity. A small number of these can infect people and cause disease. The diversity of parasitic organisms likely correlates with the hosts they live in and the number mammal hosts for zoonotic infections increases with species richness among mammalian orders. Thus, while habitat loss and fragmentation may reduce species diversity, the habitat encroachment by people into species-rich areas may increase the exposure of people to novel infectious agents from wildlife. Here, we present a theoretical framework that exploits the species–area relationship to link the exposure of people to novel infections with habitat biodiversity. We model changes in human exposure to microbes through defined classes of habitat fragmentation and predict that increased habitat division intrinsically increases the hazard from microbes for all modelled biological systems. We apply our model to African tropical forests as an example. Our results suggest that it is possible to identify high-risk areas for the mitigation and surveillance of novel disease emergence and that mitigation measures may reduce this risk while conserving biodiversity.
Keywords: disease ecology, habitat fragmentation, emerging infectious disease, one health
1. Introduction
Biodiversity loss poses a significant threat to humanity. The global encroachment by humans into natural habitats drives habitat loss and fragmentation, leading to declines in species richness [1], which can endanger human livelihoods [2,3]. Evidence of habitat fragmentation leading to infectious disease emergence has been reported for Ebola virus disease (EVD) [4]. Human population density strongly correlates with the risk of emergence for all major classes of emerging infectious disease [5]. Zoonotic infections are those among people that come from animal sources and biodiversity has been correlated with emergence of novel zoonotic infectious diseases at the macro-scale [6]. More specifically, the number of mammalian hosts for zoonotic infections increases with species richness among mammals [4,7]. Thus, human encroachment into species-rich habitats may simultaneously decrease biodiversity and increase exposure of people to novel microbes [8–10].
Multiple, interrelated phenomena contribute to how species are affected by anthropogenic habitat loss and fragmentation, but typically loss of species diversity occurs [11,12]. While some peri-domestic and other wild species may flourish, anthropogenic species decline affects most species, which will likely include potentially pathogenic microbial agents (the majority of which remain either uncultured or undescribed [13]), their vectors and maintenance host species. The maintenance of biodiversity is hypothesized to reduce pathogen prevalence and consequently human disease risk through the dilution effect [14]. However, assuming microbial diversity correlates with that of all other life forms, there may be increased potential for novel pathogens to emerge from biodiverse regions.
The processes that lead to disease emergence are highly complex, occurring in multiple stages and across diverse scales [15]. Recent advances have linked anthropogenic land conversion to multi-host models for pathogen transmission between species in intact and degraded habitats [16], quantifying the changing infection risk across altered landscapes for multi-host pathogens. Given these results and that current disease control policies focus on rapid response to outbreaks [17]; models that link biodiversity with habitat structures and novel pathogen emergence are lacking.
Here, we present a theoretical framework that exploits the species–area relationship (SAR) to link habitat biodiversity and fragmentation with the exposure to novel infectious diseases. Instead of focusing on the specific traits of individual disease-causing agents, we attempt to estimate hazard from the full cross section of disease-causing diversity that is likely to be contained within the habitat. We define classes of habitat encroachment and fragmentation and model changes in exposure to the microbial diversity existing within them. Under the presented conditions, we predict that increased habitat division intrinsically increases exposure for all biological systems. We present an approach for determining geographical risk zones from estimated risk for novel infectious disease emergence (eRIDE). In the absence of appropriate data, we partially validate our model using historical index case data from EVD. We apply our model to African tropical forests and link eRIDE with continental human population data to estimate pandemic potential from novel pathogen emergence to help identify potential surveillance sites. Our results suggest that by exploiting ecological theory it is possible to identify high-risk areas for risk mitigation and mitigation measures that may simultaneously reduce risk and conserve biodiversity, a problem that has previously been described as both conceptually and practically challenging [18].
2. Methods
2.1. Fragmentation definitions
Habitat fragmentation can be considered as a product of non-uniform habitat loss along habitat boundaries, meaning that habitat loss and fragmentation are concurrent in the majority of non-experimental scenarios [19]. Precisely altered experimental landscapes are required to disentangle these innately linked mechanisms and their consequences on biodiversity [1], and usage of the terms ‘fragmentation’ and ‘edge effects’ often lack precision due to the inherently linked nature of habitat distributions, shapes and areas.
Here, for dynamic habitats, we classify those fragmentation-linked effects that may be independent of habitat loss into two groups: separation effects and geometric effects. Separation effects can be split into two classes (i) ‘division’ (habitat fragmentation per se [19]), changes in the total number of habitat patches and (ii) ‘isolation’, separation of habitat patches in space. Geometric effects that may occur independently of separation effects can also be separated into two classes: (i) ‘perimeter’, changes in habitat shape that alter the total perimeter (surface area for three-dimensional habitats), and (ii) ‘core habitat’, where the average shortest distance to the boundary of the habitat across its total area is modified by changes in boundary shape (figure 1).
Figure 1.
Habitat fragmentation effects. Schematic of the four proposed classes of potentially independent change to habitat distributions and shape that are often referred to as either ‘fragmentation effects' or ‘edge effects’. From left to right, geometric effects include; (i) core habitat effects, changes in the average shortest distance to the boundary of the habitat across its total area and (ii) perimeter effects, changes to the perimeter of the habitat. Separation effects are split into two classes (i) division, changes in the total number of habitat patches, elsewhere referred to as ‘habitat fragmentation per se’ and (ii) isolation, separation of habitat patches in space.
2.2. Biodiversity model
Increasing contact through habitat encroachment and fragmentation and the corresponding species diversity decline are likely to act antagonistically to affect hazards from novel pathogens. To explore this interaction, we first link the SAR to microbial diversity. The SAR predicts that at the landscape level the number of species, S, contained within similarly classed habitat fragments (or patches, i) scales with patch area, A. The exact SAR formulation is debated, here we use the power-law relationship [20] which has been extensively demonstrated for vertebrates, invertebrates, plants [21] and importantly microbial communities [22]. Thus, the formulation of the SAR used states that the number of patch-associated species (Si) scales with patch area (Ai) following a power law with magnitude c and rate of decline z.
| 2.1 |
For simplicity, we assume that habitat patches are not linked following division (approximate oceanic islands model). We compute total species diversity across fragments as  given total area
  by assuming that equation (2.1) holds for each fragment, and that the species diversity observed in each fragment is an independent sample from the total number of species S that would be observed in a single fragment of area A.
Let Si = |Xi| where Xi is the set of all species in fragment i, and S = |X| where X is the set of all species in a single fragment of area A. The probability that a given species x ∈ X is in  can be found as follows:
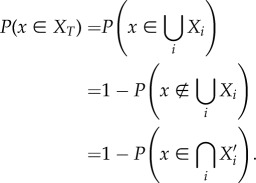 |
2.2 |
Assuming Xi is an independent draw of species diversity from the diversity that would be present in a single fragment with area  , we have:
| 2.3 |
so that
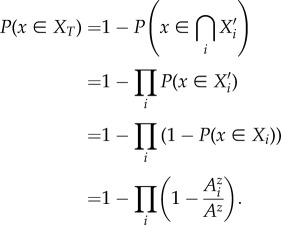 |
Thus,
 |
2.4 |
Equation (2.4) calculates total species diversity for a single, closed, multi-fragment system that can be summarized by a single value of z in equation (2.1). Within a single system, all approximations of total species diversity can be relative measures on an arbitrary scale, as c cancels in equation (2.3). Extending this model to multiple habitat types would require the reintroduction of parameter c and the complex union of data from multiple habitats accounting for species sharing, or the degree of nestedness between habitats [23]. Accurate estimation of c and nestedness require detailed field data, and thus combining data from multiple habitat types is likely impractical in the majority of situations.
2.3. Estimated risk of infectious disease emergence model
To model the risk (R) of infection emergence from the natural habitat into the expanding human population, we defined R as the product of the relative number of potential disease-causing agents within that habitat, which we assume to scale linearly with fragment biodiversity (Si), and the area over which the expanding human population comes into uniform contact with this habitat, which we assume is represented by the perimeter of the habitat (Pi). Initially, we assumed that infectious disease-causing agents within the natural habitat correlate directly with all habitat biodiversity, i.e. that the total hazard from novel pathogens was proportional to patch biodiversity. Thus the risk for each patch i is:
| 2.5 |
And total risk is:
| 2.6 |
The direct correlation between risk and diversity can be relaxed. Relative disease prevalence may reduce with increased biodiversity through a mechanism called the dilution effect [14], as increased species diversity in an area reduces effective infection transmission due to altered species' infection competency, particularly for vector-borne infections [24], thus reducing emergence risk. An alternative theoretical mechanism is amplification of infection prevalence and therefore risk with increased biodiversity, and various models of both dilution and amplification have been suggested [25]. While not a dynamic model we can investigate the impact of such dilution and amplification effects by scaling the number of disease-causing agents within the habitat as a power law function of diversity, such that equation (2.5) becomes  while maintaining the overall positive scaling with host richness and summed risk. Values of d < 1 correspond to the presence of a dilution effect and d > 1 correspond to an amplification effect.
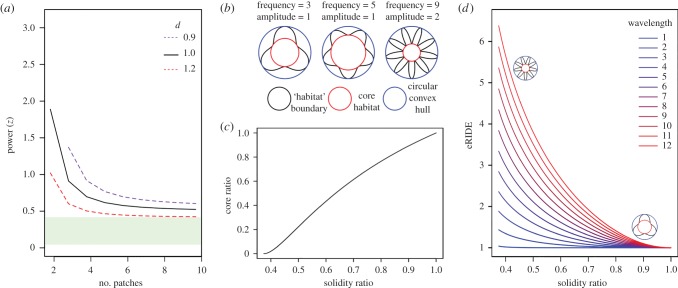
To investigate division effects we compared k identically shaped and scaled fragments for differing SAR values of z while allowing total area to vary (figure 2). To isolate and examine geometric effects we fixed the area of a single habitat in the shape of a de Broglie's circle and varied its complexity by independently altering frequency and amplitude (figure 2b).
Figure 2.
Linking fragmentation effects to eRIDE. (a) Division effects. Lines display the SAR -z-value that balances both total biodiversity (ST, equation (2.4)) and eRIDE (R, equation (2.6), see electronic supplementary material, data S1) for different numbers of equally sized patches relative to a single habitat of the same shape. Conceptually, habitats obeying an SAR with values of z less than these values will have increased eRIDE with increased division. Dashed lines display the same z-value under the scenario where a dilution/amplification effect of magnituded alters the prevalence of disease relative to habitat biodiversity. The green shaded bar indicates the likely range of real-world values of z, based on the data in electronic supplementary material, table S1. (b,c,d) Geometric effects. (b) Schematic of de Broglie's circles with varying frequency and amplitude. (c) Correlation between solidity and core ratios for de Broglie's circles. (d) Correlation between eRIDE and solidity for de Broglie's circles of varying frequency and amplitude.
2.4. Simulated encroachment model
To explore complex fragmentation patterns and the effect of encroachment strategies with different initial perimeter and division effects we simulated the erosion of two-dimensional habitats to generate landscapes containing different numbers, shapes and sizes of patch to model the potential impact of fragmentation on risk in complex landscapes. We modelled the encroachment of an expanding population into a closed, homogeneous habitat. The population expansion removed area from the habitat and grew linearly with time, maintaining a constant population density. Initial habitats were 1000 × 1000 pixels in size and complete erosion of 106 pixel2 habitats occurred over 100 time-points. A challenge landscape of the same size as the initial habitat was generated containing values between 0 and 255, defined as the capped sum of n uniformly distributed two dimensional, oblate distributions with a peak value of 255, and a radius of m pixels. Variables n and m were changed to generate landscapes containing different numbers and sizes of overlapping distributions. Habitat erosion was simulated through an iterative process where one of three encroachment scenarios, linear, box or ribbon (electronic supplementary material, video S1), was chosen to define initial contact zones between the natural habitat and the expanding population. Challenge landscape positions falling within a 10-pixel radius of contact zones were diminished iteratively until they obtained a value of zero, whereupon they were removed from the habitat area and included in the contact zone. This process was repeated for each time point until 1% of the total starting area had been removed from the habitat area, whereupon a binary image snapshot of the remaining habitat was captured for subsequent analyses.
Within each snapshot, habitat fragments were defined as non-touching binary objects using 8-pixel-connectivity. Pixel area, perimeter length, centroid position and solidity (the proportion of the object's convex hull which was occupied by the object) were recorded for each fragment at each time point.
A total of 60 000 simulations were performed, including 50 independently generated challenge landscapes over 20 values of m (ranging between 1 and 191) and 20 values of n (ranging between 1 and 191), and for linear, box and ribbon encroachment models. The habitats were modelled in MatLab® R2016b using the image processing and statistics toolboxes. The multiple habitat areas, A, were then used in our biodiversity models, and perimeters, P, used in infection risk models. Code is included in electronic supplementary material, text S1 that allows these simulations to be performed from a custom graphical user interface.
In simulations, the number of species (Si) contained within patch areas (Ai) was expressed between 0 and 1, and are a relative measure where 1 corresponds to the total number of species (S0) contained within the natural habitat at time zero (A0 = 106). So that equation (2.1) can be expressed as  .
.
2.5. Cartographic estimation of risk associated with African tropical forest encroachment
To see how our model may have real-world applications we applied it to forest fragmentation in African tropical forest. The African forests were chosen because important global infectious diseases, such as EVD, falciparum malaria, HIV and Zika virus have emerged from them, and because they are highly diverse with relatively defined boundaries. Natural habitat boundaries were defined using the Globcover 2009 dataset (ESA GlobCover 2009 Project, http://due.esrin.esa.int), a global landcover dataset with 300 m resolution that classifies majority land use into one of 22 different classes. A binary mask of forested areas was generated by selecting the following GlobCover classes; closed to open (greater than 15%) broadleaved evergreen and/or semi-deciduous forest (greater than 5 m), closed (greater than 40%) broadleaved deciduous forest (greater than 5 m), closed (greater than 40%) needle-leaved evergreen forest (greater than 5 m), closed to open (greater than 15%) mixed broadleaved and needle-leaved forest (greater than 5 m), closed (greater than 40%) broadleaved forest regularly flooded—freshwater and closed (greater than 40%) broadleaved semi-deciduous and/or evergreen forest regularly flooded—saline water. Independent forest patches were defined using 4-pixel-connectivity in the resulting binary image. Pixel areas for each patch were used to estimate patch biodiversity using the power law z-value proposed in Bell et al. [22]. A division index (number of unique patches), an edge density index (number of edge pixels) and an eRIDE index (sum of the product of number of edge pixels from each patch and their corresponding patch biodiversities) were calculated within a 20 × 20 moving window for each pixel of these data. The estimated population at risk (PAR) for each pixel was defined as the product of the pixel eRIDE index and the population density at that location. Population density data were taken from the Worldpop (http://www.worldpop.org.uk) 2010 distribution for continental Africa.
2.6. Pandemic risk associated with African tropical forest encroachment
The pandemic potential of such agents following initial cross-species transmission events (spillover) depends on subsequent human to human transmission and thus will be driven by human density (ρN) and connectivity. Understanding this for novel agents will help inform surveillance programmes. Therefore, we modelled potential spread and pandemic risk using network theory by converting the pixel grid into a network.
To estimate the potential for pandemics from an emerging disease, such as EVD, we modelled disease spread between 3 km pixels across Africa. We assumed the potential for spread between adjacent pixels a and b was proportional to the product of the population densities, so that pandemics were likely to travel along paths of high population density. To estimate the relative chance of a source pixel image x resulting in spread to a destination pixel image y, we converted the pixel image to a network using 4-connectivity, with pixels representing nodes and edge weights between adjacent pixels a and b given by
where ρa is the population density in pixel a. The potential of pandemic spread from pixel x to pixel y was then estimated by the shortest path s(x, y) in the graph between corresponding nodes x and y, which was found using Dijkstra's algorithm [26]. The relative chance of pandemic spread to pixel y was then estimated using
where the sum is taken over all potential source pixels x.
To assess the potential of each source pixel x to contribute to a pandemic, we use
so that those pixels with high populations at risk connected to large populations have the most influence on pandemic projections.
2.7. Ebola virus disease modelling
We tested the predictive capacity of our cartographic model for an infectious disease system from African forests where index case data were available, namely EVD emergence. This system is not an ideal model for our system which aims to model the risk from pathogen diversity, however, there are several Ebolavirus species and ebolaviruses have been linked to numerous host species, including bats and primates, and linked to high biodiversity areas and forest fragmentation [4].
We assume Ebola virus hosts are present in forest habitats across Africa [27] and that these forests make up a habitat whose biodiversity can be approximated by the SAR parameters proposed by Bell et al. [22], although we show that the choice of SAR parameter z will only result in relative scale changes in the outcome for any value between 0 and 0.5. A list of GPS coordinates for all known human filovirus outbreaks was compiled [4]. The geographical precision around reported EVD index cases range from 0.2 to 170 km (mean 29 km, median 10 km) [28]. EVD outbreak areas were defined as areas within r kilometre of each filovirus outbreak coordinate. The median value of pixels falling within outbreak areas was compared to the median value of an equally sized random selection of pixels falling outside of outbreak areas or from the entire map to test the predictive ability of the model. r was varied in increments of 300 m between 0.3 km and 60 km to test the relationship between predictive capacity and spatial scale. Owing to distribution of forest areas across Africa, a large proportion of the map contained zero-value pixels for the estimated metrics and pixel selections for areas outside of the outbreak zones were limited to non-zero-value pixels.
3. Results
We assessed the impact of division effects by modelling k identically shaped and scaled fragments for differing SAR values of z while allowing total area to vary (figure 2). When biodiversity is held constant eRIDE increases with k, for z < 0.5. Similarly, when eRIDE is held constant biodiversity necessarily decreases with k for z < 0.5 (electronic supplementary material, figure S1). The point at which biodiversity and eRIDE are the same between k and 1 fragments tends towards z = 0.5 as k increases (electronic supplementary material, data S1; figure 2). Analyses of invertebrate, plant, vertebrate and microbial systems suggest z does not reach 0.5 (electronic supplementary material, table S1). Thus, we predict that increased habitat division will result in increased relative RIDE for all biologically relevant scenarios where contact occurs at the habitat edge.
We observed that increasing the dilution effect increased the extent to which division influenced eRIDE (figure 2a). Strong correlation identified solidity, the ratio of the habitat's area to the area of its convex hull, as a good summary statistic for the proportion of core habitat in these simple habitat shapes (figure 2c). In this context solidity as a measure of shape complexity has the additional benefit of being a scale-independent variable with no units. Area, and thus solidity, is independent of de Broglie's frequency and only affected by amplitude, while perimeter (and thus eRIDE) depends on both amplitude and frequency. Solidity demonstrated a strong negative correlation with eRIDE (figure 2d). Predicted relationships between eRIDE and the four different classes of fragmentation effect (figure 1) are summarized in table 1.
Table 1.
Predicted relationships between fragmentation-linked effects and eRIDE.
| mechanism | summary statistic | predicted relationship with eRIDE |
|---|---|---|
| habitat loss | change in area | habitat area is directly proportional to eRIDE (equation (2.5)) |
| division | number of patches | habitat division increases eRIDE for habitats with SAR values of z less than 0.5 |
| dilution/amplification | d (equation (2.5)) | a dilution effect with increased biodiversity amplifies the effect of division on eRIDE |
| isolation | connectivity | the proposed model does not directly measure isolation. Consequences of isolation on biodiversity will be scale-, and species-specific. It is assumed parameters of the SAR are determined, in part, due to patch isolation |
| perimeter effects | change in perimeter | habitat perimeter is directly proportional to eRIDE (equation (2.5)) |
| core habitat | solidity | solidity is negatively correlated with eRIDE. True core habitat effects are independent of perimeter, area and eRIDE but only occur for dynamic habitats under special geometric scenarios |
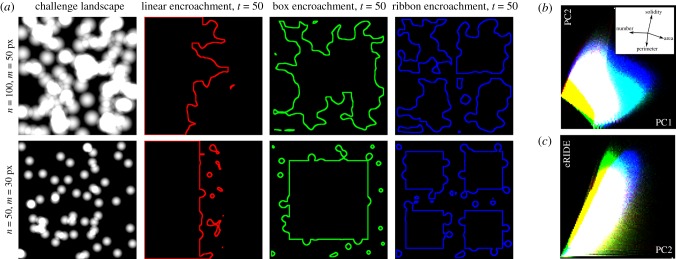
Our encroachment models generated heterogeneous landscape scenarios with large variance in metrics for all fragmentation classes (figure 3; electronic supplementary material, figure S2). Trends in these metrics were consistent with those that have been reported for real-world habitat fragmentation around expanding cities [3]; simulated encroachment typically resulted in decreases in perimeter and solidity through time whereas edge densities peaked and then fell. Median solidity values were similar between encroachment models, suggesting a level of similarity in the patch shapes explored. The longevity of larger, more closely connected or contiguous patches decreased from linear, to box, to ribbon encroachment models (electronic supplementary material, figure S2) and in general eRIDE increased most with ribbon, then box, and lastly linear encroachment (electronic supplementary material, figure S3). Principal component analysis demonstrated a strong correlation between eRIDE and components influenced by perimeter and solidity (figure 3; electronic supplementary material, figure S4). This suggests that geometric effects are likely to be the main determinants of RIDE in many real-world scenarios, and thus that structuring erosion to maximize habitat solidity is a good strategy to minimize RIDE for encroaching populations.
Figure 3.
Simulating habitat loss and fragmentation. (a) Snapshots of simulated landscapes. Depicted challenge landscapes were generated from n uniformly distributed spherical distributions with a radius of m pixels. Snapshots are taken half way through the simulated encroachment (t = 50 of 100), lines represent simulated habitat boundaries. (b) Heatmap of data from all simulated encroachment scenarios represented in the principal component axes one (PC1) and two (PC2), accounting for 51% and 37% of total variance, respectively. Inset: biplots of the influence of the contributing variables (number of patches, patch area, patch perimeter and patch solidity) to the arrangement of the principal components. (c) Heatmap depicting the correlation between PC2 and eRIDE in all simulated data, correlations between eRIDE and other principal components are displayed in electronic supplementary material, figure S4. Red, green and blue depict data from linear, box and ribbon encroachment models throughout.
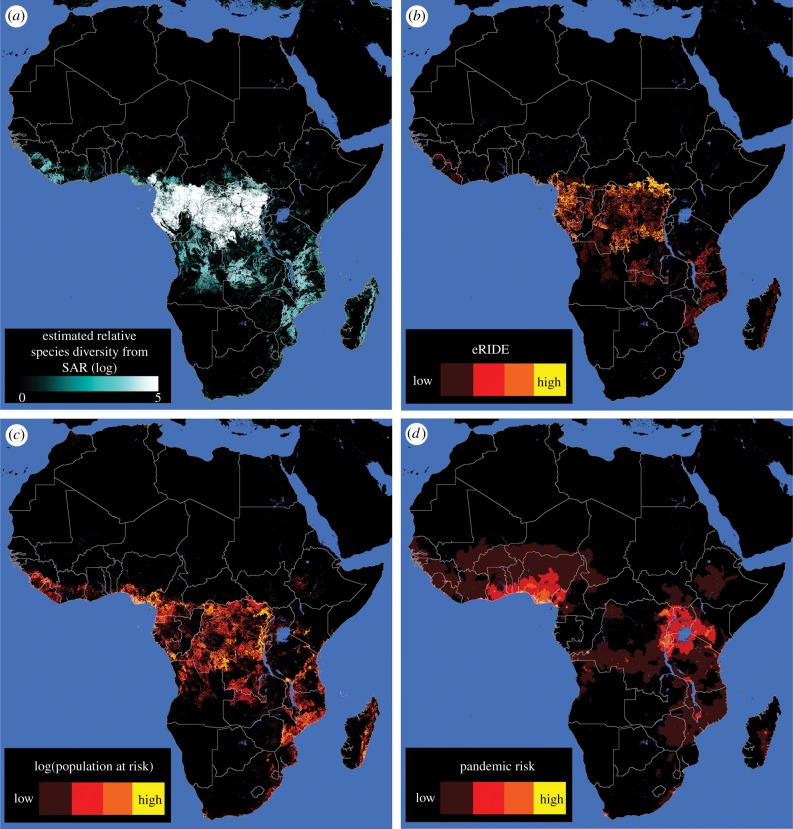
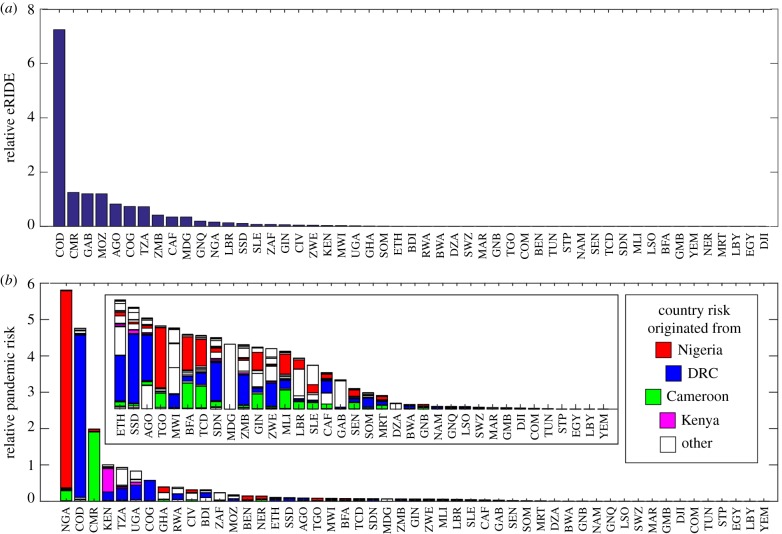
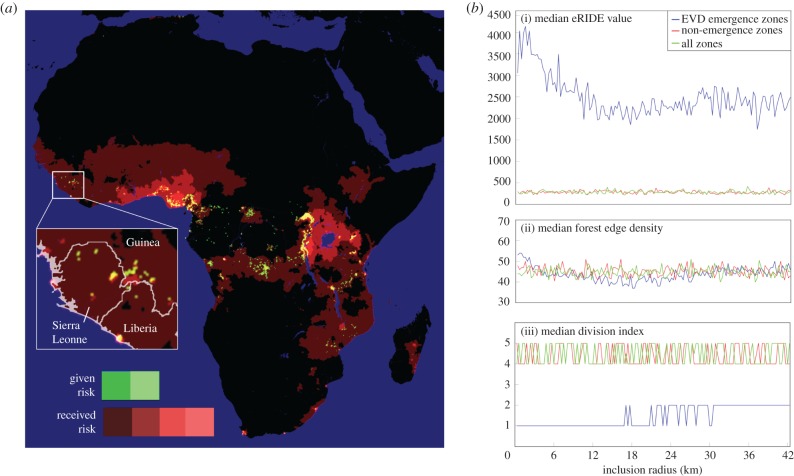
Our spatial analysis of Globcover satellite data predicted more than 70% of eRIDE across Africa to be localized within one of four countries (figures 4a and 5a); Democratic Republic of Congo (DRC; 47%), Cameroon (8%), Gabon (8%) and Mozambique (8%). In particular, DRC's northern border with the Central African Republic and Sudan was predicted to be an expansive area of high risk. Overlaid population density and eRIDE allowed the prediction of the population at risk of disease emergence (PAR). PAR predictions show that many areas of high eRIDE are sparsely populated, highlighting an important role for population centres in disease emergence and subsequent transmission (figure 4b). Under our gravity model of transmission countries at greatest pandemic risk are those that connect to, or those with high ρN and PAR (figure 4c). Modelled pandemic risk was highest in Nigeria, DRC and Cameroon. However, we identified the international aspect of pandemic spread with (for example) countries including Uganda, Kenya, Tanzania, Rwanda and Burundi experiencing significant risk of disease originating from DRC (figures 4c and 5b). Our model captured the distribution of disease that occurred during the Ebola virus outbreak of 2014–2016 in Guinea, Sierra Leonne and Liberia (figure 6a). EVD outbreak index cases occurred in high eRIDE areas, whereas simple forest edge and forest division (fragmentation per se) were poor predictors of these outbreak locations within a 60 km radius (figure 6b). The eRIDE metric was seen to work best as a predictor of EVD emergence over smaller spatial scales; a 10–12-fold increase in eRIDE was observed in areas within 5 km, compared to a seven- to eightfold increase in areas within 5–60 km of known EVD outbreak cases.
Figure 4.
Mapping spatial index estimates for African forests. Depicted are (a) estimated values of relative biodiversity, as inferred from forest patch areas and the species–area relationship (SAR), (b) eRIDE, (c) Population at risk (PAR, log values displayed for clarity) and (d) pandemic risk. Throughout, discrete colour bands increment following a log scale, one step per order of magnitude.
Figure 5.
Index rankings per country. Numbers displayed are the sums of all (a) eRIDE and (b) pandemic risk index pixel values that fall within the country boundaries as displayed in figure 4. Received pandemic risk is calculated for each country, and stacked bars indicate the relative contributions to risk from each country. Inset, increased magnification of the risk associated at the tail end of the graph.
Figure 6.
Spatial index estimates for pandemic risk for African forests and the relationship with Ebola virus disease outbreaks. Relative pandemic risk, red tones depict areas estimated to be at the highest risk of pandemic. Green zones are graph nodes with the strongest influence on the total risk of pandemic spread. Both red and green luminosity increments following a log scale (one step per order of magnitude). Inset: magnification of the area affected by the 2014–2016 EVD outbreak in Western Africa. (b) Median values are presented for metrics of (i) eRIDE, (ii) forest edge density (number of edge pixels) and (iii) forest division (fragmentation per se, number of separated patches) with EVD outbreak zones (blue), outside of EVD outbreak zones (only non-zero pixels included, red) and randomly across both inside and outside of EVD outbreak zones (only non-zero pixels included, green). The inclusion radius denotes the area around the sites of known EVD outbreak index cases that was included in the EVD outbreak zones.
4. Discussion
By using the well-characterised species--area relationship from ecology, we have developed a model framework allowing us to predict that how people encroach into natural habitats determines how they experience the risk of novel infectious disease emergence. Overall, our model suggests that there is an argument for maintaining biodiversity and reducing encroachment for the benefit of human health through reduction in the emergence of novel infectious agents. This is in support of another recent analysis which employed a different strategy to suggest that the risk of pathogen spillover is highest at intermediate levels of habitat loss [16]. By specifically decomposing the concept of ‘edge effects’ we show that maintenance of habitat core (solidity) is linked to reduced habitat perimeter and that optimal geometry is key to reducing risk, as it determines the contact zones where disease transmissions may occur. We also demonstrate that for habitats obeying the power law formulation of the SAR, the increase in contact perimeter due to habitat division outweighs the contribution of reduced biodiversity associated with habitat loss, resulting in a net increase in disease risk with habitat division. This effect will be greater for habitats experiencing the dilution effect and reduced for habitats experiencing the amplification effect. We do not explore the impact of migration between habitat fragments, as such behaviour is highly scale dependant. However, our simulations of habitat encroachment highlight the variation in the magnitude of separation effects at intermediate levels of habitat loss that result from different strategies of habitat encroachment.
Our model considers the total hazard across all habitat-associated pathogens. We believe that this general framework may negate some of the need for single system modelling [29], as it may be applicable for all pathogens from macro- to microparasites. Such an approach may inform land-use strategies in scenarios where little or no biological data are available and is therefore also pertinent regarding the emergence of ‘Disease X’ [30]. However, other models may be favourable in situations where specific pathogens are of known concern, or in situations where the relationship between pathogen richness and host species richness is not monotonic: This may be the case in scenarios where single species are known to harbour a large diversity of disease-causing agents.
Our model assumes contact occurs at the edge of habitats (e.g. figure 3) and thus is more applicable to forest-like systems. The generalizability of our results and the interaction between fragmentation and eRIDE is likely robust until some contact diffusion threshold is reached, and thus if systems such as grasslands have different contact patterns we predict alternative scenarios may be more likely. These scenarios and measures of SAR-critical parameters such as c and nestedness require future detailed modelling and field studies.
Furthermore, we estimate risk from habitat-associated biodiversity assuming that the habitat is at equilibrium. In situations where habitat decline results in extinction debt [31,32], equation (2.5) will likely be influenced by both residual habitat biodiversity and increased contact areas due to species migration, and thus the eRIDE metric can be considered a minimum or ‘best-case’ estimate. It is additionally important to distinguish between hazard and risk; in our simulations (figure 3), we assume a homogeneous human population with encroachment. However, in real-world scenarios it is the hazard from potential interactions in contact areas that changes with habitat distributions, and the realized risk comes from the presence of human populations in these areas. This parameter is calculated (population at risk, or PAR, statistic) in our cartographic estimates, where population density data are available. We expect the PAR to be dynamic and interrelated with other processes that lead to habitat change, such as urbanisation, deforestation, land clearing or farming, and predicting this change may help with future mitigation efforts.
For our case study, we have focused on a system with high species diversity. We use EVD data to partially validate our model, as this is one of the only disease models for which sufficient index case data are available for such a test. The results of this partial validation are encouraging, as they suggest the eRIDE metric is efficient at predicting emergence with high spatial resolution. However, EVD emergence may be influenced by host species richness, habitat encroachment [33] and habitat fragmentation [4], and this test case is therefore biased towards factors that are considered by our model. To test the general nature of our approach, index cases from multi-pathogen emergence datasets at appropriate spatial and temporal resolution would be required for further validation. Extending this geographical example to model epidemic disease spread, our gravity model captured the distribution of the Ebola virus outbreak of 2014–2016 in Guinea, Sierra Leonne and Liberia (figure 6a). The total pandemic risk of forest-derived infections from these three countries represented only 0.8% of the total estimated pandemic risk, highlighting the scale of potential pandemic disease burden across Africa if no intervention measures are taken to mitigate RIDE. Cross-boundary population movements were highlighted as a serious management issue during the West African EVD outbreak [34] and our model supports these observations, highlighting the necessarily international nature of disease mitigation efforts. Future models of eRIDE integrating human movement data that account for internal and regional movements, along with seasonal variations, and across other regions will be valuable efforts [35,36].
In summary, our general model can be directly applied to establish optimal land-use strategies or to identify strategic sites for disease surveillance (e.g. figure 6a). As human populations continue to expand into habitats, we propose that such general frameworks are essential for policymakers because they provide clear guiding principles that enable common ground to be established between species conservation and novel disease emergence risk mitigation. The vast scale of the estimated pandemic-associated risk across Africa with respect to the emergence of EVD in Western Africa in 2014 clearly demonstrates that internationally coordinated efforts are required to avoid catastrophic events in the future. However, our model suggests that the implementation of smaller-scale land-use strategies linked with conservation efforts may help to improve the overall burden from emerging infectious disease.
Supplementary Material
Supplementary Material
Supplementary Material
Acknowledgements
We thank Prof. Andy Tatem, University of Southampton, for comments on modelling human population movement.
Data accessibility
All data used to generate our model results are available from the referenced sources. Code for reproducing habitat encroachment models has been included in the electronic supplementary material of the article.
Authors' contributions
D.A.W. and D.T.S.H. conceived of the study. D.A.W., J.C.M., N.P.F. and D.T.S.H. designed the study, coordinated the study and helped draft the manuscript. D.A.W. and J.C.M. programmed and carried out the analyses. All authors contributed to writing and manuscript and gave final approval for publication.
Competing interests
The authors declare no competing interests.
Funding
D.T.S.H. was supported by the Rutherford Discovery Fellowship RDF-MAU1701 and Marsden MAU1503. D.A.W. and N.P.F. were supported by the New Zealand Food Safety Science and Research Centre.
References
- 1.Haddad NM, et al. 2015. Habitat fragmentation and its lasting impact on Earth's ecosystems. Sci. Adv. 1, e1500052 ( 10.1126/sciadv.1500052) [DOI] [PMC free article] [PubMed] [Google Scholar]
- 2.Mcdonald RI, Kareiva P, Formana RTT. 2008. The implications of current and future urbanization for global protected areas and biodiversity conservation. Biol. Conserv. 141, 1695–1703. ( 10.1016/j.biocon.2008.04.025) [DOI] [Google Scholar]
- 3.Liu Z, He C, Wu J. 2016. The relationship between habitat loss and fragmentation during urbanization: an empirical evaluation from 16 world cities. PLoS ONE 11, e0154613 ( 10.1371/journal.pone.0154613) [DOI] [PMC free article] [PubMed] [Google Scholar]
- 4.Rulli MC, Santini M, Hayman DT, D'Odorico P. 2017. The nexus between forest fragmentation in Africa and Ebola virus disease outbreaks. Sci. Rep. 7, 41613 ( 10.1038/srep41613) [DOI] [PMC free article] [PubMed] [Google Scholar]
- 5.Weiss RA, McMichael AJ. 2004. Social and environmental risk factors in the emergence of infectious diseases. Nat. Med. 10, S70–S76. ( 10.1038/nm1150) [DOI] [PMC free article] [PubMed] [Google Scholar]
- 6.Jones KE, Patel NG, Levy MA, Storeygard A, Balk D, Gittleman JL, Daszak P. 2008. Global trends in emerging infectious diseases. Nature 451, 990–993. ( 10.1038/nature06536) [DOI] [PMC free article] [PubMed] [Google Scholar]
- 7.Han BA, Kramer AM, Drake JM. 2016. Global patterns of zoonotic disease in mammals. Trends Parasitol. 32, 565–577. ( 10.1016/j.pt.2016.04.007) [DOI] [PMC free article] [PubMed] [Google Scholar]
- 8.Karesh WB, et al. 2012. Ecology of zoonoses: natural and unnatural histories. Lancet (London, England) 380, 1936–1945. [DOI] [PMC free article] [PubMed] [Google Scholar]
- 9.Pongsiri MJ, Roman J, Ezenwa VO, Goldberg TL, Koren HS, Newbold SC, Ostfeld RS, Pattanayak SK, Salkeld DJ. 2009. Biodiversity loss affects global disease ecology. Bioscience 59, 945–954. ( 10.1525/bio.2009.59.11.6) [DOI] [Google Scholar]
- 10.Patz JA, et al. 2004. Unhealthy landscapes: policy recommendations on land use change and infectious disease emergence. Environ. Health Perspect. 112, 1092–1098. ( 10.1289/ehp.6877) [DOI] [PMC free article] [PubMed] [Google Scholar]
- 11.Hughes JB, Daily GC, Ehrlich PR. 1997. Population diversity: its extent and extinction. Science 278, 689–692. ( 10.1126/science.278.5338.689) [DOI] [PubMed] [Google Scholar]
- 12.Krauss J, et al. 2010. Habitat fragmentation causes immediate and time-delayed biodiversity loss at different trophic levels. Ecol. Lett. 13, 597–605. ( 10.1111/j.1461-0248.2010.01457.x) [DOI] [PMC free article] [PubMed] [Google Scholar]
- 13.Pace NR. 2009. Mapping the tree of life: progress and prospects. Microbiol. Mol. Biol. Rev. 73, 565–576. ( 10.1128/MMBR.00033-09) [DOI] [PMC free article] [PubMed] [Google Scholar]
- 14.Keesing F, et al. 2010. Impacts of biodiversity on the emergence and transmission of infectious diseases. Nature 468, 647–652. ( 10.1038/nature09575) [DOI] [PMC free article] [PubMed] [Google Scholar]
- 15.Wolfe ND, Dunavan CP, Diamond J. 2007. Origins of major human infectious diseases. Nature 447, 279 ( 10.1038/nature05775) [DOI] [PMC free article] [PubMed] [Google Scholar]
- 16.Faust CL, McCallum HI, Bloomfield LSP, Gottdenker NL, Gillespie TR, Torney CJ, Dobson AP, Plowright RK. 2018. Pathogen spillover during land conversion. Ecol. Lett. 21, 471–483. ( 10.1111/ele.12904) [DOI] [PubMed] [Google Scholar]
- 17.World Health Organization. 2008. International health regulations (2005), Geneva, Switzerland: WHO Press. [Google Scholar]
- 18.Hayman DT. 2016. Conservation as vaccination. EMBO Rep. 17, 286–291. ( 10.15252/embr.201541675) [DOI] [PMC free article] [PubMed] [Google Scholar]
- 19.Fahrig L. 2003. Effects of habitat fragmentation on biodiversity. Annu. Rev. Ecol. Evol. Syst. 34, 487–515. ( 10.1146/annurev.ecolsys.34.011802.132419) [DOI] [Google Scholar]
- 20.Tjorve E, Tjorve KM. 2008. The species-area relationship, self-similarity, and the true meaning of the z-value. Ecology 89, 3528–3533. ( 10.1890/07-1685.1) [DOI] [PubMed] [Google Scholar]
- 21.Matthews TJ, Triantis KA, Rigal F, Borregaard MK, Guilhaumon F, Whittaker RJ. 2016. Island species–area relationships and species accumulation curves are not equivalent: an analysis of habitat island datasets. Global Ecol. Biogeogr. 25, 607–618. ( 10.1111/geb.12439) [DOI] [Google Scholar]
- 22.Bell T, Ager D, Song JI, Newman JA, Thompson IP, Lilley AK, van der Gast CJ. 2005. Larger islands house more bacterial taxa. Science 308, 1884 ( 10.1126/science.1111318) [DOI] [PubMed] [Google Scholar]
- 23.Matthews TJ, Cottee-Jones HEW, Whittaker RJ. 2015. Quantifying and interpreting nestedness in habitat islands: a synthetic analysis of multiple datasets. Divers. Distributions 21, 392–404. ( 10.1111/ddi.12298) [DOI] [Google Scholar]
- 24.Civitello DJ, et al. 2015. Biodiversity inhibits parasites: broad evidence for the dilution effect. Proc. Natl. Acad. Sci. USA 112, 8667–8671. ( 10.1073/pnas.1506279112) [DOI] [PMC free article] [PubMed] [Google Scholar]
- 25.Roberts M, Heesterbeek J. 2018. Quantifying the dilution effect for models in ecological epidemiology. J. R. Soc. Interface 15, 20170791 ( 10.1098/rsif.2017.0791) [DOI] [PMC free article] [PubMed] [Google Scholar]
- 26.Dijkstra EW. 1959. A note on two problems in connexion with graphs. Numerische Mathematik 1, 269–271. ( 10.1007/BF01386390) [DOI] [Google Scholar]
- 27.Leroy EM, et al. 2005. Fruit bats as reservoirs of Ebola virus. Nature 438, 575–576. ( 10.1038/438575a) [DOI] [PubMed] [Google Scholar]
- 28.Peterson AT, Samy AM. 2016. Geographic potential of disease caused by Ebola and Marburg viruses in Africa. Acta Trop. 162, 114–124. ( 10.1016/j.actatropica.2016.06.012) [DOI] [PubMed] [Google Scholar]
- 29.Pigott DM, et al. 2017. Local, national, and regional viral haemorrhagic fever pandemic potential in Africa: a multistage analysis. Lancet 390, 2662–2672. ( 10.1016/S0140-6736(17)32092-5) [DOI] [PMC free article] [PubMed] [Google Scholar]
- 30.WHO. 2018. List of Blueprint priority diseases.
- 31.Tilman D, May RM, Lehman CL, Nowak MA. 1994. Habitat destruction and the extinction debt.
- 32.Kuussaari M, et al. 2009. Extinction debt: a challenge for biodiversity conservation. Trends Ecol. Evol. 24, 564–571. ( 10.1016/j.tree.2009.04.011) [DOI] [PubMed] [Google Scholar]
- 33.Olivero J, et al. 2017. Recent loss of closed forests is associated with Ebola virus disease outbreaks. Sci. Rep. 7, 14291 ( 10.1038/s41598-017-14727-9) [DOI] [PMC free article] [PubMed] [Google Scholar]
- 34.Carroll MW, et al. 2015. Temporal and spatial analysis of the 2014–2015 Ebola virus outbreak in West Africa. Nature 524, 97–101. ( 10.1038/nature14594) [DOI] [PMC free article] [PubMed] [Google Scholar]
- 35.Pigott DM, et al. 2014. Mapping the zoonotic niche of Ebola virus disease in Africa. Elife 3, e04395 ( 10.7554/eLife.04395) [DOI] [PMC free article] [PubMed] [Google Scholar]
- 36.Pigott DM, et al. 2016. Updates to the zoonotic niche map of Ebola virus disease in Africa. Elife 5, e16412 ( 10.7554/eLife.16412) [DOI] [PMC free article] [PubMed] [Google Scholar]
Associated Data
This section collects any data citations, data availability statements, or supplementary materials included in this article.
Supplementary Materials
Data Availability Statement
All data used to generate our model results are available from the referenced sources. Code for reproducing habitat encroachment models has been included in the electronic supplementary material of the article.


