

Abstract
Background
Government alcohol monopolies were created in North America and Scandinavia to limit health and social problems. The Swedish monopoly, Systembolaget, reports to a health ministry and controls the sale of all alcoholic beverages with > 3.5% alcohol/volume for off-premise consumption, within a public health mandate. Elsewhere, alcohol monopolies are being dismantled with evidence of increased consumption and harms. We describe innovative modelling techniques to estimate health outcomes in scenarios involving Systembolaget being replaced by 1) privately owned liquor stores, or 2) alcohol sales in grocery stores. The methods employed can be applied in other jurisdictions and for other policy changes.
Methods
Impacts of the privatisation scenarios on pricing, outlet density, trading hours, advertising and marketing were estimated based on Swedish expert opinion and published evidence. Systematic reviews were conducted to estimate impacts on alcohol consumption in each scenario. Two methods were applied to estimate harm impacts: (i) alcohol attributable morbidity and mortality were estimated utilising the International Model of Alcohol Harms and Policies (InterMAHP); (ii) ARIMA methods to estimate the relationship between per capita alcohol consumption and specific types of alcohol-related mortality and crime.
Results
Replacing government stores with private liquor stores (Scenario 1) led to a 20.0% (95% CI, 15.3–24.7) increase in per capita consumption. Replacement with grocery stores (Scenario 2) led to a 31.2% (25.1–37.3%) increase. With InterMAHP there were 763 or + 47% (35–59%) and 1234 or + 76% (60–92%) more deaths per year, for Scenarios 1 and 2 respectively. With ARIMA, there were 850 (334–1444) more deaths per year in Scenario 1 and 1418 more in Scenario 2 (543–2505). InterMAHP also estimated 10,859 or + 29% (22–34%) and 16,118 or + 42% (35–49%) additional hospital stays per year respectively.
Conclusions
There would be substantial adverse consequences for public health and safety were Systembolaget to be privatised. We demonstrate a new combined approach for estimating the impact of alcohol policies on consumption and, using two alternative methods, alcohol-attributable harm. This approach could be readily adapted to other policies and settings. We note the limitation that some significant sources of uncertainty in the estimates of harm impacts were not modelled.
Keywords: Alcohol monopoly, Sweden, Mortality, Morbidity, Privatisation, Policy modelling
Background
Rationale for present study
Government monopolies for the sale or distribution of alcohol exist in North America (USA and Canada), Northern Europe and India. The North American alcohol monopolies were set up in the 1920’s and 1930’s, in most cases following the repeal of prohibition. Today, 17 US states control sales of spirits and/or wine at the wholesale level and 13 of these also at the retail level [1]. Retail “monopolies” for all alcohol beverages remain in twelve of Canada’s thirteen regional jurisdictions [2], though, increasingly, sales of alcohol are also being allowed in private stores and even grocery stores in some provinces [3]. In the Nordic countries, Iceland, Norway, Sweden and Finland have state alcohol retail monopolies for higher strength beers, wine and spirits. The state monopolies on import, distribution and wholesale distribution in these countries were abolished in Sweden and Finland in 1995 after entering EU, and in Norway in 1996 [4].
The Swedish government alcohol monopoly, Systembolaget, was established as a state owned national company in 1955 with a monopoly on the retail sale of alcoholic beverages in Sweden with a strength greater than 3.5%. Systembolaget has an explicit mandate to reduce alcohol-related harm, operates without a profit motive and reports to the Ministry of Health and Social Affairs. With increasing pressure to privatise or gradually dismantle government monopolies in other countries [5–7], it is important to use best available research evidence to estimate the likely impacts on public health and safety that would ensue under different privatisation scenarios. The purpose of the present study is to estimate the likely public health consequences were Systembolaget to be abolished, an issue last addressed in a 2008 study reported both by Norström et al. [8] and Holder et al. [9]. We present an innovative approach to estimating the changes in alcohol consumption and the associated public health burden that would result from two alternative policy scenarios in Sweden.
Swedish alcohol policy context
The legal age limit for selling alcoholic beverages off-premise (at Systembolaget) is 20 years and is 18 years for on-premise sales (restaurants, bars, cafes). Systembolaget currently runs 436 retail stores and licenses about 500 agents in rural areas to handle local distribution of alcohol. Rural agent stores account for less than 1 % of all sales. Systembolaget stores mostly open for 9 h on weekdays, for five hours on Saturdays and are closed on Sundays. Retail prices are based on the wholesale purchase price plus a basic fixed surcharge and a 19% surcharge on purchase price before alcohol taxes. Prices are fixed to be the same in all stores. Beer up to 3.5% alcohol by volume can also be sold in ordinary grocery stores, convenience stores and gasoline stations. Alcohol purchases over the Internet from foreign sellers, some with Swedish stakeholders, have been made legal but sales from this source remain below 1% of total sales [10].
In the Swedish parliament, all parties, with varying degrees of enthusiasm, support restrictive alcohol policies in order to limit alcohol consumption and harm. These policies include high alcohol taxes, a state owned retail monopoly, high age limits for alcohol purchase, restricting the number of licensed premises for alcohol serving and restricting marketing for alcohol. High alcohol taxes and the alcohol retail monopoly have received increased popular support in the last decade [11]. A number of other Swedish monopolies have been dismantled during the past decades, such as the railways, pharmacies and vehicle inspections. The gambling monopoly is also likely to be abolished soon. The alcohol retail monopoly thus has increasingly become the exception to the rule.
Swedish alcohol consumption and related harm
Alcohol consumption has declined in Sweden from a peak in consumption in 2004 of 10.5 l per person above 15 years of age, to 9.2 l in 2016 based on official alcohol sales data [10]. Drinking among young people has gone down, while consumption among older people, above 65 years, has increased. The National Board of Health and Welfare estimate that alcohol-related mortality increased between 1990 to 2005 but has since decreased. Over this period estimated hospital stays for alcohol-related illness have increased slightly but steadily.
Previous studies of privatisation of alcohol retail monopolies
A group under the auspices of the US Centers for Disease Control conducted a systematic review of alcohol retail privatisation events up to December 2010 [12]. Following criteria for design suitability and validity, 17 studies of 12 privatisation events were selected for the review. The median increase in per capita sales of privatised beverages was 44.4% over all studies, ranging from 0 to 305%. More recently, studies of the partial privatization of alcohol in British Columbia, Canada over a period of a few years, indicated that an increasing proportion of liquor stores in private ownership assessed across 89 regions was associated with increased alcohol consumption [13, 14], alcohol attributable mortality [3] and morbidity [15]. In the latter study, the relationship held after controlling for changes in alcohol pricing policies.
Opportunity created by new methods for estimating alcohol attributable harm
Recent developments for estimating alcohol attributable harm in the Global Burden of Disease studies include new methods to estimate the continuous prevalence distribution of alcohol consumption at different levels throughout a population [16]. These involve the combined use of both population surveys (which frequently underestimate total alcohol consumption) and estimates of per capita alcohol consumption based on official sales or taxation data. Further, it has been demonstrated that if one knows the proportion of drinkers in a population and can estimate overall per capita consumption, it is possible to reliably estimate the distribution of that consumption across the whole population e.g. proportions of light, moderate or heavy drinkers [16]. Specifically, it has been shown that the within country distribution of alcohol consumption assessed by self-report survey for more than 60 countries can be best described by a gamma distribution.
With the technical advances described below, it is now possible to estimate changes in alcohol attributable harm for a given change in the total consumption of alcohol. Such an approach was applied after estimating changes in the per capita consumption of alcohol in the Swedish population under different policy scenarios using the International Model of Alcohol Harms and Policies (InterMAHP) [17, 18], a new, open access resource to support the estimation of alcohol attributable harm. InterMAHP is based on similar principles to those used in Global Burden of Disease (GBD) estimates for alcohol and was created in collaboration with authors of the GBD alcohol methods. However, it was designed to provide a more accessible tool and methods for alcohol harm estimation and, as well, to enable estimation of the effects of changes in alcohol consumption on rates of alcohol attributable harm. In addition, we estimated changes in alcohol attributable mortality and crime using an alternative ARIMA method based on observed relationships over many decades between per capita consumption and these outcomes following methods used in earlier studies [8].
Methods
The study team identified key policy levers that would potentially change under the two privatisation scenarios from comprehensive and systematic literature reviews on alcohol policy [12, 19] and past evaluations of Systembolaget [8]: hours and days of trading; average alcohol prices; minimum available alcohol prices; alcohol advertising and promotions; and provision of alcohol to young people. We also considered potential changes in cross-border purchases of alcohol. The two selected scenarios themselves represent major alternative privatised systems: (i) a more restrictive one in which alcohol is permitted to be sold only in privately owned liquor stores and (ii) a more liberal system in which alcohol can be sold in any grocery store. Estimation of impacts on public health and safety proceeded through the steps explained below.
Step 1: The extent to which policy levers would change under privatisation scenarios
We employed comparisons with privatisation experiences in Scandinavia and North America informed by expert Swedish opinion to estimate the extent to which outlet density, days and hours of trading, average and minimum available prices of alcohol and promotions of all kinds would change under each of the 2 scenarios (see Table 1 for summary). While there is also evidence for private liquor stores being less strict in their checking of customer age-IDs and level of intoxication than are government-owned stores [20], we were unable to find an empirical basis upon which to estimate the effects on population consumption and therefore, conservatively, excluded these from the analysis. The studies used to inform these estimates were drawn from the systematic reviews identified below in Step 2 as well as the team’s knowledge of research in alcohol monopoly countries. In particular, we drew heavily on a systematic review of the impacts of privatisation events on alcohol sales to identify relevant studies [12] and recent studies of the impacts of opening increasing numbers of private liquor stores alongside government stores in the Canadian province of British Columbia [13, 14]. The existence of the two kinds of stores operating alongside each other is almost unique and allows direct comparison on issues such as pricing and trading hours.
Table 1.
The estimated changes in key policy levers in two privatisation scenarios
| Policy Lever | Scenario 1 – Private Liquor Stores | Scenario 2 – Grocery Stores |
|---|---|---|
| Population density of liquor stores | 200% increase | 1500% increase |
| Sunday trading | An extra 12 h day added | An extra 14 h day added |
| Extended hours | An increase of 44% | An increase of 68% |
| Mean prices | Beer + 4.9% | Beer + 2.4% |
| Wine + 6.0% | Wine + 3.0% | |
| Spirits + 1.4% | Spirits + 0.7% | |
| Minimum prices | Beer −19.9% | Beer −24.9% |
| Wine −12.5% | Wine −15.6% | |
| Spirits −20.6% | Spirits −25.7% | |
| Promotions | Half the inverse effect of a ban | Inverse of effect of a ban |
Population density of liquor stores
In Scenario 1 we estimated a 3-fold increase in liquor stores based on Sweden’s recentexperience with privatising pharmacies and also Canadian experiences of privatisations [13, 14]. This equates to an additional 10 outlets per 100,000 population. Under Scenario 2 it was assumed that all of Sweden’s 6900 grocery stores would sell alcohol, equating to an additional 75 outlets per 100,000 population.
Days of sale
We assumed the addition of Sunday sales in both scenarios with 12 h for Scenario 1 and 14 h for Scenario 2.
Additional operating hours
We assumed specialty stores would open 12 h per day in Scenario 1 (for 72 versus 50 h, Monday to Saturday = + 44%) based on opening hours of private stores in British Columbia, Canada and 14 h per day in Scenario 2 based on trading hours of Swedish grocery stores (for 84 versus 50 h, Monday to Saturday = + 68%).
Alcohol prices
We assumed small increases in average prices based on the privatisation of alcohol in Alberta, Canada (4.9% beer, 6% wine, 1.4% spirits) [13], the clearest case of a complete privatisation event with estimated impacts on per capita alcohol consumption identified from our systematic review. For Scenario 1, we also estimated that this increase would be counter-acted by larger decreases in the minimum prices based on a survey of private versus government liquor store prices at which alcohol was available in British Columbia, Canada [21] (− 19.9% beer, − 12.5% wine, − 20.6% spirits). The only published empirical studies of the impacts of minimum pricing on consumption come from Canada. The authors had access to this price survey of private liquor stores that operate almost uniquely alongside government-controlled liquor stores permitting price comparisons for cheapest alcohol brands between the two sources. For Scenario 2, we drew on data from Washington, USA [22] reporting how price changes compared in private liquor stores versus grocery stores following a recent privatisation event. Based on that study, we estimated that the increase in mean grocery store prices in Scenario 2 would be half that in Scenario 1, but that minimum prices would be 25% lower in Scenario 2.
Promotions, advertising and marketing
While comprehensive and systematic reviews consistently identify promotions, advertising and marketing as important drivers of alcohol consumption [23], especially among youth, we were unable to identify a method to quantify the intensity of these activities. Instead, we elected to use an approach used by Norstrom [8] of extrapolating estimated impacts of an advertising ban on alcohol consumption. At the present time, there are considerable restrictions on advertising, marketing and promotions of alcohol in Sweden, and the monopoly operates without a profit motive. We estimated an effect size opposite to that observed for a complete ban on alcohol advertising in a study of US states [24] for Scenario 2 and 50% of that for Scenario 1.
Step 2: The independent effect of each policy lever on recorded per capita alcohol consumption
Comprehensive systematic reviews and, where possible, meta-analyses, were completed to estimate the effect on per capita alcohol consumption of the above changes in: (1) alcohol outlet density, (2) days and hours of alcohol sale, (3) price and (4) advertising and are reported in full elsewhere while being briefly summarised here [25]. Quality criteria were applied to select studies with controlled before and after intervention analyses.
Density of liquor outlets
Of 754 relevant articles identified, only four met the quality inclusion criteria, three of which were population-level studies [14, 26, 27], the other individual-level [28]. Different measures of outlet density ruled out a meta-analysis. The scale of changes in density estimated to occur under the two scenarios (200 and 1500% respectively) were significantly larger than those reported in two of the identified studies. We reanalysed data from the other identified study [15] and found evidence that the effects of increasing outlet density on alcohol consumption obeyed a decay function such that smaller proportional effects were seen at higher levels of outlet density that were equivalent to what was predicted for Systembolaget. This finding was used to estimate consumption impacts of the different increases in outlet density for the two scenarios.
Days and hours of sale
Of 1514 relevant papers identified, only 7 met the quality inclusion criteria and were used to formulate the scenarios, six of which studied days of sale [29–34] and one of which studied hours of sale [35]. Across-study results were consistent and a meta-analysis indicated that an additional day of sale was associated with a 3.4% increase in total consumption. Estimates were also made for the effect on per capita consumption of the additional hours of trading each day from Monday to Saturday (22 h in Scenario 1, 34 h in Scenario 2). These were based on the effect size estimated for the effect of the addition of a whole extra day of trading assuming, in the absence of other evidence, a decay function in effect size similar to that for outlet density.
Prices
We took estimates of the price elasticity of demand for each beverage type (beer, wine and spirits) of − 0.79, − 0.57 and − 0.96 respectively from a Swedish study [36] and used these to calculate the impact of the change in mean price on consumption. As no Swedish minimum price elasticities exist, we applied beverage-specific price elasticities for changes in the minimum available price of alcohol, calculated from Saskatchewan, Canada [37] of − 1.387, − 0.511 and − 0.589 respectively.
Advertising, promotion and marketing
We assumed a direct effect on recorded consumption under each scenario, based on evidence from [24].
Step 3: The collective impact of all policy levers on total per capita alcohol consumption
We combined these independent effect estimates for each policy lever assuming a simple additive effect each applied to the baseline estimate. Swedish data from 2001 to 2005 [38] was used to estimate substitution between recorded and unrecorded consumption, resulting in an estimated elasticity of unrecorded demand of − 0.197. This figure was combined with the estimated net change in recorded consumption [10].
Step 4: Estimating the uncertainty around modelled changes in per capita consumption
To estimate uncertainty around each parameter, we collected standard errors or confidence intervals around the selected empirical estimates quantifying the relationships between each policy parameter (i.e. outlet density, days and hours of sale et cetera) and age 15+ per capita alcohol consumption. We used a Probabilistic Sensitivity Analysis (PSA) framework to take 10,000 random draws from the probability distribution around each parameter and combine obtained values to estimate overall effects on per capita consumption, as well as for 95% confidence intervals around the estimates of the change in mean consumptionfor each scenario. Normal distributions were assumed for each parameter and the analysis was conducted using Excel, version 16.
Step 5: Impacts on alcohol-related harms under each scenario
Two alternative analytic approaches were applied to the estimation of the impacts of changes in per capita consumption of alcohol attributable harms. The first applies assumptions derived from the international epidemiological literature regarding risk relationships between consumption and harm for many disease and injury outcomes. The second bases estimates on observed relationships over many years in Sweden between level of alcohol consumption and alcohol related harms. Each has strengths and weaknesses. The purpose was to investigate how sensitive the estimates would be to different analytic approaches.
Method a: InterMAHP alcohol attributable fractions
Using methodological principles based on Global Burden of Disease studies, e.g. [39], the International Model of Alcohol Harms and Policies [18] was used to estimate, Sweden-specific Sweden-specific alcohol-attributable deaths and hospital stays for an expanded list of conditions (see Appendix Table 6) were estimated for each of ten population subgroups, defined by gender and age (15–34,35-64,65+) using the internet-based resource InterMAHP [17]. For a comprehensive description of methods to calculate alcohol-attributable morbidity and mortality, including treatment of all methods choices used to run InterMAHP, see Sherk et al. [18]. We used the dose-response relationships from [40] to calculate Swedish AAFs for IHD morbidity and mortality. The InterMAHP default functions and values for all other conditions were used. The binge drinking level was defined in Sweden as 60 g/day for both men and women and the InterMAHP capped relative risk extrapolation method was used.
Method B: ARIMA modelling of Swedish consumption and harm data
The expected change in harm associated with each of the 2 scenarios was based on estimates of the recent historical relation between per capita alcohol consumption and harm summarised in Norstrom and Ramstedt [41]. We focused on a broad range of harm indicators in order to obtain a comprehensive assessment of the projected changes in population drinking. We included cirrhosis mortality as this is the classical indicator of harmful effects of chronic heavy consumption, as well as injury mortality, which is likely to be linked to episodic intoxication drinking. Suicide is an extreme self-destructive behaviour for which alcohol’s direct involvement in any case is often hard to ascertain but which, in general, is often influenced by drinking [42]. Assaults and drink driving represent two important indicators of harm from others’ drinking. Data sources, statistical methods and reported relationships between alcohol consumption and these outcomes are detailed elsewhere [43]. ICD-codes for the causes of death included are listed in Appendix Table 7. Data were analysed by applying the technique of seasonal ARIMA-modelling or SARIMA (seasonal autoregressive integrated moving average model) [44]. Error-correction modelling (ECM) was used to explore lagged effects in the relationship between population consumption and liver cirrhosis [45].
ICD-10 code data to 3 digits (e.g. C00) for 2014 for all modelled conditions were obtained from the Swedish Health and Welfare Database (accessed at http://www.socialstyrelsen.se/statistics/statisticaldatabase/causeofdeath) for deaths and the National Board of Health and Welfare for hospital stays.
Estimating the distribution of alcohol consumption
Swedish survey data were used to estimate: (i) the prevalence of lifetime abstainers (≤ 1 drink ever), (ii) the prevalence of former drinkers (< 1 drink past year), (iii) the prevalence of current drinkers (≥1 drink past year) (iv) the prevalence of binge drinkers (> 60 g ethanol/day at least monthly) and (v) average daily consumption within the subgroup. Data were obtained from the Swedish Council for Information on Alcohol and Other Drugs (CAN) (prevalence of lifetime abstainers and former drinkers), the National Prospective Study of Substance Use and Harm [46] (mean daily consumption by sub-group) and the CAN Monitor Survey (binge drinking) [11].
These data were combined with Swedish per capita consumption data to create subgroup-specific per capita consumption estimates following the methods described elsewhere [47]. The distribution of drinkers in each subgroup was calculated using a one-parameter definition of the Gamma distribution [47]. We assumed a maximum level of consumption of 250 g ethanol per day corresponding to the mean levels of consumption observed in street-involved groups of dependent drinkers observed in Canada [48].
Estimating relative risk curves for alcohol attributable conditions
Conditions for which alcohol consumption had a causal impact were identified via standardized methodology [49] (see Appendix Table 6 for summary). Relative risk curves for these conditions were obtained from Rehm et al. and are similar to those used in the WHO 2018 Global Status Report on Alcohol and Health. To calculate Alcohol Attributable Fractions (AAFs) for partially alcohol attributable conditions, we used the following general formula:
where Pf is the prevalence of former drinkers, RRfis the relative risk of former drinkers, P(x) is the prevalence of drinkers at daily consumption level x and is calculating using the Gamma distribution, RR(x) is the disease-specific relative risk at daily consumption level x and 250 g is an assumed maximum daily consumption level [18].
Changes in the prevalence of “binge” drinking
Special AAFs were calculated for injuries, ischaemic stroke and ischaemic heart disease that took account of the prevalence of “binge drinking” as measured by survey data. Estimated changes from baseline in the prevalence of binge drinking due to increased consumption in each scenario were extrapolated from observed relationships between rates of binge drinking and mean daily consumption across the 10 age-gender sub-groups.
Wholly alcohol attributable conditions
Some conditions (e.g. mental and behavioural disorders due to alcohol, ICD10 code F10) are completely, and not partially, attributable to alcohol (i.e. its AAF = 1.00). For each population subgroup, an absolute risk function was calibrated, assuming a linear form, to match the observed number of deaths or hospital stays given the initial distribution of consumption. These functions were combined with the post-intervention distribution of consumption in order to estimate changes in the relevant harm outcomes under each scenario. See [50] for more details of the calibration process.
Changes in deaths and hospital stays
The percentage increases in per capita alcohol consumption were applied to consumption for each subgroup in both scenarios. We assumed the prevalence of abstainers and former drinkers would not change. Different distributions of current drinkers were then calculated using these updated per capita consumption figures for each scenario. These updated distributions of consumption were applied to the AAF formula above and updated AAFs were calculated for each condition, subgroup and scenario. An adjustment was also calculated to modify the number of hospital stays (or deaths) due to this increased consumption, calculated as
where H1 is the number of hospital stays for a condition under Scenario 1, H0 is number of hospital stays observed in 2014 (base case), and AAF1 and AAF0 are the AAFs calculated under Scenario 1 and the base case, respectively.
Statistical analysis
InterMAHP v1.0, an open access SAS-based software program, was used to perform the data analysis to calculate AAFs [17, 51] which were subsequently used to calculate the number of deaths and hospital stays that are attributable to alcohol consumption from the total number of recorded deaths and admissions for each condition.
Results
Effects of changes in policy levers on per capita alcohol consumption
The combined results of Steps 1 to 4 are shown in Table 2 with estimated effects of each individual policy change and their combined effects on per capita consumption with 95% confidence intervals.
Table 2.
Estimated 95% Confidence Intervals around changes in recorded per capita consumption for each lever and overall change in consumption for each scenario
| Lever | Scenario 1 | Scenario 2 |
|---|---|---|
| Density of outlets | 9.47% (7.44–11.58%) | 16.43% (14.71–18.19%) |
| Sunday trading | 1.01% (−3.21–5.27%) | 1.18% (CI -3.70-6.24%) |
| Extended opening hours | 3.83% (3.31–4.36%) | 4.82% (CI 4.15–5.48%) |
| Mean price | −2.83% (− 3.91%- -1.73%) | −1.41% (− 1.96%- -0.88%) |
| Minimum price | 13.34% (10.24–16.44%) | 16.67% (12.86–20.55%) |
| Promotions | 2.50% (0.27–4.75%) | 5.00% (0.58–9.50%) |
| Overall change in per capita consumption (recorded & unrecorded) | 19.99% (15.34–24.73%) | 31.23% (25.12–37.33%) |
The estimates for revised levels of total per capita consumption are illustrated in Fig. 1 alongside consumption levels for 23 European countries in 2010, accessed from the European Commission public health indicators website (http://ec.europa.eu/health/alcohol/indicators_en). As can be seen, the estimates of consumption under both scenarios are well within the limits observed for other European countries with private alcohol retail systems, such as Denmark and Germany.
Fig. 1.
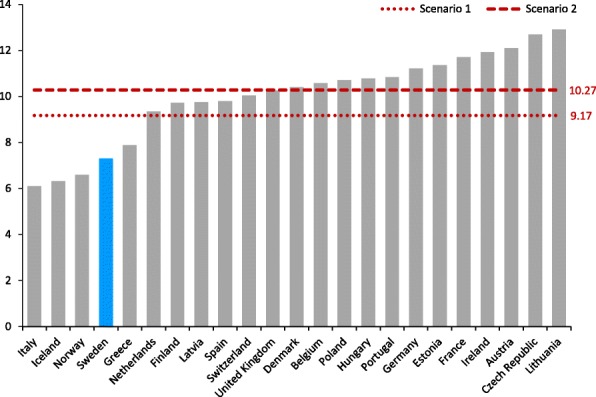
Per capita recorded alcohol consumption in 23 European countries (litres per year)
Effects of changes in per capita alcohol consumption on levels of harms
Estimates from method a: InterMAHP attributable fractions
As shown in Table 3, the 20% increase in per capita consumption in Scenario 1 is predicted to lead to 763 additional AA deaths per year, an increase of 47% (95% CIs: 35–59%). The estimated 31.23% increase in per capita consumption in Scenario 2 is projected to cause an additional 1234 deaths per year, an increase of 76% (95% CIs, 60–92%). Alcohol may provide a protective effect for certain conditions such as hypertension, ischaemic heart disease, ischaemic stroke and type 2 diabetes, although this has been increasingly questioned [52]. This traditionally assumed protective effect, however, was taken into account and explains the negative number of AA deaths for cardiovascular conditions and diabetes.
Table 3.
The estimated impacts of each privatisation scenario on alcohol-related harm based on the International Model of Alcohol Harms and Policies
| Harm measure | Total Sweden 2014 | Scenario 1 extraa (95% CIs) | Scenario 2 extraa (95% CIs) |
|---|---|---|---|
| Alcohol attributable deaths | |||
| Cancers | 712 | 138 (106, 172) | 219 (175, 263) |
| Mental health | 243 | 50 (40, 59) | 70 (59, 78) |
| Cardiovascular | − 452 | 305 (226, 391) | 516 (398, 641) |
| Digestive | 394 | 134 (100, 169) | 220 (172, 270) |
| Injuries | 651 | 119 (91, 145) | 183 (147, 215) |
| Infectious diseases | 80 | 17 (13, 22) | 27 (22, 33) |
| Type 2 diabetes | −133 | −6 (−5, −7) | −9 (−7, − 10) |
| Total deaths: N (95% | 1629 | 763 (576–957) | 1234 (974, 1501) |
| CIs) % Change (95% CIs) | – | + 47% (35, 59%) | + 76% (60, 92%) |
| Alcohol attributable hospital stays | |||
| Cancers | 3068 | 668 (509, 832) | 1060 (846, 1277) |
| Mental health | 28,172 | 5635 (4513, 6661) | 7874 (6741, 8807) |
| Cardiovascular | − 7934 | 1574 (1193, 1970) | 2525 (2002, 3053) |
| Digestive | 1972 | 550 (415, 693) | 896 (705, 1094) |
| Injuries | 10,565 | 1928 (1478, 2361) | 2973 (2398, 3507) |
| Infectious diseases | 2249 | 503 (385, 623) | 790 (633, 947) |
| Type 2 diabetes | − 373 | −12 (−9, −14) | −16 (− 14, − 18) |
| Total stays: N (95% CIs) | 38,091 | 10,859 (8493, 13,140) | 16,118 (13,325, 18,685) |
| % Change (95% CIs) | – | + 29% (22, 34%) | + 42% (35, 49%) |
aCalculated as percentage change in alcohol attributable conditions
As shown also in Table 3, in Scenario 1 an additional 10,859 hospital stays per year was estimated, a 29% (95% CIs: 22–34%) increase. The 31% per capita consumption increase associated with Scenario 2 was projected to lead to 16,118 additional hospital stays due to alcohol per year, a 42% (95% CIs: 35–49%) increase. In both scenarios, the largest net increase is projected for mental health conditions followed by injuries, cardiovascular and digestive conditions.
Estimates of increased alcohol-related deaths and hospital stays under each scenario were also analysed by gender and three age groups and are reported in Appendix Tables 8 and 9.
Estimates based on method B: ARIMA modelling
Results of the ARIMA modelling to estimate the relationships between per capita consumption for five harm indicators are shown in Table 4, based on analyses reported by Norstrom and Ramstedt [41].
Table 4.
Estimated effects of per capita alcohol consumption (litres of ethanol) on harm rates in Sweden, 1987 to 2015
| Elasticity estimatea | 95% CIs | |
|---|---|---|
| Cirrhosis | 0.170 | 0.124–0.215 |
| Suicide | 0.122 | 0.071–0.174 |
| Injuries | 0.106 | 0.018–0.194 |
| Assaults | 0.102 | 0.081–0.122 |
| Drink driving | 0.157 | 0.086–0.228 |
aThe proportional change in a harm indicator for a 1 l increase in per capita alcohol consumption
Applying the estimated elasticities in Table 4 to the estimated changes in per capita consumption for each scenario resulted in estimates of increased mortality and crime as shown in Table 5.
Table 5.
Estimated impacts of each privatisation scenario on alcohol-related harm based on ARIMA analyses of Swedish time series data
| Harm measure | Total Sweden 2014 | Scenario 1 | Scenario 2 |
|---|---|---|---|
| N, % (95% CIs) | N, % (95% CIs) | ||
| Alcoholic cirrhosis deaths | 429 | 160 (111–211) | 273 (186–371) |
| + 37.2% (25.9–45.2%) | + 63.7% (43.3–86.5%) | ||
| Injury deaths | 1833 | 399 (61–797) | 660 (96–1384) |
| + 21.8% (3.3–45.5%) | + 36.0% (5.3–75.5%) | ||
| Suicide deaths | 1142 | 291 (161–436) | 485 (261–750) |
| + 25.5%) | + 42.4% (22.9–65.6%) | ||
| Total deaths | 3404 | 850 (334–1444) | 1418 (543–2505) |
| + 25.0% (9.8–42.4%)) | + 41.7% (16.0–73.6%) | ||
| Assault crimes | 83,324 | 17,407 (13,549-21,225) | 28,680 (22,063-35,369) |
| + 20.9% (16.3–25.5) | + 34.4% (26.5–42.4%) | ||
| Drink-driving | 13,769 | 4669 (2388-7273) | 7940 (3900-12,903) |
| + 33.9% (17.3–52.8%) | + 57.7% (28.3%93.7%) |
Discussion
This paper presents estimates of the public health and safety impacts of abolishing Systembolaget under two alternative scenarios. The baseline estimates for Sweden in 2014 (implied by the changes estimated above) indicate the extent of existing alcohol-related harm in Sweden with estimates for 2014 of 2081 deaths and 46,026 hospital stays being directly attributable to alcohol per year if the contested health benefits of alcohol use are discounted [52]. We demonstrate two methods of estimating increases in alcohol related harms based on estimated changes in per capita alcohol consumption under different policy scenarios. These indicate substantial increases in alcohol attributable deaths, crimes and hospital admissions were Sweden to privatise its liquor monopoly.
In Scenario 1, we assumed Systembolaget stores were replaced by privately-owned speciality liquor stores and that annual alcohol consumption would increase by 20.0% from 9.2 l to 11.1 l per capita as a result. Using the InterMAHP burden of disease approach, we estimated that Scenario 1 would lead to 763 additional deaths (+ 47%) and 10,859 additional hospital stays (+ 29%) per year. The ARIMA method provides alternative estimates for a narrower range of important alcohol-related harms. Using the ARIMA method, we estimate that each year under Scenario 1 there would be 160 (37.2%) more liver cirrhosis deaths, 399 (21.8%) more deaths from injuries, 291 (25.5%) more suicides, 17,407 (20.9%) more assaults and 4669 (33.9%) more drink driving offences.
In Scenario 2 (alcohol sold in privately-owned grocery stores), we estimate a 31.2% increase in alcohol consumption to an annual total of 12.2 l per capita adult. Using the InterMAHP methodology, this consumption increase would lead to 1234 more deaths each year (+ 76%) and 16,118 more hospital stays (+ 42%). Using the ARIMA method, we estimated there would be 273 (63.7%) more liver cirrhosis deaths, 660 (36.0%) more deaths from injuries, 485 (42.4%) more suicides, 28,680 (34.4%) more assaults and 7940 (57.7%) more drink driving offences.
Differences from previous estimates
Norström et al. [8] estimated in the early 2000s the consequences of abolishing the Swedish alcohol monopoly. Despite the use of updated reviews of the published literature and analyses of recent Swedish data on alcohol-related harm, there are similarities with both the results and conclusions of the last published study by Norström et al. [8]. In both instances it was concluded that the density of liquor outlets, the hours that liquor stores are open, the average price of alcoholic products and the effects of marketing and promotion activities all have the potential to influence levels of alcohol consumption and related harms. Since the earlier report, there has been new research on floor or minimum prices. In the present exercise we estimate that while privatisation may slightly increase the average price of alcohol, this is more than offset by the effects on alcohol consumption of a reduction in the prices of the cheapest alcohol. In relation to impacts of all effects of privatisation on population consumption of alcohol, we estimated a larger impact for Scenario 1 (specialty liquor stores) than in Norström et al. [8] and a slightly smaller impact for Scenario 2 (grocery stores). The estimated changes in per capita alcohol consumption under each scenario are also well within the range reported in the main systematic review of privatisation events conducted by the US Centers for Disease Control [12], namely a median increase of 44.4% and range from 0 to 305%.
Limitations and uncertainties
We acknowledge a range of factors that may have led us to overestimate, underestimate or have uncertain effects on our estimates. We assumed a simple additive effect such that the overall effect of the various policy changes is the sum of the individual effects as estimated from the published literature. There is only a small literature regarding how in practice the effects of policies are altered when they are introduced in combination. Studies from the US [53], Australia [54] and Canada [15] suggest that the combined effects of introducing two or more policies at the same time is a sub-additive effect on alcohol consumption i.e. the combined impact is less than the sum of the individual policy impacts. However, Norström et al. [8] argued that a multiplicative model is more applicable. In the absence of conclusive evidence, we took the middle course of assuming a simple additive model. Given the complexity and range of estimates reported in this paper and the absence of an empirical basis upon which to conduct a sub- additive model, we elected not to present sensitivity analyses here.
Our models follow the standard WHO GBD assumption that alcohol is protective in low doses for some cardiovascular conditions as well as type 2 diabetes. However, this assumption is being increasingly questioned for all-cause mortality [48], for cardiovascular disease [52] and type 2 diabetes [55] so we may have underestimated the net extent of alcohol-related harm in Sweden. There are also other general limitations to be acknowledged in relation to the widely used attributable fraction method. While Sweden specific attributable fractions were calculated based on systematic reviews of the international literature and meta-analyses describing risk relationships between alcohol consumption and diseases, it is possible that these risk relationships are different in Sweden. It should be noted, however, that the attributable fraction method relies on survey data on Swedish drinking patterns and also official Swedish data on the prevalence of potentially alcohol attributable diseases and injuries. A significant further limitation was that we only formally estimated confidence intervals around our estimates of alcohol consumption change and not around our estimates of how this translated into changes into alcohol attributable morbidity and mortality. Confidence intervals around estimates from the ARIMA models are shown in Table 4 but were not used to calculate the confidence intervals around our final estimates of changes in harm. Also, the time of writing, InterMAHP (Sherk et al., 2018) does not include a function to calculate confidence intervals. This will be addressed in a future version. It is likely, therefore, that the reported confidence intervals here are conservative.
We were unable to find an empirical basis upon which to estimate the effects on population consumption of the established tendency for private liquor stores to be less strict in their checking of customer age-IDs and level of intoxication than is the case in government-owned stores [20]. Neither did we take account of increased frequency of exposure for consumers to alcohol marketing and purchasing opportunities when visiting grocery stores for other items. We were also not able to include some 100% alcohol caused deaths e.g. cases of alcoholic gastritis from the general category of gastritis. These issues may have caused the estimates to underestimate the true impact of the changes.
While we acknowledge these various sources of possibly upward or downward bias in our estimation methods, a comparison with levels of consumption in other European countries shows that Sweden currently tends to have lower consumption than countries where alcohol distribution is fully privatised. In particular, we note per capita consumption levels of between 11 and 12 l per person aged 15+ in neighbouring Denmark and Germany which suggests our estimates are quite plausible. Furthermore, our estimates are based on the best-available evidence, draw on robust analytical methods and were subjected to examination of uncertainty.
Implications for Swedish alcohol policy
Our results suggest abolishing Systembolaget would lead to significant increases in alcohol consumption and in the health and (some) social problems caused by alcohol. This is the case in both of the scenarios we examined which cover more or less restrictive visions of privatisation. This is because privatisation typically leads to a reduction in the minimum price charged for alcohol, an increase in the number of outlets selling alcohol, an increase the trading hours of those outlets and increased promotion and marketing of alcohol.
In theory it is possible to implement policies which would mitigate these effects and thereby prevent an increase in alcohol-related harms following privatisation. In practice, this has proved difficult to achieve in other countries with privatised alcohol markets as the number of commercial actors within the policy-making process tends to be both more numerous and effective in their lobbying efforts than in monopoly states. This has tended to stifle efforts to implement effective alcohol control policies and, conversely, has facilitated deregulatory measures that increase the potential for harmful public health consequences. The UK’s experience with minimum unit pricing for alcohol illustrates this point. Industry-led legal battles, for example, delayed the Scottish Parliament’s 2012 decision to introduce minimum unit pricing by six years [56]. By contrast, government alcohol monopoly jurisdictions can both introduce and modify all liquor prices at will by regulation with minimal delays (e.g. [37]). Given this and other experiences, it should not be assumed that a privatised market can be or will be straightforwardly and effectively regulated.
A government monopoly, especially one like Systembolaget with an explicit public health mandate, may be an ideal vehicle for enabling evidence-based alcohol policies to be implemented in the public interest. Nonetheless, we suggest Systembolaget could be used to generate further improved outcomes by having its policies strengthened in some areas e.g. by introducing an explicit minimum price per standard drink (12 g ethanol) for all alcoholic beverages indexed to the cost of living. It is possible to have both relatively high average prices for alcohol alongside quite low minimum prices, which is currently the case in Sweden. Thus setting minimum prices per standard drink and indexing these to the cost of living would further improve public health outcomes. In addition, any policy that increases competition in the alcohol market in Sweden is likely to have an adverse effect on public health and safety by driving down minimum prices even further and by increasing access, especially to under-aged drinkers. If Swedes wish to have an alcohol monopoly as an efficient tool to reduce harms, it is also important to not erode it through seemingly minor exceptions e.g. allowing alcohol sales via the Internet or permitting the sale of alcohol at farms, something currently being proposed.
Recommendations for future research
Finally, we suggest that the research basis upon which estimates of the public health and safety impacts of alcohol policy changes are made needs to be strengthened. We highlight in particular the need for improved estimates of the risk relationships between alcohol use and disease based on longitudinal studies that control for different sources of lifetime selection bias e.g. bias caused by comparing risks for current versus former drinkers [57]. Similarly, improved methods are needed to estimate more precisely the relationships between drinking patterns in a population and the rate of acute alcohol-related harms.
In addition, a larger pool of well-controlled studies of the public health and safety impacts of abrupt changes in alcohol policies is needed, including studies which examine the interplay between multiple policy changes. An improved evidence base in each of these areas will support more precise estimates of the potential impact of hypothetical policy changes in a given jurisdiction.
Conclusions
New understandings about how the distribution of alcohol consumption changes in a population as total consumption changes can be used also to help estimate changes in alcohol attributable harm under different policy scenarios. In depth studies of the relationship between per capita alcohol consumption and related harms in a country over many years can also be used for this same purpose. In the case of modelling estimated changes in alcohol related mortality as a result of privatising the Swedish government alcohol monopoly, the two methods produced broadly similar estimates of increased alcohol attributable harms. Confidence in this conclusion is supported by the degree of convergence in the estimates of increased harm from two quite different theoretical and methodological approaches. Although we have modelled the uncertainties due to random variation and presented these in our range of estimates, we have not modelled the impact of changing the assumptions upon which the model is based, and these may have a larger impact on the outcomes predicted by the model than the impacts of random variation.
While both privatisation scenarios considered resulted in substantial increases in alcohol consumption, attributable crime, hospitalisation and death, the largest increase was estimated for the sale of alcohol in grocery stores. We also conclude that improved health and safety outcomes could be achieved were Systembolaget to introduce still stronger policies, especially in the area of alcohol pricing. With increasing trends towards privatisation of alcohol control and distributions systems in North America, these estimates may also be a cautionary tale for policy makers in other full or partial alcohol monopoly jurisdictions. Increased government control over the distribution and sale of alcohol is also an option for countries with fully privatised systems to consider as an effective means of reducing alcohol-related harms.
Acknowledgements
We gratefully acknowledge the support and training in the GBD estimation methods for this project provided by Drs Jürgen Rehm and Kevin Shield (Centre for Addiction and Mental Health, Ontario, Canada).
Funding
This study was funded by Systembolaget, the Swedish government alcohol monopoly, which reports to the Ministry of Health and Social Affairs. All parties signed a funding agreement with Systembolaget that excluded them from attending project meetings and specified that that their role was to provide any requested information and to make comments on an early draft only for matters of fact, not interpretation. Thus the funding body played no role in the design of the study or interpretation of the presented analyses.
Specifically, the project funds paid salary contributions for AS and CA; research expenses for TN and MR; travel and accommodation expenses to attend three meetings for all collaborators and stipends for attending meetings for all bar HH, SA and AS.
Availability of data and materials
We have utilized publicly available datasets regarding hospitalizations, deaths, crime events and economic costs identified in them Methods section of the manuscript. We have also relied on the results of multiple published systematic reviews and meta-analyses including those available on the Internet resource, the International Model of Alcohol Harms and Policies (https://www.uvic.ca/research/centres/cisur/projects/intermahp/index.php).
Abbreviations
- ECM
Error-correction modelling
- GBD
Global Burden of Disease
- InterMAHP
International Model of Alcohol Harms and Policies
- SARIMA
Seasonal Autoregressive Integrated Moving Average Model
Appendix
Table 6.
Three digit ICD-10 codes corresponding to alcohol attributable conditions used in GBD WHO method (Method A)
| Major Category | Condition | ICD-10 code |
|---|---|---|
| Infectious diseases | Tuberculosis | A15 to A19 |
| HIV | B20 to B24 | |
| Lower respiratory tract infections | J09 to J22 | |
| Cancer | Oropharyngeal cancer | C00 to C14 |
| Oesophageal cancer | C15 | |
| Colorectal cancer | C18 to C21 | |
| Liver cancer | C22 | |
| Pancreatic cancer | C25 | |
| Laryngeal cancer | C32 | |
| Breast cancer | C50 | |
| Type 2 diabetes | Type 2 Diabetes mellitus | E11, E14 |
| Mental health conditions | Mental and behavioural disorders due to alcohol | F10 |
| Epilepsy | G40 to G41 | |
| Cardiovascular conditions | Hypertensive disease / hypertension | I10 to I15 |
| Ischaemic heart disease | I20 to I25 | |
| Cardiac arrhythmia | I47 to I49 | |
| Heart failure and complications of heart disease | I50 to I52 | |
| Ischaemic stroke | I63, I65 to I67 | |
| Haemorrhagic stroke | CI60 to I62 | |
| Digestive conditions | Cirrhosis of the liver | K70, K74 |
| Acute pancreatitis | K85 | |
| Injuries* | Unintentional injuries | Begins with V or W, X00 to X59, Y40 to Y86, Y88, Y89 |
| Intentional self-harm | X60 to X84 | |
| Assault/homicide | X85 to Y09 |
*ICD10 codes for injury hospital stays appear in an additional diagnosis category called “external cause of injury.” To be included, the primary diagnosis must have an ICD10 code in S00 to S99, T00 to T77, T79
Table 7.
Causes of death and police-reported offences used in Method B
| ICD9 | ICD10 | |
|---|---|---|
| Deaths | ||
| Alcoholic liver disease | 571.0–571.3 | K70-K70.4, K70.9 |
| Suicide | E950-E959 | X60-X84, (except X65) Y87.0 |
| Injuries. Composite measure comprising: | ||
| Drowning injuries | E910 | W65-W74 |
| Fall injuries | E880-E888, E848 | W00-W19 |
| Fire injuries | E890-E899 | X00-X09 |
| Motor-vehicle traffic crashes | E810-E819 | V02-V04, V12-V14, V20-V79, V89.2 |
| Undetermined | E980–E989 | Y10–Y34,Y87.2,Y89.9 |
| Police-reported offences | ||
| Assaults | ||
| Drink driving | ||
Table 8.
Estimated number of alcohol-attributable deaths in Sweden under Scenarios 1 and 2, by disease category, age group and gender
| Male | Female | Total | ||||||||
|---|---|---|---|---|---|---|---|---|---|---|
| AAD | Scen1 | Scen2 | AAD | Scen1 | Scen2 | AAD | Scen1 | Scen2 | ||
| Cancers | 15–34 | 2 | 3 | 3 | 2 | 3 | 3 | 4 | 6 | 6 |
| 35–64 | 143 | 174 | 192 | 78 | 96 | 106 | 221 | 270 | 298 | |
| 65+ | 341 | 402 | 438 | 146 | 173 | 188 | 487 | 575 | 626 | |
| Subtotal | 486 | 579 | 633 | 226 | 271 | 297 | 712 | 850 | 930 | |
| Mental health conditions | 15–34 | 2 | 3 | 3 | 1 | 1 | 1 | 3 | 4 | 4 |
| 35–64 | 73 | 87 | 93 | 26 | 31 | 33 | 99 | 118 | 126 | |
| 65+ | 115 | 138 | 148 | 27 | 33 | 35 | 142 | 171 | 183 | |
| Subtotal | 190 | 228 | 244 | 54 | 65 | 69 | 244 | 293 | 313 | |
| Cardiovascular conditions | 15–34 | 4 | 5 | 6 | 2 | 3 | 4 | 6 | 8 | 10 |
| 35–64 | 72 | 141 | 183 | 16 | 35 | 48 | 88 | 176 | 231 | |
| 65+ | −211 | −81 | 11 | − 335 | −250 | − 188 | − 546 | − 331 | − 177 | |
| Subtotal | − 135 | 65 | 200 | − 317 | − 212 | − 137 | −452 | −147 | 63 | |
| Digestive conditions | 15–34 | 1 | 2 | 2 | 0 | 0 | 0 | 1 | 2 | 2 |
| 35–64 | 163 | 241 | 291 | 64 | 77 | 86 | 227 | 318 | 377 | |
| 65+ | 100 | 132 | 154 | 66 | 76 | 83 | 166 | 208 | 237 | |
| Subtotal | 265 | 374 | 446 | 129 | 154 | 168 | 394 | 528 | 614 | |
| Injuries | 15–34 | 172 | 197 | 210 | 32 | 37 | 40 | 204 | 234 | 250 |
| 35–64 | 218 | 256 | 277 | 44 | 52 | 57 | 262 | 308 | 334 | |
| 65+ | 145 | 177 | 194 | 41 | 51 | 56 | 186 | 228 | 250 | |
| Subtotal | 535 | 630 | 681 | 116 | 140 | 153 | 651 | 770 | 834 | |
| Infectious diseases | 15–34 | 1 | 1 | 1 | 0 | 0 | 0 | 1 | 1 | 1 |
| 35–64 | 6 | 7 | 8 | 2 | 3 | 3 | 8 | 10 | 11 | |
| 65+ | 48 | 59 | 65 | 23 | 28 | 31 | 71 | 87 | 96 | |
| Subtotal | 55 | 67 | 74 | 25 | 31 | 34 | 80 | 98 | 108 | |
| Type 2 diabetes | 15–34 | 0 | 0 | 0 | −1 | −1 | −1 | −1 | −1 | −1 |
| 35–64 | 2 | 3 | 3 | −9 | −10 | −10 | −7 | −7 | −7 | |
| 65+ | 10 | 12 | 13 | − 136 | −144 | − 147 | −126 | − 132 | − 134 | |
| Subtotal | 13 | 15 | 16 | − 146 | − 154 | − 158 | − 133 | − 139 | − 142 | |
| Total for all conditions | 15–34 | 182 | 211 | 225 | 36 | 44 | 48 | 218 | 255 | 273 |
| 35–64 | 676 | 909 | 1048 | 219 | 284 | 323 | 895 | 1193 | 1371 | |
| 65+ | 549 | 839 | 1022 | − 168 | −34 | 56 | 381 | 805 | 1078 | |
| Subtotal | 1408 | 1958 | 2294 | 87 | 294 | 427 | 1495 | 2252 | 2721 | |
NB: Rows and columns may not add exactly due to rounding. AAD = alcohol-attributable deaths. Scen1 = predicted increase in deaths in Scenario 1. Scen2 = predicted increase in deaths in Scenario 2
Table 9.
Estimated number of alcohol-attributable hospital stays in Sweden under Scenarios 1 and 2, by disease category, age group and gender
| Male | Female | Total | ||||||||
|---|---|---|---|---|---|---|---|---|---|---|
| AAH | Scen1 | Scen2 | AAH | Scen1 | Scen2 | AAH | Scen1 | Scen2 | ||
| Cancers | 15 to 34 | 29 | 35 | 36 | 30 | 38 | 43 | 59 | 73 | 79 |
| 35 to 64 | 800 | 952 | 999 | 591 | 734 | 819 | 1391 | 1686 | 1818 | |
| 65+ | 1079 | 1234 | 1283 | 540 | 646 | 707 | 1619 | 1880 | 1990 | |
| Subtotal | 1908 | 2221 | 2318 | 1160 | 1417 | 1569 | 3068 | 3638 | 3887 | |
| Mental health conditions | 15 to 34 | 2793 | 3216 | 3321 | 1920 | 2313 | 2473 | 4713 | 5529 | 5794 |
| 35 to 64 | 14,042 | 16,287 | 16,841 | 4792 | 5765 | 6155 | 18,834 | 22,052 | 22,996 | |
| 65+ | 3685 | 4287 | 4438 | 939 | 1129 | 1208 | 4624 | 5416 | 5646 | |
| Subtotal | 20,520 | 23,790 | 24,600 | 7652 | 9207 | 9837 | 28,172 | 32,997 | 34,437 | |
| Cardio-vascular conditions | 15 to 34 | 139 | 164 | 172 | 33 | 53 | 65 | 172 | 217 | 237 |
| 35 to 64 | 340 | 728 | 845 | − 891 | − 682 | − 550 | − 551 | 46 | 295 | |
| 65+ | − 2296 | − 1825 | − 1676 | − 5258 | − 5072 | − 4932 | − 7554 | − 6897 | − 6608 | |
| Subtotal | − 1818 | − 933 | − 659 | − 6117 | − 5701 | − 5417 | − 7935 | − 6634 | − 6076 | |
| Digestive conditions | 15 to 34 | 140 | 170 | 179 | 68 | 119 | 158 | 208 | 289 | 337 |
| 35 to 64 | 904 | 1095 | 1155 | 267 | 362 | 425 | 1171 | 1457 | 1580 | |
| 65+ | 452 | 521 | 543 | 141 | 164 | 181 | 593 | 685 | 724 | |
| Subtotal | 1496 | 1785 | 1877 | 476 | 646 | 763 | 1972 | 2431 | 2640 | |
| Injuries | 15 to 34 | 2765 | 3076 | 3175 | 1312 | 1542 | 1665 | 4077 | 4618 | 4840 |
| 35 to 64 | 2822 | 3210 | 3324 | 1008 | 1214 | 1329 | 3830 | 4424 | 4653 | |
| 65+ | 1651 | 1925 | 2008 | 1008 | 1230 | 1358 | 2659 | 3155 | 3366 | |
| Subtotal | 7237 | 8210 | 8508 | 3328 | 3986 | 4352 | 10,565 | 12,196 | 12,860 | |
| Infectious diseases | 15 to 34 | 164 | 195 | 204 | 108 | 136 | 153 | 272 | 331 | 357 |
| 35 to 64 | 430 | 507 | 531 | 209 | 255 | 282 | 639 | 762 | 813 | |
| 65+ | 922 | 1075 | 1122 | 416 | 502 | 551 | 1338 | 1577 | 1673 | |
| Subtotal | 1516 | 1777 | 1857 | 733 | 894 | 987 | 2249 | 2671 | 2844 | |
| Type 2 diabetes | 15 to 34 | 2 | 2 | 2 | −11 | −12 | −12 | −9 | −10 | −10 |
| 35 to 64 | 26 | 30 | 31 | −123 | − 128 | − 130 | −97 | −98 | −99 | |
| 65+ | 30 | 33 | 34 | − 297 | −313 | −321 | − 267 | − 280 | −287 | |
| Subtotal | 58 | 65 | 68 | −431 | − 453 | − 463 | −373 | −388 | − 395 | |
| Total for all conditions | 15 to 34 | 6031 | 6857 | 7089 | 3459 | 4190 | 4545 | 9490 | 11,047 | 11,634 |
| 35 to 64 | 19,364 | 22,807 | 23,727 | 5852 | 7520 | 8331 | 25,216 | 30,327 | 32,058 | |
| 65+ | 5522 | 7251 | 7753 | − 2511 | − 1714 | − 1248 | 3011 | 5537 | 6505 | |
| Subtotal | 30,917 | 36,915 | 38,569 | 6801 | 9997 | 11,628 | 37,718 | 46,912 | 50,197 | |
NB: rows and columns may not add exactly due to rounding. AAH = alcohol-attributable hospital stays. Scen1 = predicted increase in hospital stays in Scenario 1. Scen2 = predicted increase in hospital stays in Scenario 2
Table 10.
Estimated number of alcohol-attributable deaths in Sweden under Scenarios 1 and 2, by age group and gender for sub-groups of conditions with or without some assumed protection from alcohol
| Male | Female | Total | ||||||||
|---|---|---|---|---|---|---|---|---|---|---|
| AAD | Scen1 | Scen2 | AAD | Scen1 | Scen2 | AAD | Scen1 | Scen2 | ||
| Sub-total for conditions with no protection | 15 to 34 | 178 | 206 | 219 | 35 | 41 | 44 | 213 | 247 | 263 |
| 35 to 64 | 603 | 765 | 861 | 214 | 259 | 285 | 817 | 1024 | 1146 | |
| 65+ | 749 | 908 | 999 | 303 | 361 | 393 | 1052 | 1269 | 1392 | |
| Subtotal | 1531 | 1878 | 2078 | 550 | 661 | 721 | 2081 | 2539 | 2799 | |
| Sub-total for conditions with some protection | 15 to 34 | 4 | 5 | 6 | 1 | 2 | 3 | 5 | 7 | 9 |
| 35 to 64 | 74 | 144 | 186 | 7 | 25 | 38 | 81 | 169 | 224 | |
| 65+ | −201 | −69 | 24 | − 471 | − 394 | −335 | − 672 | −463 | − 311 | |
| Subtotal | −122 | 80 | 216 | −463 | −366 | − 295 | − 585 | − 286 | −79 | |
| Net total deaths for all conditions | 15 to 34 | 182 | 211 | 225 | 36 | 44 | 48 | 218 | 255 | 273 |
| 35 to 64 | 676 | 909 | 1048 | 219 | 284 | 323 | 895 | 1193 | 1371 | |
| 65+ | 549 | 839 | 1022 | −168 | −34 | 56 | 381 | 805 | 1078 | |
| Subtotal | 1408 | 1958 | 2294 | 87 | 294 | 427 | 1495 | 2252 | 2721 | |
NB: rows and columns may not add exactly due to rounding. AAD = alcohol-attributable deaths. Scen1 = predicted increase in hospital stays in Scenario 1. Scen2 = predicted increase in hospital stays in Scenario 2
Table 11.
Estimated number of alcohol-attributable hospital stays in Sweden under Scenarios 1 and 2, by age group and gender for sub-groups of conditions with or without some assumed protection from alcohol
| Male | Female | Total | ||||||||
|---|---|---|---|---|---|---|---|---|---|---|
| AAH | Scen1 | Scen2 | AAH | Scen1 | Scen2 | AAH | Scen1 | Scen2 | ||
| Sub-total for conditions with no protection | 15 to 34 | 5891 | 6692 | 6915 | 3438 | 4148 | 4492 | 9329 | 10,840 | 11,407 |
| 35 to 64 | 18,998 | 22,051 | 22,850 | 6867 | 8330 | 9010 | 25,865 | 30,381 | 31,860 | |
| 65+ | 7789 | 9042 | 9394 | 3044 | 3671 | 4005 | 10,833 | 12,713 | 13,399 | |
| Subtotal | 32,677 | 37,783 | 39,160 | 13,349 | 16,150 | 17,508 | 46,026 | 53,933 | 56,668 | |
| Sub-total for conditions with some protection | 15 to 34 | 141 | 166 | 174 | 22 | 41 | 53 | 163 | 207 | 227 |
| 35 to 64 | 366 | 758 | 876 | − 1014 | −810 | −680 | − 648 | −52 | 196 | |
| 65+ | − 2266 | − 1792 | − 1642 | − 5555 | − 5385 | − 5253 | − 7821 | − 7177 | − 6895 | |
| Subtotal | − 1760 | − 868 | − 591 | − 6548 | − 6154 | − 5880 | − 8308 | − 7022 | − 6471 | |
| Net total stays for all conditions | 15 to 34 | 6031 | 6857 | 7089 | 3459 | 4190 | 4545 | 9490 | 11,047 | 11,634 |
| 35 to 64 | 19,364 | 22,807 | 23,727 | 5852 | 7520 | 8331 | 25,216 | 30,327 | 32,058 | |
| 65+ | 5522 | 7251 | 7753 | −2511 | −1714 | −1248 | 3011 | 5537 | 6505 | |
| Subtotal | 30,917 | 36,915 | 38,569 | 6801 | 9997 | 11,628 | 37,718 | 46,912 | 50,197 | |
NB: rows and columns may not add exactly due to rounding. AAH = alcohol-attributable hospital stays. Scen1 = predicted increase in hospital stays in Scenario 1. Scen2 = predicted increase in hospital stays in Scenario 2
Authors’ contributions
All authors have contributed substantively to the design, execution and writing up of the present study. All authors have read and approved this final draft. In terms of specific contributions, AS was responsible for applying alcohol attributable fractions derived from InterMAHP to Swedish mortality and morbidity data. SA and MR identified and accessed necessary Swedish survey, mortality and morbidity data. TN and MR analysed data on cross-border sales and conducted the ARIMA analyses. TS and TC co-chaired the project meetings, in person and by teleconference. JH provided high-level advice on the design and implementation of the modelling aspects of the study and its interpretation. JG, SA, MR and TN provided contextual analysis and data on various Swedish monopolies. They also prepared and approved details of the Swedish policy scenarios should Systembolaget be privatised. HH provided advice on international experiences with alcohol privatisation. TS and CA quantified the impacts of policy scenarios on per capita consumption. CA developed the method for estimating changes in rates of binge drinking for changes in per capita consumption. He also led the analysis estimating confidence intervals around estimates of changes in per capita consumption. PM provided data from the Finnish experience of relaxing controls on its alcohol monopoly.
Ethics approval and consent to participate
No new studies were conducted involving collection of data from individual people in order to conduct this modelling study. We relied entirely on administrative datasets, mostly already in the public domain, and on the published results of other studies. The BC government’s Liquor Distribution Branch provided data on outlet density and liquor sales by local areas of British Columbia which were used to model the effects of extreme changes to the density of liquor outlets on sales.
Consent for publication
There are no restrictions on the authors ability to publish this study. We received advance written consent from the funding body to prepare independent reports for publication in peer-reviewed journals. No individual-level data were used or reported in this study.
Competing interests
A written statement was agreed between the co-authors and funding body at the outset of the project such that the implementation of the research from beginning to end would be arm’s-length and no Systembolaget staff would be involved in project meetings. A copy of the final report would be provided for comment on accuracy only in relation to descriptions of the organisation. An unconditional approval was also given for independent publication of any findings with the requirement only of being given a copy of a paper for information prior to its publication.
Publisher’s Note
Springer Nature remains neutral with regard to jurisdictional claims in published maps and institutional affiliations.
Contributor Information
Tim Stockwell, Email: timstock@uvic.ca.
Adam Sherk, Email: asherk@uvic.ca.
Thor Norström, Email: thor.norstrom@sofi.su.se.
Colin Angus, Email: c.r.angus@sheffield.ac.uk.
Mats Ramstedt, Email: mats.ramstedt@can.se.
Sven Andréasson, Email: sven.andreasson@sll.se.
Tanya Chikritzhs, Email: T.N.Chikritzhs@curtin.edu.au.
Johanna Gripenberg, Email: Johanna.Gripenberg@ki.se.
Harold Holder, Email: holder@prev.org.
John Holmes, Email: john.holmes@sheffield.ac.uk.
Pia Mäkelä, Email: pia.makela@thl.fi.
References
- 1.National Alcohol Beverage Control Association . the control systems: national alcohol beverage control association. 2016. [Google Scholar]
- 2.Canadian Association of Liquor Jurisdictions. CALJ Members; 2016.
- 3.Stockwell T, Zhao JH, Macdonald S, Vallance K, Gruenewald P, Ponicki W, et al. Impact on alcohol-related mortality of a rapid rise in the density of private liquor outlets in British Columbia: a local area multi-level analysis. Addiction. 2011;106:768–776. doi: 10.1111/j.1360-0443.2010.03331.x. [DOI] [PubMed] [Google Scholar]
- 4.Holder H, Kuhlhorn E, Nordlund S, Österberg E, Romelsjo A, Ugland T. European integration and Nordic alcohol policies. Aldershot: Ashgate Publishing Ltd; 1998. [Google Scholar]
- 5.Elsewhere NF. Finland to free up strict drinking laws. UK: BBC; 2016. [Google Scholar]
- 6.Hassell M. Don’t raise your pint of beer to Ontario’s liquor law just yet: globe and mail. 2015. [Google Scholar]
- 7.Justice BMO. Review of BC Liquor Laws: Final Report. 2014. [Google Scholar]
- 8.Norström T, Miller T, Holder H, Österberg E, Ramstedt M, Rossow I, et al. Potential consequences of replacing a retail alcohol monopoly with a private licence system: results from Sweden. Addiction. 2010;105:2113–2119. doi: 10.1111/j.1360-0443.2010.03091.x. [DOI] [PubMed] [Google Scholar]
- 9.Holder H, Agardh E, Hogberg P, Miller T, Norström T, Österberg E, et al. Alcohol monopoly and public health: potential effects of privatization of the Swedish alcohol retail monopoly: Swedish National Institute of public health. 2008. [Google Scholar]
- 10.Håkan LP, Trolldal B. Alkoholkonsumtionen i Sverige 2015: Centralförbundet för alkoholoch narkotikaupplysning. 2016. [Google Scholar]
- 11.Trolldal B. Alcohol consumption in Sweden 2015. CAN-report 160, Stockholm: Central Association for Alcohol and Drugs; 2015.
- 12.Hahn RA, Middleton JC, Elder R, Brewer R, Fielding J, Naimi TS, et al. Effects of alcohol retail privatization on excessive alcohol consumption and related harms. Am J Prev Med. 2012;42:418–427. doi: 10.1016/j.amepre.2012.01.002. [DOI] [PubMed] [Google Scholar]
- 13.Trolldal B. An investigation of the effect of privatization of retail sales of alcohol on consumption and traffic accidents in Alberta, Canada. Addiction. 2005;100:662–671. doi: 10.1111/j.1360-0443.2005.01049.x. [DOI] [PubMed] [Google Scholar]
- 14.Stockwell T, Zhao J, Macdonald S, Pakula B, Gruenewald P, Holder H. Changes in per capita alcohol sales during the partial privatization of British Columbia's retail alcohol monopoly 2003-2008: a multi-level local area analysis. Addiction. 2009;104:1827–1836. doi: 10.1111/j.1360-0443.2009.02658.x. [DOI] [PubMed] [Google Scholar]
- 15.Stockwell T, Zhao J, Martin G, et al. Minimum alcohol prices and outlet densities in British Columbia, Canada: estimated impacts on alcohol attributable hospitalisations. Am J Public Health. 2013:e1–7. [DOI] [PMC free article] [PubMed]
- 16.Kehoe T, Gmel G, Shield KD, Gmel G, Rehm J. Determining the best population-level alcohol consumption model and its impact on estimates of alcohol-attributable harms. Popul Health Metrics. 2012;10:6. doi: 10.1186/1478-7954-10-6. [DOI] [PMC free article] [PubMed] [Google Scholar]
- 17.Sherk A, Stockwell T, Rehm J, Dorocicz J, Sheild K. The international model of alcohol harms and policies (InterMAHP). Version 1.0: December 2017. Canadian Institute for Substance Use Research. Victoria, BC: University of Victoria; 2017. [Google Scholar]
- 18.Sherk A., Stockwell T., Rehm J., Dorocicz J., Shield K. The international model of alcohol harms and policies (InterMAHP): A comprehensive guide to the estimation of alcohol-attributable morbidity and morality. Version 1.0: December 2017. Canadian Institute for Substance Use Research, University of Victoria. Victoria, BC Canada. https://www.uvic.ca/research/centres/cisur/projects/intermahp/index.php; 2017.
- 19.Babor TF. Effectiveness of Strategies and Interventions to Reduce Alcohol-Related Harm: An Update, Alcoholism-Clinical and Experimental Research 2010: 34: 17a-17a.
- 20.Giesbrecht N, Wettlaufer A, Simpson S, April N, Asbridge M, Cukier S, et al. Strategies to reduce alcohol-related harms and costs in Canada: a comparison of provincial policies: Centre for Addiction and Mental Health. 2013. [Google Scholar]
- 21.Stockwell T., Vallance K., Martin G., Macdonald S., Ivsins A., Chow C. et al. The price of getting high, stoned and drunk in BC: A comparison of minimum prices for alcohol and other psychoactive substances. CARBC Statistical Bulletin #7, Victoria, British Columbia: University of Victoria. Available from URL: http://www.carbc.ca/Portals/0/PropertyAgent/2111/Files/385/CARBC_Bulletin7.pdf. Accessible 9 May 2011; 2010.
- 22.Kerr W. C., Williams E., Greenfield T. K. Analysis of Price Changes in Washington Following the 2012 Liquor Privatization, Alcohol Alcohol 2015: 50: 654–660. [DOI] [PMC free article] [PubMed]
- 23.Babor TF. Effectiveness of Strategies and Interventions to Reduce Alcohol-Related Harm: An Update. Alcoholism-Clinical and Experimental Research. 2010;34:17a. [Google Scholar]
- 24.Saffer H, Dave D. Alcohol consumption and alcohol advertising bans. Appl Econ. 2002;34.
- 25.Sherk A, Stockwell T, Chikritzhs T, Andréasson S, Angus C, Gripenberg J, et al. Alcohol consumption and the physical availability of take-away alcohol: systematic reviews and meta-analyses of the days and hours of sale and outlet density. J Stud Alcohol Drugs. 2018;79:58–67. doi: 10.15288/jsad.2018.79.58. [DOI] [PubMed] [Google Scholar]
- 26.Trolldal B. Availability and sales of alcohol in four Canadian provinces: a time-series analysis. Contemporary Drug Problems. 2005;32:343–372. doi: 10.1177/009145090503200302. [DOI] [Google Scholar]
- 27.Xie X, Mann RE, Smart RG. The direct and indirect relationships between alcohol prevention measures and alcoholic liver cirrhosis mortality. J Stud Alcohol. 2000;61:499–506. doi: 10.15288/jsa.2000.61.499. [DOI] [PubMed] [Google Scholar]
- 28.Brenner AB, Borrell LN, Barrientos-Gutierrez T, Diez Roux AV. Longitudinal associations of neighborhood socioeconomic characteristics and alcohol availability on drinking: results from the multi-ethnic study of atherosclerosis (MESA) Soc Sci Med. 2015;145:17–25. doi: 10.1016/j.socscimed.2015.09.030. [DOI] [PMC free article] [PubMed] [Google Scholar]
- 29.Gronqvist H, Niknami S. Alcohol availability and crime: lessons from liberalized weekend sales restrictions. J Urban Econ. 2014;81:77–84. doi: 10.1016/j.jue.2014.03.001. [DOI] [Google Scholar]
- 30.Yoruk BY. Legalization of Sunday alcohol sales and alcohol consumption in the United States. Addiction. 2014;109:55–61. doi: 10.1111/add.12358. [DOI] [PMC free article] [PubMed] [Google Scholar]
- 31.Carpenter CS, Eisenberg D. Effects of Sunday sales restrictions on overall and day-specific alcohol consumption: evidence from Canada. J Stud Alcohol Drugs. 2009;70:126–133. doi: 10.15288/jsad.2009.70.126. [DOI] [PubMed] [Google Scholar]
- 32.Stehr M. The effect of Sunday sales bans and excise taxes on drinking and cross-border shopping for alcoholic beverages. Natl Tax J. 2007;60:85–105. doi: 10.17310/ntj.2007.1.05. [DOI] [Google Scholar]
- 33.Norstrom T, Skog OJ. Saturday opening of alcohol retail shops in Sweden: an experiment in two phases. Addiction. 2005;100:767–776. doi: 10.1111/j.1360-0443.2005.01068.x. [DOI] [PubMed] [Google Scholar]
- 34.Norstrom T, Skog OJ. Saturday opening of alcohol retail shops in Sweden: an impact analysis. J Stud Alcohol. 2003;64:393–401. doi: 10.15288/jsa.2003.64.393. [DOI] [PubMed] [Google Scholar]
- 35.Kolosnitsyna M, Sitdikov M, Khorkina N. Availability restrictions and alcohol consumption: A case of restricted hours of alcohol sales in Russian regions. Int J Alcohol Drug Res. 2014;3(3):193–201.
- 36.Norström T. The price elasticity for alcohol in Sweden 1984–2003. 2005. [Google Scholar]
- 37.Stockwell T, Zhao J, Giesbrecht N, et al. The raising of minimum alcohol prices in Saskatchewan, Canada: impacts on consumption and implications for public health. Am J Public Health. 2012;102:e103–e110. doi: 10.2105/AJPH.2012.301094. [DOI] [PMC free article] [PubMed] [Google Scholar]
- 38.Norström T, Ramstedt M. Alkoholrelaterade problem – spelar det någon roll varifrån alkoholen kommer? 2008. [Google Scholar]
- 39.Lim SS, Vos T, Flaxman AD, Danaei G, Shibuya K, Adair-Rohani H, et al. A comparative risk assessment of burden of disease and injury attributable to 67 risk factors and risk factor clusters in 21 regions, 1990-2010: a systematic analysis for the global burden of disease study 2010. Lancet. 2012;380:2224–2260. doi: 10.1016/S0140-6736(12)61766-8. [DOI] [PMC free article] [PubMed] [Google Scholar]
- 40.Roerecke M, Rehm J. The cardioprotective association of average alcohol consumption and ischaemic heart disease: a systematic review and meta-analysis. Addiction. 2012;107:1246–1260. doi: 10.1111/j.1360-0443.2012.03780.x. [DOI] [PMC free article] [PubMed] [Google Scholar]
- 41.Norström T., Ramstedt M. The link between per capita alcohol consumption and alcohol-related harm in Sweden 1987–2015, J Stud Alcohol Drugs in press. [PubMed]
- 42.Norström T, Rossow I. Alcohol consumption as a risk factor for suicidal behavior: a systematic review of associations at the individual and at the population level. Archives of Suicide Research. 2016;20:489–506. doi: 10.1080/13811118.2016.1158678. [DOI] [PubMed] [Google Scholar]
- 43.Norstrom T., Ramstedt M. The link between per capita alcohol consumption and alcohol-related harm in Sweden 1987–2015, J Stud Alcohol Drugs 2018. [PubMed]
- 44.Box GEP, Jenkins GM, Reinsel GC. Time series analysis: forecasting and control. New York: Wiley; 2008. [Google Scholar]
- 45.Banerjee A, Dolado J, Galbraith J, Hendry D. Co-integration, error correction, and the econometric analysis of non-stationary data. United Kingdom: OUP Catalogue; 1993.
- 46.Ramstedt M, Sundin E, Landberg J, Raninen J. ANDT-bruket och dess negativa konsekvenser i den svenska befolkningen 2013 – en studie med fokus på missbruk och beroende samt problem för andra än brukaren relaterat till alkohol, narkotika, dopning och tobak. STAD-rapport nr 55.; 2014.
- 47.Kehoe T, Gmel G, Shield KD, Gmel G, Rehm J. Determining the best population-level alcohol consumption model and its impact on estimates of alcohol-attributable harms. Popul Health Metrics. 2012;10:1. doi: 10.1186/1478-7954-10-6. [DOI] [PMC free article] [PubMed] [Google Scholar]
- 48.Stockwell T., Pauly B., Chow C., Erickson R., Krysowaty B., Roemer A. et al. Does managing the consumption of people with severe alcohol dependence reduce harm? A comparison of participants in six Canadian managed alcohol programs with locally recruited controls. Paper presented at 44th Annual Symposium of the Kettil Bruun Society for Social and Epidemiological Research on Alcohol, Stockholm, Sweden; 2016. [DOI] [PubMed]
- 49.Rehm J, Baliunas D, Borges GLG, Graham K, Irving H, Kehoe T, et al. The relation between different dimensions of alcohol consumption and burden of disease: an overview. Addiction. 2010;105:817–843. doi: 10.1111/j.1360-0443.2010.02899.x. [DOI] [PMC free article] [PubMed] [Google Scholar]
- 50.Meier PS, Holmes J, Angus C, Ally AK, Meng Y, Brennan A. Estimated effects of different alcohol taxation and Price policies on health inequalities: a mathematical modelling study. PLoS Med. 2016;13:e1001963. doi: 10.1371/journal.pmed.1001963. [DOI] [PMC free article] [PubMed] [Google Scholar]
- 51.SAS Institute . SAS/STAT 9.3 user's guide. SAS Institute Inc: Cary, NC; 2011. [Google Scholar]
- 52.Chikritzhs T, Stockwell T, Naimi T, Andreasson S, Dangardt F, Liang W. Has the leaning tower of presumed health benefits from moderate alcohol use finally collapsed? Addiction. 2015;110:726–727. doi: 10.1111/add.12828. [DOI] [PubMed] [Google Scholar]
- 53.Ponicki WR, Gruenewald PJ, LaScala EA. Joint impacts of minimum legal drinking age and beer taxes on US youth traffic fatalities, 1975 to 2001. Alcoholism. 2007;31:804–813. doi: 10.1111/j.1530-0277.2007.00363.x. [DOI] [PubMed] [Google Scholar]
- 54.Hobday M, Chikritzhs T, Liang W, Meuleners L. The effect of alcohol outlets, sales and trading hours on alcohol-related injuries presenting at emergency departments in Perth, Australia, from 2002 to 2010. Addiction. 2015;110:1901–1909. doi: 10.1111/add.13063. [DOI] [PubMed] [Google Scholar]
- 55.Knott C, Bell S, Britton A. Alcohol consumption and the risk of type 2 diabetes: a systematic review and dose-response meta-analysis of more than 1.9 million individuals from 38 observational studies. Diabetes Care. 2015;38:1804–1812. doi: 10.2337/dc15-0710. [DOI] [PubMed] [Google Scholar]
- 56.Gornall J. Under the influence. BMJ : British Medical Journal. 2014;348.
- 57.Stockwell T, Zhao J, Panwar S, Roemer A, Naimi T, Chikritzhs T. Do “moderate” drinkers have reduced mortality risk? A systematic review and meta-analysis of alcohol consumption and all-cause mortality. J Stud Alcohol Drugs. 2016;77:185–198. doi: 10.15288/jsad.2016.77.185. [DOI] [PMC free article] [PubMed] [Google Scholar]
Associated Data
This section collects any data citations, data availability statements, or supplementary materials included in this article.
Data Availability Statement
We have utilized publicly available datasets regarding hospitalizations, deaths, crime events and economic costs identified in them Methods section of the manuscript. We have also relied on the results of multiple published systematic reviews and meta-analyses including those available on the Internet resource, the International Model of Alcohol Harms and Policies (https://www.uvic.ca/research/centres/cisur/projects/intermahp/index.php).