Abstract
Objectives
It is challenging to separate peritumoral fibrosis from fibrosis due to chronic liver disease in mass-directed liver biopsies. We evaluated the distance that peritumoral fibrosis extends from metastatic colorectal adenocarcinoma in liver.
Methods
Peritumoral and distant uninvolved liver trichrome stains from 25 cases were analyzed using digital image analysis. Fibrosis was quantitated at concentric intervals from each tumor and in uninvolved liver.
Results
There was a 3.9 fold (range 0.9-18.6) median increase in fibrosis in the first 0.5 mm of peritumoral liver compared to distant liver. Fibrosis levels returned to baseline at median 2.5 mm (interquartile range 1.5-5.0 mm) from tumor.
Conclusions
Fibrosis is markedly increased in peritumoral liver. Fibrosis levels returned to baseline by 5 mm from tumor in approximately 75% of cases. Pathologists should be cautious of fibrosis in mass-directed liver biopsies without at least 5 mm of liver tissue distal to the mass.
Keywords: Liver, Fibrosis, Peritumoral fibrosis, Digital image analysis, Metastatic carcinoma
Pathologists routinely evaluate background liver on mass-directed biopsies and small wedge resections for metastatic tumor in order to inform chemotherapeutic decisions. Unfortunately, peritumoral reaction creates a common and frustrating clinical problem because it can locally enhance liver fibrosis and pathologists often have little confidence in their interpretation of whether the fibrosis is due to a peritumoral reaction or chronic liver disease. While it is generally known to avoid interpreting fibrosis adjacent to tumors, the distance from a tumor at which fibrosis returns to background levels is not known.
Metastasis, most commonly to the liver, is seen in approximately 50% of colorectal cancer cases.1 Among these cases, approximately 20% are resectable with 50% to 60% 5-year survival and 20% cure.1-3 Studies have shown that a fibrotic capsule is seen in nearly 40% of liver metastases and that this capsule formation was associated with increased survival.4 These capsules were found to heavily stain with Masson trichrome and also immunohistochemically for smooth muscle actin, suggesting that it is predominantly composed of collagen produced by activated myofibroblasts.4 In hepatocellular carcinoma arising in patients with chronic hepatitis B virus infection, one study found that tumor effect on multiple histopathologic parameters as determined by a pathologist, including fibrosis, were most pronounced within 10 mm of the tumor and had largely disappeared beyond 20 mm.5 To our knowledge, no study has defined the distance required for nonneoplastic liver to be considered distant in the setting of metastatic adenocarcinoma.
Digital image analysis (DIA) is a useful tool to objectively and systematically evaluate quantitative parameters on scanned tissue sections. Prior studies have attempted to use DIA to measure liver fibrosis stage, predominantly in the setting of chronic hepatitis C virus (HCV) infection. An early study, from 2000, using DIA to measure the collagen proportionate area (CPA) with a trichrome special stain in subjects with chronic HCV infection, found that while CPA was correlated with Ishak stage by a pathologist in cases with high scores (early bridging fibrosis to established cirrhosis), no correlation was found in biopsies with low scores (normal to early bridging fibrosis).6 However, subsequent studies have found that CPA using DIA is highly reproducible and correlates well with Ishak stages across all levels of fibrosis.7-9 Additionally, CPA has been shown to be associated with clinical measures and outcomes. One study found that CPA progression rate was a better predictor of clinical decompensation than progression by Ishak stage in subjects with chronic HCV.10 Using logistic regression analysis, CPA, not Ishak staging, was shown to be independently associated with hepatic venous pressure gradient.8 Lastly, CPA was found to predict clinical outcome of recurrent HCV in subjects 1 year after liver transplantation.11
The emergence of DIA as a powerful tool to objectively and efficiently measure liver fibrosis provides an opportunity to study fibrosis levels in a multitude of clinical settings. In the present study, we aim to determine the magnitude of adjacent fibrotic reaction and the extent of the increased fibrosis in the setting of metastatic adenocarcinoma.
Materials and Methods
The study included 25 liver wedge resection cases for metastatic colorectal adenocarcinoma from The Johns Hopkins Hospital in-house surgical pathology archives, collected between July 2013 and March 2016. Cases were selected based on review of the gross description to select cases with a section containing metastatic adenocarcinoma with sufficient adjacent nonneoplastic liver, as well as a separate section with distant nonneoplastic liver. One case had a history of chronic HCV infection and another had nonalcoholic fatty liver disease, but neither had a history of significant fibrosis. For each case, to estimate fibrosis the two sections (4 μm thick) were stained with a Masson trichrome (Trichrome Stain Kit; Newcomer Supply, Middleton, WI) in consecutive batches using the standard techniques.
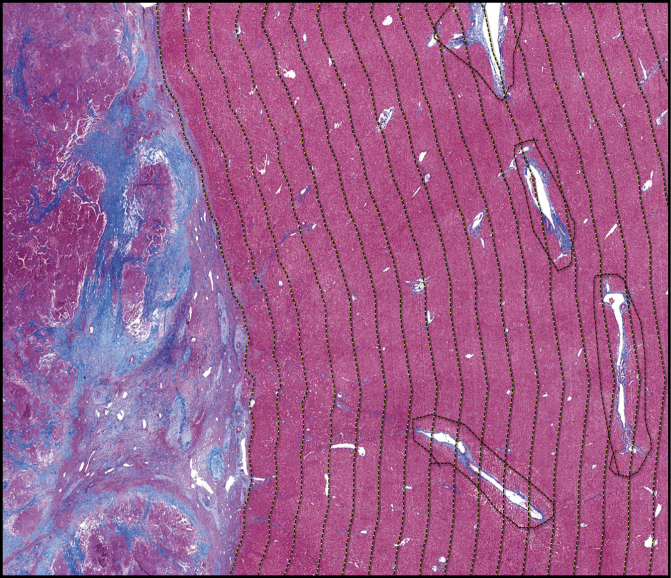
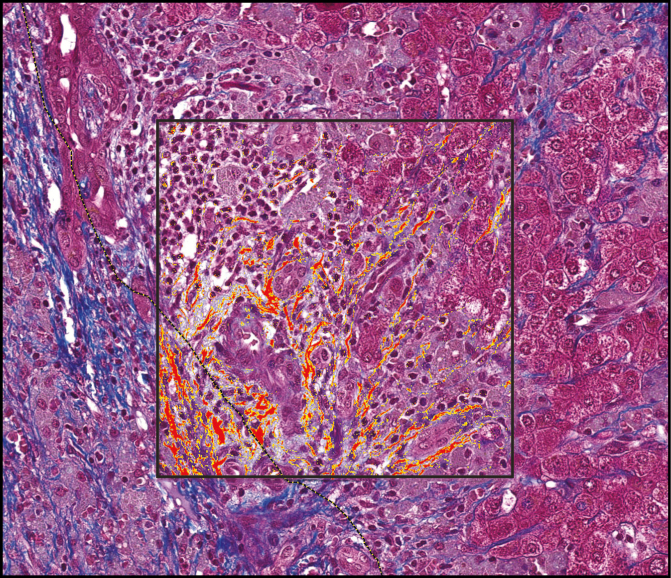
Each slide was digitally scanned using a Hamamatsu digital slide scanner (Hamamatsu, Japan). Using the HALO DIA program (Indica Labs, Corrales, NM), the edge of the tumor was manually annotated. Large areas with physiologic collagen deposition, such as subcapsular liver parenchyma, large portal tracts, and venular areas, were manually annotated and excluded from the analysis. Concentric intervals of 0.5 mm were generated around the tumor to assess adjacent liver up to the edge of the specimen Image 1. Percentage of area with fibrosis in the peritumoral region was estimated using the HALO area quantification algorithm and compared to background liver Image 2. The amount of peritumoral fibrosis was considered to have returned to baseline when it was within 1% of the distant nonneoplastic liver. The distant nonneoplastic liver was evaluated by a liver pathologist (R.A.A) to determine the combined vascular injury (CVI) score (0-13), a measure of vascular injury that was described in detail and associated with preoperative chemotherapy by Ryan et al in 2010.12
Image 1 .
Annotations of peritumoral liver. Masson trichrome stain of section (×1) with tumor (left) and peritumoral tissue (right). The tumor border is manually annotated (leftmost dashed line) with 0.5-mm concentric intervals (yellow dashed lines) created in an automated fashion. Large vascular and portal spaces are manually annotated and excluded from the analysis (red dashed lines).
Image 2 .
Algorithm to measure percent staining. Masson trichrome stain of peritumoral tissue (×20) with inset box showing yellow and red highlighted areas of positive staining used to calculate the proportionate area of staining. Dashed line indicates the tumor edge.
All statistical analysis was conducted using the statistical programming language R (R Foundation, Vienna, Austria). The Mann-Whitney U test was used to test for differences in the increase in fibrosis directly adjacent to tumor (0-0.5 mm) and the distance at which fibrosis levels returned to background based on tumor size and tumor necrosis. Nonparametric Spearman coefficients were used to test for correlation.
Results
The mean age at resection was 57 years (range, 39 to 77) Table 1 . The majority (14/25, 56%) of the cases were from male patients. They were also mostly white (20/25, 80%). Twenty-three (92%) had received chemotherapy prior to resection. The mean tumor size was 2.0 cm (range 0.3-4.5 cm). The mean percent tumor necrosis was 33% (range 0%-90%).
Table 1 .
Demographic and Clinical Information (n = 25)
| Characteristic | Value |
|---|---|
| Age at resection, y, mean (range) | 57 (39-77) |
| Sex, No. (%) | |
| Male | 14 (56) |
| Female | 11 (44) |
| Race, No. (%) | |
| White | 20 (80) |
| Black | 2 (8) |
| Asian | 1 (4) |
| Other/unknown | 2 (8) |
| Tumor size, cm, mean (range) | 2.0 (0.3-4.5) |
| Tumor necrosis, %, mean (range) | 33 (0-90) |
The median percent area with Masson trichrome staining in the distant nonneoplastic liver was 1.4% (range 0.4%-3.0%). The fibrosis in the nonneoplastic liver was not correlated with age at resection (P = .84) or associated with sex (P = .81). We also did not find evidence of an effect of tumor characteristics on the fibrosis in the distant nonneoplastic liver as neither tumor size (P = .98) nor percent tumor necrosis (P = .85) were associated with the percentage of area with Masson trichrome staining. The mean background staining was higher in the treated cases (1.5%) than in the untreated cases (1.1%), but this finding needs to be further investigated as there were only two untreated cases. There was one case with a CVI score of 3 that had 1.4% staining in the distant nonneoplastic liver. The two untreated cases both had CVI scores of 0. The median background staining was slightly higher in cases with a CVI score of at least 1 (n = 10, 1.4%) than in those with a CVI score of 0 (n = 15, 1.2%), but this difference did not reach statistical significance (P = .20).
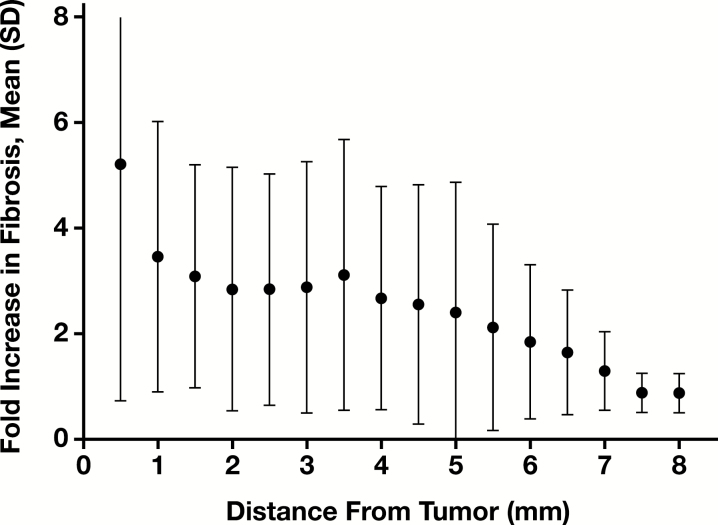
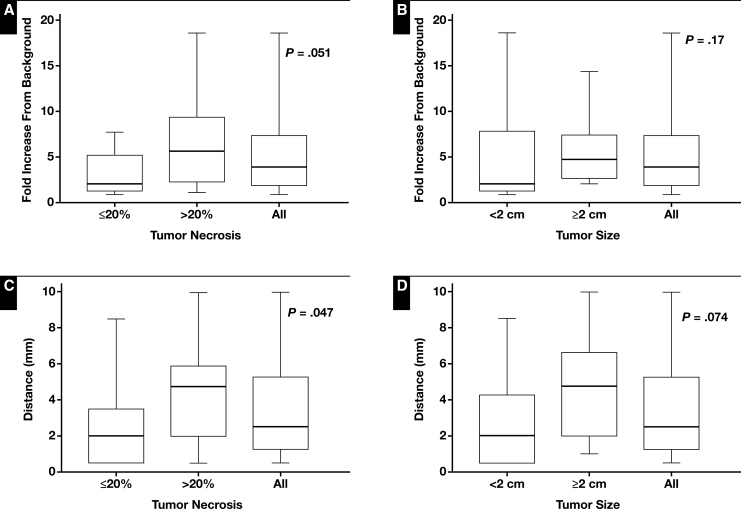
In the nonneoplastic liver immediately adjacent to adenocarcinoma (the first 0.5 mm of peritumoral area), there was a 3.9 fold (range 0.9-18.6) median increase in fibrosis compared to the distant nonneoplastic liver Figure 1. The fold increase in area stained compared to the distant nonneoplastic liver was not correlated with age (P = .73). The fold increase was nearly statistically significantly increased in tumors with greater than 20% necrosis (n = 14, median 5.7) compared to those with less than or equal to 20% necrosis (n = 11, median 2.1, P = .051) Figure 2A. The fold increase in the area stained was increased in tumors greater than or equal to 2 cm (n = 12, median 4.7) compared to those less than 2 cm (n = 13, median 2.1), but this increase did not reach statistical significance (P = .17) Figure 2B . The average fold increase was similar in the treated (5.2) and untreated (4.9) cases.
Figure 1 .
Fold increase in fibrosis in peritumoral concentric bands. Mean and standard deviation of the fold increase in proportionate area stained in samples across 0.5-mm concentric intervals extending away from the tumor.
Figure 2 .
Association between peritumoral fibrosis and tumor size and percent necrosis. Box and whisker plots of the fold increase in fibrosis compared to background levels in immediately adjacent peritumoral tissue in subjects separated by (A) median percent necrosis and (B) median tumor size. Box and whisker plots of the distance required to return to background levels in subjects separated by (C) median percent necrosis and (D) median tumor size.
The median distance to return to baseline fibrosis was 2.5 mm (interquartile range 1.5-5.1). Three cases did not return to baseline at the furthest extent measurable (5.5, 8.5, and 10 mm). The median distance to return to normal was not correlated with age (P = .28). The distance to return to baseline fibrosis was significantly increased in tumors with greater than 20% necrosis (median 4.8 mm) compared to those with less than or equal to 20% necrosis (median 2.0 mm, P = .047) Figure 2C . The distance to return to baseline fibrosis was increased in tumors greater than or equal to 2 cm in size (median distance, 4.75 mm) compared to those less than 2 cm in size (median distance, 2.0 mm), but this increase did not reach statistical significance (P = .074) Figure 2D . It is worth noting that one of the untreated cases did not return to baseline at 8.5 mm from the tumor.
Discussion
While attempting to assess the nonneoplastic liver, conventional wisdom dictates that pathologists should be careful commenting on fibrosis in peritumoral liver in the setting of metastatic disease as peritumoral fibrosis cannot be histologically distinguished from fibrosis due to chronic liver disease. No known guidelines have been established on how much distance from the tumor is required to make a valid assessment of fibrosis levels. Our study used DIA to objectively determine that 75% of the cases returned to baseline levels by 5 mm away from the tumor and all but one case had returned to baseline when we were able to measure out to 10 mm. Additionally, we determined that tumor necrosis was associated with a longer distance required to return to baseline levels.
DIA is a powerful research tool to objectively measure the percentage of area with fibrosis in the liver. In the present study this tool allowed us to systematically compare the percentage of area staining in concentric intervals extending away from metastatic adenocarcinoma. Our findings that, as expected, fibrosis levels decreased as these intervals proceed away from the lesion and that fibrosis was associated with tumor necrosis support the validity of this tool. However, DIA is currently not used clinically in interpreting liver fibrosis. We conducted our study comparing paired sections that were stained on the same run and have not tested whether the algorithm is generalizable to stains performed at other labs or across runs. While CPA has previously been shown to correlate well with Ishak fibrosis staging in the setting of chronic HCV,7-9 it does not interpret the pattern of fibrosis (portal vs lobular) or determine whether there is bridge or nodule formation.
While our study is limited to colorectal primaries, this is the most commonly resected metastatic neoplasm on our surgical pathology service. Future studies will be necessary to determine if these findings are generalizable to other metastatic tumors that are biopsied and resected from the liver, such as carcinomas from other sites, neuroendocrine tumors, and mesenchymal tumors. Our findings may not be applicable to very large metastases as the upper range of tumors included in this study only extend up to 4.5 cm, but the range of tumor sizes included in this study are likely representative of resections because we did not select cases based on tumor size. The patient population also did not include any cases with clinically significant fibrosis in the background liver, but again we did not select patients based on background liver function. This may be representative of the patient population considered suitable for resection. Also, metastases to cirrhotic/fibrotic livers may be relatively uncommon, as studies have found that patients with chronic liver disease have a lower incidence of hepatic metastases from colorectal adenocarcinoma.13-15 Future studies in resections from patients with liver disease will be necessary to determine if it has an effect on peritumoral fibrosis. While we attempted to exclude large areas of physiologic collagen (eg, vasculature or bile ducts), it will be helpful if future studies also account for whether the tumor location adjacent to or impinging on these structure has a local effect on fibrosis. We are not aware of any prognostic significance of the extent of peritumoral fibrosis, but this DIA tool could be applied to large-scale studies that examine the clinical impact of this peritumoral reaction.
Our findings provide guidance for pathologists in interpreting fibrosis in peritumoral liver in small wedge resections and needle biopsies in the setting of metastatic colorectal adenocarcinoma. While pathologists still need to be extremely cautious in interpreting fibrosis directly adjacent to a tumor, the majority of livers return to background levels of fibrosis 5 mm from the tumor and nearly all returned to baseline levels by 10 mm. Tumor necrosis is associated with an exaggerated fibrotic response to tumor and pathologists should be more cautious in interpreting peritumoral liver when the tumor percent necrosis is elevated.
Acknowledgments
This work was supported by the Bloomberg Kimmel Institute for Cancer Immunotherapy (to R.A.A.); National Institutes of Health (NIH) Sidney Kimmel Cancer Center Core Grant (grant number P30 CA006973 to R.A.A.); National Cancer Institute Specialized Programs of Research Excellence in Gastrointestinal Cancer (grant number P50 CA062924 to R.A.A.); and NIH (grant number T32 CA193145 to T.R.C.).
References
- 1. Tomlinson JS, Jarnagin WR, DeMatteo RP, et al. Actual 10-year survival after resection of colorectal liver metastases defines cure. J Clin Oncol. 2007;25:4575-4580. [DOI] [PubMed] [Google Scholar]
- 2. Smith JJ, D’Angelica MI.. Surgical management of hepatic metastases of colorectal cancer. Hematol Oncol Clin North Am. 2015;29:61-84. [DOI] [PubMed] [Google Scholar]
- 3. Fong Y, Fortner J, Sun RL, et al. Clinical score for predicting recurrence after hepatic resection for metastatic colorectal cancer: analysis of 1001 consecutive cases. Ann Surg. 1999;230:309-318. [DOI] [PMC free article] [PubMed] [Google Scholar]
- 4. Brunner SM, Kesselring R, Rubner C, et al. Prognosis according to histochemical analysis of liver metastases removed at liver resection. Br J Surg. 2014;101:1681-1691. [DOI] [PubMed] [Google Scholar]
- 5. Jung HY, Kim SH, Jing J, et al. The histologic cut-off point for adjacent and remote non-neoplastic liver parenchyma of hepatocellular carcinoma in chronic hepatitis B patients. Korean J Pathol. 2012;46:349-358. [DOI] [PMC free article] [PubMed] [Google Scholar]
- 6. O’Brien MJ, Keating NM, Elderiny S, et al. An assessment of digital image analysis to measure fibrosis in liver biopsy specimens of patients with chronic hepatitis C. Am J Clin Pathol. 2000;114:712-718. [DOI] [PubMed] [Google Scholar]
- 7. Yegin EG, Yegin K, Karatay E, et al. Quantitative assessment of liver fibrosis by digital image analysis: relationship to Ishak staging and elasticity by shear-wave elastography. J Dig Dis. 2015;16:217-227. [DOI] [PubMed] [Google Scholar]
- 8. Calvaruso V, Burroughs AK, Standish R, et al. Computer-assisted image analysis of liver collagen: relationship to Ishak scoring and hepatic venous pressure gradient. Hepatology. 2009;49:1236-1244. [DOI] [PubMed] [Google Scholar]
- 9. Campos CF, Paiva DD, Perazzo H, et al. An inexpensive and worldwide available digital image analysis technique for histological fibrosis quantification in chronic hepatitis C. J Viral Hepat. 2014;21:216-222. [DOI] [PubMed] [Google Scholar]
- 10. Manousou P, Burroughs AK, Tsochatzis E, et al. Digital image analysis of collagen assessment of progression of fibrosis in recurrent HCV after liver transplantation. J Hepatol. 2013;58:962-968. [DOI] [PubMed] [Google Scholar]
- 11. Manousou P, Dhillon AP, Isgro G, et al. Digital image analysis of liver collagen predicts clinical outcome of recurrent hepatitis C virus 1 year after liver transplantation. Liver Transpl. 2011;17:178-188. [DOI] [PubMed] [Google Scholar]
- 12. Ryan P, Nanji S, Pollett A, et al. Chemotherapy-induced liver injury in metastatic colorectal cancer: semiquantitative histologic analysis of 334 resected liver specimens shows that vascular injury but not steatohepatitis is associated with preoperative chemotherapy. Am J Surg Pathol. 2010;34:784-791. [DOI] [PubMed] [Google Scholar]
- 13. Cai B, Liao K, Song XQ, et al. Patients with chronically diseased livers have lower incidence of colorectal liver metastases: a meta-analysis. Plos One. 2014;9:e108618. [DOI] [PMC free article] [PubMed] [Google Scholar]
- 14. Augustin G, Bruketa T, Korolija D, et al. Lower incidence of hepatic metastases of colorectal cancer in patients with chronic liver diseases: meta-analysis. Hepatogastroenterology. 2013;60:1164-1168. [DOI] [PubMed] [Google Scholar]
- 15. Iascone C, Ruperto M, Barillari P.. Colorectal carcinoma metastasis in livers infected with hepatitis B or C virus. Minerva Chir. 2005;60:77-81. [PubMed] [Google Scholar]


