

Abstract
Background
There are no blood-based molecular biomarkers of temporal lobe epilepsy (TLE) to support clinical diagnosis. MicroRNAs are short noncoding RNAs with strong biomarker potential due to their cell-specific expression, mechanistic links to brain excitability, and stable detection in biofluids. Altered levels of circulating microRNAs have been reported in human epilepsy, but most studies collected samples from one clinical site, used a single profiling platform or conducted minimal validation.
Method
Using a case-control design, we collected plasma samples from video-electroencephalogram-monitored adult TLE patients at epilepsy specialist centers in two countries, performed genome-wide PCR-based and RNA sequencing during the discovery phase and validated findings in a large (>250) cohort of samples that included patients with psychogenic non-epileptic seizures (PNES).
Findings
After profiling and validation, we identified miR-27a-3p, miR-328-3p and miR-654-3p with biomarker potential. Plasma levels of these microRNAs were also changed in a mouse model of TLE but were not different to healthy controls in PNES patients. We determined copy number of the three microRNAs in plasma and demonstrate their rapid detection using an electrochemical RNA microfluidic disk as a prototype point-of-care device. Analysis of the microRNAs within the exosome-enriched fraction provided high diagnostic accuracy while Argonaute-bound miR-328-3p selectively increased in patient samples after seizures. In situ hybridization localized miR-27a-3p and miR-328-3p within neurons in human brain and bioinformatics predicted targets linked to growth factor signaling and apoptosis.
Interpretation
This study demonstrates the biomarker potential of circulating microRNAs for epilepsy diagnosis and mechanistic links to underlying pathomechanisms.
Keywords: Biofluids, Dissociative seizures, Temporal lobe epilepsy, Status epilepticus, Noncoding RNA, Serum
Abbreviations: Amplification score, (AmpScore); Anti-epileptic drugs, (AEDs); Control, (C); Electroencephalography, (EEG); Epilepsy after-seizure sample, (EAS); Epilepsy baseline sample, (EBS); epilepsy monitoring units, (EMUs); False discovery rate, (FDR); Fluorescence in situ hybridization, (FISH); Frontal lobe epilepsy, (FLE); Genetic generalized epilepsy, (GGE); Immunoprecipitation, (IP); MicroRNAs, (miRNAs); miRNA-target interactions, (MTIs); OpenArray, (OA); Preamplification, (preAmp); Psychogenic non-epileptic seizures, (PNES); Quantification cycle confidence, (Cqconf); Receiver operating characteristic, (ROC); RNA sequencing, (RNA-seq); Status epilepticus, (SE); Tags per Million, (TPM); Temporal lobe epilepsy, (TLE)
Research in context.
Evidence before this study
There has been long-standing interest in finding molecules in the blood that can support diagnosis of brain diseases, including epilepsy. One of the most promising classes of molecule is small noncoding RNAs called microRNAs. We searched Pubmed and Google scholar on September 1st 2013 using the terms “microRNA”, “human”, “blood” and “epilepsy”. There were no relevant human studies (quality of evidence does not apply) although we did find reports of microRNA changes in blood samples from animal models of epilepsy. Since commencing our research, there have been studies reporting altered blood microRNA levels in epilepsy patients.
Added value of our study
This is the first study to use two different genome-wide screening platforms and patients from two different countries to search for circulating microRNA biomarkers of epilepsy. We found a number of microRNAs that were different in blood samples from epilepsy patients and validated these findings using samples from a larger cohort of epilepsy patients and patients with a condition that can often be mistaken for epilepsy (psychogenic non-epileptic seizures). We supported these findings by testing for the microRNAs in blood samples from an animal model. We show that the diagnostic accuracy of circulating microRNAs is increased if you extract the molecules from exosomes. We also describe a prototype microRNA test device that could be developed for use in a clinical setting.
Implications of all the available evidence
Our study, along with research by other groups, indicates detection of microRNAs in biofluids such as blood can help support a diagnosis of a brain condition. Our study provides encouraging support for microRNAs as potential diagnostic biomarkers of epilepsy.
Alt-text: Unlabelled Box
1. Introduction
Temporal lobe epilepsy (TLE) is the most common focal and intractable seizure disorder in adults. A correct diagnosis is critical and will inform the choice of therapy among other factors, but relies mainly on clinical examination and history [1]. Electroencephalography (EEG) has only limited diagnostic yield unless performed within specialist epilepsy monitoring units (EMUs) where continuous video-EEG recording is available [2,3]. Brain imaging is negative in many patients with epilepsy [4]. Together, these factors contribute to mis- or delayed diagnosis, adversely affecting patients and negatively impacting healthcare resources [5]. Psychogenic non-epileptic seizures (PNES) are particularly challenging to diagnose outside the EMU [6]. Accordingly, there is much interest in identifying molecular biomarkers which could provide a rapid, cheap and noninvasive support for epilepsy diagnosis [3,7].
Various circulating molecules have been investigated as epilepsy biomarkers, including proteins such as neuron-specific enolase, S100β and inflammatory cytokines, but most suffer from lack of sufficient specificity or technical challenges with simple and rapid detection in a clinical setting [2,3,8]. MicroRNAs (miRNAs) are an emerging class of potential biomarker for brain diseases [9]. They are short noncoding RNAs that function post-transcriptionally via sequence-specific binding to mRNAs mediated by Argonaute-2 (AGO2) and other components to reduce protein levels in cells. miRNAs have numerous qualities as biomarkers: several are expressed uniquely within the brain [10] and display cell-specific expression in neurons or glia [11]. miRNAs are quite stable in biofluids and well-suited to rapid and reliable detection at ultra-low levels using PCR and other techniques [9,12,13].
A number of miRNAs have been reported to be dysregulated in brain tissue from patients with epilepsy and experimental manipulation of specific miRNAs has been shown to alter seizure thresholds in animals [[13], [14], [15]]. Seizures and the underlying pathophysiology may lead to the release of miRNA from neurons, glia or cells of the cerebrovasculature via passive or active mechanisms whereupon they can be detected in the circulation [9]. Indeed, profiling and single miRNA analyses show levels of a number of miRNAs are altered in serum, plasma and cerebrospinal fluid in patients with epilepsy [[16], [17], [18], [19], [20], [21]]. These studies, however, typically analyzed samples from a single clinical site and used only one miRNA profiling technique, which can be limiting due to platform-specific technical bias [12,22,23]. The depth and quality of clinical phenotyping in discovery cohorts is often uncertain, confounders such as medication are rarely addressed and there has been an over-reliance on in silico target prediction programs to mechanistically link the miRNA with epileptogenesis [24].
In the present study we aimed to address some of these previous limitations to identify miRNA biomarkers of TLE in adults. Plasma samples were collected from patients before and after seizures during EMU monitoring in epilepsy specialist clinics in two different European countries. We used a dual-platform miRNA profiling approach to reduce technical bias and ensure genome-wide coverage [22,23,25]. Multi-level validation of biomarker potential was performed in a large cohort that included samples from PNES patients and other epilepsies. We tested miRNA levels in plasma from rodents with experimentally-induced epilepsy and developed a prototype sample-to-answer electrochemical miRNA detection device. Last, mechanistic links were pursued for differentially expressed miRNAs, focusing on transport within plasma and evidence of expression in human brain tissue.
2. Materials and methods
2.1. Ethical approval (human studies)
This study represents an extensive collaboration between several clinical and research centers across Europe: Philipps University of Marburg, Germany (MAR); Department of Neurology, Beaumont Hospital, Dublin, Ireland (DUB); Friedrich-Alexander-University Erlangen-Nurnberg (ERL), Germany. Ethical approval was obtained from the local medical ethics committees at each center (MAR, 17/14; DUB 13/75; ERL 127_14Bc). Following a detailed discussion of the study, patients and healthy controls were given a written information leaflet further describing the study design and rationale. Consent was obtained according to the Declaration of Helsinki from all participants. Participation rates were not recorded.
2.2. Patients and healthy controls
For the profiling phase, 32 adult patients attending the EMU at the Epilepsy Center Hessen/Department of Neurology/Marburg (MAR group, n = 16) and Beaumont Hospital/Dublin (DUB group, n = 16) were recruited. All patients had refractory focal epilepsy (majority with refractory TLE) prior to admission and were on poly-drug therapy. The reasons for admission were mainly to confirm the diagnosis, assess pharmacoresistance and suitability of the patient for surgical resection. Continuous video-EEG monitoring was performed for each patient using a standard international system electrode placement. Continuous computerized seizure detection was performed throughout the recording period. The entire recording from the monitoring session was manually reviewed by a neurologist with special training in epilepsy. From each patient, a baseline blood sample (epilepsy baseline sample, EBS) was taken on admission. An epilepsy after-seizure sample (EAS) was then collected 24 h after experiencing an electro-clinical seizure. This time-point was selected to ensure we captured any potentially protracted release mechanisms contributing to miRNA entry to the circulation while avoiding early sampling where clinical factors (motor components, use of rescue medication) may introduce bias [19]. In addition, 32 non-fasting male and female healthy control (C) volunteers (MAR, n = 16; DUB, n = 16) were recruited from the same sites.
For the validation phase, the level of the dysregulated miRNAs was checked in an extended cohort of patients and controls collected from both MAR and DUB in addition to samples collected from the Friedrich-Alexander-University Erlangen-Nurnberg. The validation phase included 102 TLE patients (29 with both EBS and EAS samples) and 110 controls. Also, samples from patients with frontal lobe epilepsy (FLE, n = 10), genetic (idiopathic) generalized epilepsy (GGE, n = 23), patients who experienced status epilepticus (SE, n = 6) and from patients with psychogenic non-epileptic seizures (PNES, n = 15) were included. Full details of all control group and patient demographics, diagnosis, drug therapy and the origin of each sample are included in Supplementary Table S1.
2.3. Plasma collection, processing and quality control
Protocols for plasma processing were harmonized between centers and followed a previously reported protocol based on guidelines [26,27]. Ten milliliters of peripheral blood was collected from donors at one or more time point in K2EDTA tubes (BD Bioscience). Within 1 h of blood collection, plasma was prepared by centrifuging the tubes at 1300 x g, for 10 min, at 4 °C. The supernatant was collected into an RNAase free tube and was kept at −80 °C. A post-freezing centrifugation step was then performed at 1940 x g for 10 min at 4 °C to further reduce cellular and platelet contamination [26]. The level of hemolysis in samples was assessed by spectrophotometric analysis using Nanodrop 2000 spectrophotometer. Absorbance at 414 nm was checked and any sample with an absorbance >0.25 was excluded from the study due to the possibility of hemolysis [28].
2.3.1. miRNA profiling
Total RNA was extracted from 200 μl of plasma using the miRCURY RNA isolation kit for biofluids (Exiqon), as before and based on other recommendations [27,29]. Purified RNA was eluted in 50 μl RNAase free water. For miRNA expression analysis in individual samples we used the QuantStudio™ 12 K Flex OpenArray system (ThermoFisher Scientific) [21,27]. OpenArray technology is a high-throughput, real-time PCR–based method for miRNA detection that enables simultaneous amplification of 754 human miRNAs in each sample. The OpenArray workflow involves reverse transcription (RT), preamplification (preAmp) and PCR amplification [21,27]. Filtering and statistical analysis of the OpenArray miRNA profiling data were performed in R/Bioconductor [30]. Data were first filtered according to cycle threshold (Ct < 25), amplification score (AmpScore >/= 1.24) and quantification cycle confidence (Cqconf >/= 0.8) provided by the ExpressionSuite software (ThermoFisher Scientific). Only miRNAs expressed in >80% of samples were included in the study. Missing data points were imputed [31]. Next, we performed deltaCt normalization using miRNAs (miR-19b, miR-26a and miR-26b) that were identified by the geNorm method as being the most stable miRNAs [32]. Differential expression analysis was then performed by applying a Student's t-test to the normalized Ct values between each two conditions (C/EBS, C/EAS and EBS/EAS). The p-values were adjusted for multiple testing by controlling the false discovery rate (FDR) according to the method of Benjamini and Hochberg [33].
The second profiling approach was using small RNA sequencing (RNA-seq). Here we pooled the samples from the three groups used in the OpenArray profiling (C, EBS, EAS; n = 16 each) for the two centers separately. Total RNA was extracted using miRCURY RNA isolation kit and small RNA libraries were generated using NEBNEXT library generation kit (New England Biolabs Inc.). Samples were sequenced on the Illumina system by Exiqon Services, Denmark. Intensity correction, base calling and assigning of Q-scores were then performed as part of measures to assess the quality of the data obtained. miRNA expression level was measured as Tags Per Million (TPM). Differential expression analysis was performed using the EdgeR statistical software package [34]. Expression data have been submitted to the gene expression Omnibus (GSE114701).
2.3.2. Individual miRNA expression analysis using Real-Time qPCR
Individual miRNA Taqman assays were performed for validation of the profiling studies using RT-qPCR as described [21]. All miRNA RT reactions were carried out using the high capacity RT kit (ThermoFisher Scientific) in addition to miRNA-specific RT primers (ThermoFisher Scientific). Real-time PCR amplification was performed in triplicate and a negative control was included for each primer. The PCR reaction was performed in the QuantStudio™ 12 K Flex PCR system using 96 well plates. miRNA levels were normalized to average Ct of miR-19b, miR-26a and miR-26b and spiked-in cel-miR-39 in the confirmation phase and to the level of spiked-in cel-miR-39 in the validation phase. The mean of the Ct for a particular miRNA were calculated after removing outliers identified with Grubbs's test (p-value ≤.05). ANOVA followed by Tukey's post-hoc test was carried out to test for any significant differences between the means. A miRNA was considered to be differentially expressed if the adjusted p-value was ≤0.05. Fold changes were calculated as FC = 2−∆∆Ct where ∆∆Ct = ∆Cttarget − ∆Ctref. Receiver operating characteristic (ROC) curve analyses were performed using the R pROC package [35]. Logistic regression analysis of the combined miRNA was carried out with the R glm package using the normalized expression of miRNAs from qRT-PCR experiments as independent variable, and epilepsy status as the dependent variable.
2.3.3. Analysis of miRNAs in plasma in an animal model of epilepsy
All animal experiments were performed in accordance with the European Communities Council Directive (2010/63/EU). Procedures in mice were approved by the Research Ethics Committee of the Royal College of Surgeons in Ireland (REC-842), under license from the Health Products Regulatory Authority (AE19127/001), Dublin, Ireland. Epilepsy was induced using the intraamygdala kainic acid technique. Briefly, adult C57BL/6 mice (20–25 g, Harlan) were anesthetized and equipped with guide cannula and surface EEG. On recovery, mice underwent intraamygdala microinjection of kainic acid to induce status epilepticus [36]. All animals received lorazepam after 40 min to reduce morbidity and mortality. Using this procedure, all mice develop recurrent spontaneous seizures within five days [37]. Control mice underwent the same procedure but had an intraamygdala injection of phosphate-buffered saline (PBS). Plasma samples were collected two weeks later. Efforts were made to ensure samples were taken no earlier than 4 h after the most recently observed seizure. Blood (~150 μl) was collected using the submandibular bleed technique into an EDTA-coated RNase-free tube and centrifuged to obtain plasma. To assess effects of anticonvulsant drugs on plasma miRNAs an additional set of epileptic mice were given three days of twice-daily injections (intraperitoneal) of either diazepam (5 mg.kg−1) or carbamazepine (40 mg.kg−1) to evaluate whether anticonvulsant drugs alter plasma miRNA levels in epileptic animals. To determine whether plasma levels of the dysregulated miRNAs responded to a disease-modifying therapy, additional mice were injected intracerebroventricularly with an antagomir targeting miR-134-5p after the induction of status epilepticus. Plasma was obtained from mice two weeks later and processed for miRNA analyses. We have previously shown that silencing miR-134 after status epilepticus results in a >90% reduction in spontaneous recurrent seizures during the next two weeks [37].
2.3.4. Absolute quantification of miRNA copy number using digital PCR
Digital PCR (dPCR) was performed to obtain copy number estimates of miRNAs in plasma, as described [21]. To obtain copy number estimates for miR-27a-3p, miR-328-3p and miR-654-3p, a set of eight representative plasma samples (200 μl) from control and TLE groups and five from GGE and PNES groups were selected at random and processed using Quantstudio v2 dPCR chips as described [21]. Copy number was determined after processing using the Quantstudio 3D AnalysisSuite cloud software.
2.3.5. Direct detection of miR-27a-3p, miR-328-3p and miR-654-3p in plasma using tornado
A prototype rapid point-of-care testing microfluidic device was developed by adapting a recently described theranostic one-step RNA detector (tornado) [38] to detect the three main validated miRNAs on a single device. The ability of tornado to detect miRNA signals and then to differentiate between different study groups was investigated using control, TLE and PNES samples (n = 4–5 each) for which copy number data was available from dPCR. The oligonucleotides were purchased from Eurogentec and their purity was >98%. The sequences were as follows: Capture (complementary in part to the target miRNA) for miR-27a-3p: 5’-GCC-ACU-GUG-AA-3’-SH; probe for miR-27a-3p: SH-5-ACG-GSS-CUU-A-3′; Capture for miR-328-3p: 5′-GAG-AGG-GCC-AC-3’-SH; Probe for miR-328-3p: SH-5’-ACG-GAA-GGG-CA-3′; Capture for miR-654-3p: 5’-CAG-CAG-ACA-UA-3’-SH; Probe for miR-654-3p: SH-5′-AAG-GUG-AUG-GU-3′. The disc was assembled and run as previously described [38]. Briefly, the gold slide working electrode was pre-functionalized with capture miRNA by immersing the electrode in 1 μM solution of the capture oligo dissolved in Denhardt's buffer for 30 min. The electrode was then rinsed to remove any loosely bound oligonucleotides and dried under nitrogen. The disc was pre-loaded with the plasma sample (100 μl) the complementary probe functionalized platinum nanoparticles, and wash steps. The system uses a sequential, event-triggered release of each chamber in the disc, which uses the arrival of liquid at one location to prompt the release of another liquid at another location; this forms the sandwich assay on the gold working electrode. The discs were spun on an experimental spin stand at varying rates of rotation, ranging from 1 Hz to 35 Hz, depending on the stage of testing [39]. When the first chamber containing the plasma sample was released, it was left in the electrode chamber for 30 min to incubate. The electrodes were rinsed by release of the second sample chamber, containing dPBS. The third chamber contained 1 μM platinum nanoparticles (50–70 nm) functionalized with probe miRNA; this probe strand was complementary to the non-hybridized part (overhang) of the target miRNA. When this was released into the measurement chamber, it was left for 30 min to allow the probe and target miRNA to hybridize. Following the assembly of the sandwich, the measurement chamber was filled with dPBS that acted as a wash step and the measurement buffer. The number of nanoparticles on the surface of the electrode depends directly on the concentration of target miRNA. As well as the gold working electrode functionalized with the capture strands, the three electrode measurement chamber contained a gold coated silicon wafer as counter and an ITO electrode as a pseudo-reference. All measurements were made at 22 ± 2 °C. A CH Instruments, Model 760D electrochemical workstation was used to measure the current generated at −0.25 V by the captured nanoparticles following addition of 20 μM hydrogen peroxide. The current was measured 30 min after the peroxide addition. The analytical response is taken as the difference in current measured before and after the addition of the hydrogen peroxide. Results were qualitatively compared to dPCR findings.
2.3.6. Analysis of miRNA transport in plasma
Analysis of the amount of miRNA within exosome-enriched microvesicles and AGO2-bound relative to total circulating was performed as previously described with modifications [21]. Briefly, plasma from controls and TLE patients (both EBS and EAS) (n = 10 each) were divided into 3 parts; 400 μl was allocated for exosome precipitation; 400 μl for AGO2 immunoprecipitation (IP) and 200 μl for total RNA extraction. Exosome precipitation was performed using the ExoQuick exosome precipitation solution (System Biosciences-SBI) and total RNA was extracted using miRCURY RNA isolation kit-biofluid. AGO2 was immunoprecipitated from plasma as described [21]. Briefly, 400 μl of plasma was incubated overnight at 4 °C with 10 μg of antibodies raised against AGO2 (C34C6, RRID:AB_2096291 Cell Signaling Technology). Protein A-agarose beads (RRID:AB_10201400 Santa Cruz Biotechnology) were added and utilized to pulldown AGO2 containing nucleoprotein complexes, following an incubation and centrifugation step. The AGO2 immunoprecipitate pellet was washed and total RNA was extracted. RT-qPCR was then performed following the protocol for individual miRNA expression analysis.
2.3.7. Fluorescence in situ hybridization (FISH) detection of miRNA
In order to localize miRNA expression in vivo, FISH analysis was performed on formalin-fixed, paraffin-embedded hippocampal tissue sections obtained from TLE patients after surgical resection [21]. Briefly, miR-27a-3p, miR-328-3p and miR-654-3p signals were localized after an overnight incubation with digoxigenin (DIG) labeled, LNA detection probes (Exiqon). Secondary detection of the probe-miRNA interaction was performed using anti-Dig antibody (Anti-DIG-POD Fab fragment, RRID:AB_2734716) (Roche). Tyramide signal amplification plus fluorescence (Cy3) kit (Perkin Elmer) was used to amplify the in situ labelling. Double-labelling of cell-type markers was performed using antibodies against the astrocyte marker glial fibrillary acidic protein (GFAP, RRID:AB_477010 Sigma-Aldrich Ireland) and neuronal nuclei marker (NeuN, RRID:AB_2298767 Sigma-Aldrich Ireland). AlexaFluor488 (RRID:AB_2534088 ThermoFisher Scientific) was used as secondary antibodies to visualize both markers. Fluorescent signals were imaged using LSM 202710 confocal laser scanning microscope (Zeiss).
2.3.8. Pathway analyses and miRNA-target interaction network
Tissue expression of miRNAs was explored using a miRNA atlas [10]. Experimentally validated targets for hsa-miR-27a-3p, hsa-miR-328-3p and hsa-miR-654-3p were retrieved from miRTarBase Release 6.0 [40]. Validated miRNA-target interactions (MTIs RRID:SCR_010851) were scored based on the number of publications demonstrating the MTI (Vscore: 1 publication = 0.5, 2 publications = 1.0, ≥3 publications = 1.5). Predicted targets were retrieved from TargetScan Release 7.1 (RRID:SCR_010845) [41] and miRDB (RRID:SCR_010848) [42]. To generate a score for predicted MTIs (Pscore), we scaled the scores generated by the prediction algorithms (cumulative weighted context score from TargetScan) between 0 and 1, summed these scores and multiplied this by the number of prediction algorithms in which the MTI was identified (1 or 2) and scaled this between 0 and 1. We summed the Vscore and Pscore to generate a final MTI score. Any MTIs with a score < 0.1 were removed from further analyses. We then further filtered the MTIs based on the following criteria: MTIs were retained if they had been validated by experiments classified as ‘strong evidence’ in miRTarBase or if they had a Pscore ≥0.75. If any mRNA targets included in this filtered list were also targeted by another miRNA, this second MTI was also retained (provided the MTI score was >0.1), to highlight the putative interconnectedness between the three miRNAs. Thus, 105 MTIs containing 95 unique mRNA targets were included in the chord diagram, which was created using the ‘circlize’ package in R version 3.4.2. [43]. Transcription factors were identified from AnimalTFDB 2.0 (RRID:SCR_001624) [44]. We performed pathway analysis on the 95 unique mRNA targets identified above, using Enrichr (RRID:SCR_001575) [45]. Significantly enriched PANTHER pathways (RRID:SCR_004869) [46], with adjusted p-value <.05 were exported form Enrichr and plotted in Microsoft Excel. Associations of miRNA targets with epilepsy were explored by querying Pubmed. Expression of mRNA targets in the brain was investigated using the human protein atlas (https://www.proteinatlas.org/humanproteome/brain).
3. Results
3.1. Dual-center, dual-platform miRNA profiling (discovery phase)
An overview of the study design from profiling through to validation and mechanistic biomarker assessment is shown in Fig. 1a. We performed miRNA profiling of plasma samples from controls and from epilepsy patients admitted to two clinical centers, MAR and DUB. The majority of patients recruited at MAR were diagnosed with refractory TLE and all patients recruited in DUB were diagnosed with refractory TLE (Table 1 and Supplementary Table S1). From each patient we obtained an epilepsy-baseline sample (EBS) and an epilepsy after-seizure sample (EAS). Samples were either profiled individually using the OpenArray platform [21] or pools from each group and for each center were generated and profiled by small RNA-seq.
Fig. 1.

Study design and plasma miRNA profiling in TLE. (a) Schematic showing overview of study. Plasma samples were collected from controls (C) and from epilepsy patients at baseline (EBS) and after seizures (EAS) during in-patient video-EEG monitoring in Marburg (MAR) and Dublin (DUB). Samples were run individually on the OpenArray platform (OA) or pooled for RNA-seq. From these a selection of 15 miRNAs were validated using individual miRNA assays during a confirmation phase using the original samples and then three miRNAs were advanced for validation in a larger cohort of plasma samples from controls, TLE patients as well as samples from patients with genetic generalized epilepsy (GGE), frontal lobe epilepsy (FLE), psychogenic non-epileptic seizures (PNES) and status epilepticus (SE). An extended validation phase involved testing three miRNAs through a set of animal and human studies. (b) Barplots showing the number of unique miRNA identified in each sample using OA profiling. (c) Venn diagram indicating overlap of differentially expressed miRNA identified by OA analysis of the MAR samples and five miRNAs that were differentially expressed. (d) Summary bar chart on RNA-seq data from the MAR sample analysis. Panel to right shows a heatmap and unsupervised clustering by sample and miRNA for the 50 miRNAs with highest coefficient of variation. (e) Summary RNA-seq data and heat map from DUB sample analysis. (f) Graphic displaying miRNAs from the RNA-seq data with common direction of altered expression which were selected for validation.
Table 1.
Summary demographics of discovery and validation cohorts.
| Centre/group |
Discovery |
Discovery |
Validation |
Validation |
|---|---|---|---|---|
| MAR | Male | Female | Male | Female |
| Control | 8 (41.2 ± 4) | 8 (34.7 ± 3) | 24 (42.50 ± 3) | 46 (36.22 ± 2) |
| TLE | 8 (40.2 ± 5) | 8 (36.7 ± 3) | 30 (41.20 ± 2) | 22 (39.82 ± 3) |
| FLE | 5 (37.6 ± 5) | 3 (40.67 ± 5) | ||
| GGE | n/a | 6 (27.33 ± 1) | ||
| SE | 5 (66.20 ± 5) | 1 (77) | ||
| PNES | 3 (51.0 ± 1) | 8 (26.0 ± 2) |
| DUB | Male | Female | Male | Female |
|---|---|---|---|---|
| Control | 10 (36.4 ± 3) | 6 (35.0 ± 3) | 21 (38.05 ± 2) | 19 (31.47 ± 1) |
| TLE | 10 (44.2 ± 6) | 6 (37.0 ± 7) | 13 (46.54 ± 3) | 18 (39.56 ± 2) |
| FLE | 1 (34) | 1 (28) | ||
| GGE | 3 (38.33 ± 9) | 14 (31.00 ± 2) | ||
| SE | ||||
| PNES | 5 (25.00 ± 2) |
| ERL | Male | Female | ||
|---|---|---|---|---|
| TLE | 4 (44.50 ± 8) | 15 (44.07 ± 2) |
Key: TLE, temporal lobe epilepsy; FLE, frontal lobe epilepsy; GGE, genetic generalized epilepsy; SE, status epilepticus,; PNES, psychogenic non-epileptic seizures.
3.2. OpenArray miRNA profiling individual plasma samples of TLE patients and healthy controls
In total, 96 plasma samples from the two centers were profiled individually by the OpenArray platform. Preliminary analysis of the data revealed 336 miRNAs were expressed in at least one sample. Supplementary Table S2 lists the 20 most abundant miRNAs detected by OpenArray. This list includes various miRNAs known to be abundant within plasma such as miR-24-3p, miR-146a-5p and miR-451a [27]. Principal component analysis (PCA) revealed significant overlap in the individual miRNA profiles between control and patient samples for both centers (Fig. 1b). Analyzing MAR samples revealed that 55 miRNAs were commonly expressed in >80% of samples using a Ct threshold cutoff of 25 (Supplementary Fig. S1, Supplementary Data Set 1). Among these miRNAs, five were found to be significantly differentially expressed (adjusted p-value <.05) in one or both TLE samples versus controls (Table 2, Fig. 1c). Analyzing DUB samples revealed that 92 miRNAs were expressed in >80% of samples (Supplementary Data Set 1). However, no miRNA was found to be differentially expressed between groups with an adjusted p value below 0.05 in the DUB samples.
Table 2.
Differentially expressed miRNAs identified by individual OA profiling during discovery.
| miRNA | FC | p value (FDR) | |
|---|---|---|---|
| EBS vs C | hsa-miR-335-5p | 1.92 | 0.017 |
| hsa-miR-199a-3p | 1.4 | 0.017 | |
| EAS vs C | hsa-miR-335-5p | 1.94 | 0.011 |
| hsa-miR-328-3p | 1.69 | 0.035 | |
| hsa-miR-126-5p | 1.86 | 0.035 | |
| hsa-miR-27a-3p | 1.68 | 0.045 | |
| EAS vs EBS | n/a | n/a | n/a |
Key: C, control; EBS, epilepsy baseline sample; EAS, epilepsy after-seizure sample; FC, fold change; FDR, false discovery rate (adjusted p value).
3.3. Small RNA-seq analysis of plasma from TLE patients and healthy controls
To complement the OpenArray profiling, RNA-seq was performed on pooled plasma samples. All samples showed overall good data quality with the two most common read lengths between 18 and 24 nt (representing miRNAs) and 30–34 nt (representing other RNA species i.e. rRNA, tRNA and mRNA fragments). The total number of reads obtained from each sample is shown in Fig. 1d, e (and see Supplementary Data Set 1).
An average of 255 and 172 miRNAs were identified in MAR and DUB, respectively. Among the top 20 most abundant miRNAs in MAR control samples, 17 were also found to be among the top 20 most abundant in DUB controls (Supplementary Table S2). Differential expression analysis was conducted separately on each set of samples. Comparing results from the two sequencing experiments, 11 miRNAs were found to have a common expression pattern with fold change >1.5 or < −1.5 in patient samples compared to controls (Fig. 1f). These miRNAs were advanced for confirmation in the second phase of the study.
3.4. Confirmation of profiling results
Next, we performed individual miRNA assays to confirm the profiling results, selecting the 5 differentially expressed miRNAs identified by the OpenArray (see Table 2) and 10 miRNAs identified by RNA-seq (see Fig. 1f). Note, miR-328-3p appeared in both data sets while miR-122-5p was omitted due to being a known liver-specific, highly abundant miRNA in plasma (Supplementary Table S2).
Overall, 12 of 14 of the miRNAs selected from the profiling studies for validation as biomarkers of TLE or seizure or both, were confirmed (Fig. 2a and Supplementary Fig. S2). A number of the validated miRNAs were potential seizure biomarkers, being dysregulated in EAS samples compared to both controls and EBS. The level of miR-27a-3p and miR-328-3p was lower in samples collected after an electro-clinical seizure, indicating a potential value in diagnosing seizure episodes (Fig. 2a). Plasma levels of miR-654-3p were a promising biomarker of TLE as levels were different in EBS compared to control (Fig. 2a). A similar trend was observed for miR-543 (Supplementary Fig. S2).
Fig. 2.

Validation of miRNAs miR-27a-3p, −328-3p and 654-3p as epilepsy biomarkers.(a) Box-and-whiskers plots of the expression of miRNAs -27a-3p, 328-3p and 654-3p in plasma from the discovery cohort (MAR + DUB) samples (n = 32 per group). * p < .05; ** p < .01 compared to indicated group. (b) Validation of the three miRNAs in an expanded cohort that included controls (n = 110), TLE patients (n = 102), patients with genetic generalized epilepsy (GGE, n = 23), frontal lobe epilepsy (FLE, n = 10), psychogenic non-epileptic seizures (PNES, n = 15) and status epilepticus (SE, n = 6). (c) ROC plots of the plasma data for TLE and GGE samples compared to controls. Note, combinations of miRNAs resulted in slightly higher biomarker performance compared to single miRNA assessments. *p < .05 compared to controls.
The confirmation phase identified differential expression of five other miRNAs that had been selected for confirmation in post-seizure plasma samples (Supplementary Fig. S2). These were miR-199a-3p (fold-change (FC) = 0.7, p = .03), miR-126-5p (FC = 0.7, p = .04), miR-339-5p (FC = 0.66, p = .04), miR-654-3p (FC = 0.61, p = .04) and miR-4433b-3p (FC = 0.53, p = .04). These miRNAs displayed higher expression level in EBS samples compared to both controls and EAS.
ROC curve analysis revealed strong performance of many of the confirmation phase-validated miRNA biomarkers (Supplementary Fig. S3a, b). An area under the curve (AUC) of 1 would show prefect discrimination between groups. The highest performing miRNA for distinguishing EBS samples from controls was miR-654-3p (AUC 0.87). The best performing miRNAs as seizure biomarkers, distinguishing EAS from EBS, was miR-328-3p (AUC 0.90) and miR-27a-3p (AUC 0.88) (Supplementary Fig. S3b).
3.4.1. Validation of miRNA biomarkers in expanded TLE cohort and other patient groups
Based on statistical robustness and ROC performance, three miRNAs were chosen to be validated in a larger cohort comprising TLE patients (n = 102) and controls (n = 110) (Table 1 and Supplementary Table S1). These miRNAs were miR-27a-3p, miR-328-3p and miR-654-3p. We also measured the level of these miRNAs in plasma from patients with other forms of epilepsy to determine whether changes were unique to TLE or common to the epilepsies. We included samples from patients with other focal epilepsies (frontal lobe epilepsy (FLE)), genetic generalized epilepsy (GGE) and patients with status epilepticus (SE). We also included samples from patients diagnosed with PNES (see Table 1, Supplementary Table S1).
The validation phase confirmed the previously observed dysregulation of miR-27a-3p and miR-328-3p in TLE patient plasma compared to controls (Fig. 2b and Supplementary Table S3). In addition, levels of miR-27a-3p and miR-654-3p were also found to be significantly different in plasma from GGE patients compared to controls (Supplementary Table S3). Importantly, none of the miRNAs were differentially expressed in PNES samples compared to controls (Fig. 2b and Supplementary Table S3). Levels of the three miRNAs were not significantly different in samples from FLE and SE patients compared to controls or between epilepsy patient groups (Fig. 2b and Supplementary Table S3).
3.5. Statistical performance of dysregulated miRNAs as biomarkers for TLE in expanded cohort
ROC analysis using data from the full cohort was used to evaluate if miR-27a-3p, miR-328-3p and miR-654-3p levels can discriminate TLE and GGE samples from each other and control samples. In line with the statistical analysis (Supplementary Table S3), ROC analysis showed that miR-27a-3p and miR-328-3p performed equally well and better than miR-654-3p at discriminating TLE from control (AUC 0.63) (Fig. 2c and Supplementary Fig. S4a). Binomial logistic regression was used to identify the best discriminating combinations of miRNAs. Combining all three miRNAs provided limited improvement for discriminating TLE from controls (AUC 0.64) (Supplementary Fig. S4a).
For GGE samples, levels of miR-27a-3p and miR-654-3p showed the best results to discriminate patients from controls, with an AUC of 0.73 and 0.72, respectively (Fig. 2c). Combining all three miRNAs marginally improved the sensitivity and specificity to discriminate GGE from controls (AUC 0.74) (Supplementary Fig. S4a).
We also investigated the potential of miRNA levels to discriminate between patient groups. For discriminating TLE from GGE patients, ROC analysis of the individual miRNAs generated AUCs ranging from 0.53–0.64 (Supplementary Fig. S4a). Combining all three miRNAs improved sensitivity and specificity to discriminate TLE from GGE (Fig. 2c).
Last, we explored etiological influences on levels of the three plasma miRNAs. We focused on samples from TLE patients, comparing levels in patients with or without hippocampal sclerosis. There were no significant differences in plasma levels of miR-27a-3p, miR-328-3p and miR-654-3p between TLE patients with or without hippocampal sclerosis (Supplementary Fig. S4b).
3.5.1. miRNA biomarkers in epileptic rodents and response to anti-epileptic drug and miRNA therapy
There are a number of potential sources of bias in clinical samples, including exposure to medication. We therefore sought to measure these miRNAs in experimentally-induced epilepsy where such confounders can be tested for or avoided. Levels of miR-27a-3p, miR-328-3p and miR-654-3p were measured in plasma from mice that developed TLE following intra-amygdala kainic acid-induced status epilepticus [36,37] (Fig. 3a).
Fig. 3.

miRNA biomarker performance in experimental epilepsy. (a) (left) Schematic of studies in mice in which miRNA performance was analyzed. Plasma was collected from mice two weeks after status epilepticus (SE) at a time when mice display spontaneous recurrent seizures (SRS). In a second experiment, already-epileptic mice were dosed with AEDs carbamazepine (CBZ) or diazepam (DZM). Graphs (right) show relative expression of miR-27a-3p and miR-328-3p in control and epileptic (Epi) mice and in epileptic mice dosed with the two AEDs (n = 5–9 per group). Note, both miRNAs were lower in epileptic mouse plasma consistent with the human data while plamsa levels of the miRNA were not significantly changed by AED exposure. (b) (left) Schematic showing experimental design in which mice were given a known disease-modifying miRNA therapy (anti-mir) immediately after status epilepticus to reduce epilepsy development. Samples were taken two weeks later. Graphs (right) show relative expression of miR-27a-3p and miR-654-3p in control and epileptic mice (n = 4–5 per group). Note, partial reversal of miRNA expression pattern in mice given the disease-modifying antimir therapy. *p < .05 compared to indicated group.
Consistent with the clinical findings, levels of miR-27a-3p and miR-328-3p were significantly lower in plasma samples from epileptic mice compared to controls (Fig. 3a). Levels of miR-654-3p also showed a similar pattern of down-regulation in samples from epileptic mice (Supplementary Fig. S5a).
Next, we investigated the effect of medication on the three miRNAs by dosing epileptic mice with one of two anticonvulsant drugs. We selected diazepam and carbamazepine as representing anti-seizure therapies that are more or less effective, respectively, at suppressing spontaneous recurrent seizures in mouse models of focal epilepsy [47]. Neither diazepam nor carbamazepine had a significant effect on plasma levels of the three miRNAs in epileptic mice (Fig. 3a and Supplementary Fig. S5a).
Last, we explored whether the plasma miRNA levels would respond to disease-modifying therapy. We recently showed that inhibition of miR-134 with an antisense-based oligonucleotide (Ant-134) given 1 h after status epilepticus resulted in over 90% reduction in spontaneous seizures during the subsequent two weeks [37]. To determine whether this experimental therapy would alter plasma levels of miRNAs we induced status epilepticus in mice with kainic acid followed by Ant-134 or a scrambled oligonucleotide and then analyzed levels of the three miRNAs two weeks later (Fig. 3b). As expected, levels of miR-27a-3p, miR-328-3p and miR-653-3p were lower in epileptic mice given scrambled treatment compared to controls (Fig. 3b and Supplementary Fig. S5b). In contrast, plasma levels of two of the three miRNAs were higher in the mice given the Ant-134 treatment (Fig. 3b and Supplementary Fig. S5b). Thus, plasma levels of the identified miRNAs are responsive to an experimental disease-modifying epilepsy therapy.
3.5.2. Copy number estimation of miRNA biomarkers in patient plasma
Next, we used dPCR to estimate miRNA copy number in a subset of plasma samples from patients with TLE, GGE and PNES, comparing to the copy number in healthy controls. FLE and SE groups were omitted due to limited sample availability. Consistent with the RT-qPCR findings, miR-27a-3p and miR-328-3p copy number in plasma samples of TLE patients was significantly lower than that of controls (Fig. 4a). miR-27a-3p copy number was also significantly lower in GGE patients compared to controls. Very low expression of miR-654-3p was observed in all samples regardless of the diagnosis (Fig. 4a).
Fig. 4.

Copy number analysis of miRNAs in human plasma and prototype miRNA detector.(a) Graphs show miRNA copy number determined using digital PCR for miRNAs -27a-3p, 328-3p and 654-3p in control (C), TLE, GGE and PNES groups. Note that TLE samples showed the expected lower levels of miR-27a-3p in TLE as well as GGE patients compared to controls and miR-328-3p levels were also lower in TLE patients. In contrast, levels of the miRNAs were not different to controls in PNES patients. (b)tornado; image of fully assembled miRNA detector disc with integrated electrodes (cropped to view one section). Specific chambers contain target miRNA strands, wash steps, platinum (Pt) nanoparticle-labeled miRNA probe strands, the electrode chamber and a waste chamber with an overflow system. Expanded box (middle panel) shows schematic of the hybridisation of miRNA strands on surface of working electrode inside chamber. Graph (right) shows amperometric i-t curves comparing the response of a fully complementray samdwich assay with a target strand of 1 nM (black line) with a bare gold electrode (red line), a gold electrode with capture miRNA only (cRNA, green line) and a gold electrode with capture miRNA and target miRNA (tRNA, blue line potential applied is −0.25 V in 1 mM DPBS. The difference in current before and after the addition of 20 μM H2O2 is displayed and shows the large differnece in current when the assay is fully complementary. (c) Graphs show results for a set of samples run in the tornado with (d), graphs showing raw data from tornado for all three miRNAs for a representative sample from each group. Note, that the result for tornado follows closely the abundance of the three miRNAs determined by dPCR.
Recently, electrochemical approaches capable of detecting ultralow concentration of miRNAs in blood have been developed [38,48]. We examined the generated electrical signal from miRNA-probe interaction using tornado for the three chosen miRNAs and in samples that were used for miRNA copy number analysis (Fig. 4b, c). Using this approach we were able to assay the three miRNAs simultaneously, typically within 1.5 h of applying the plasma sample.
The tornado results were highly consistent with the dPCR, with a lower signal for miR-27a-3p in TLE plasma compared to the level in control and PNES samples. A similar trend to dPCR was also observed for tornado results on miR-328-3p in TLE plasma (Fig. 4b-d). Thus, tornado can rapidly and simultaneously assay plasma levels of three miRNAs with comparable results to Taqman/PCR-based miRNA assays.
3.5.3. miRNA carriage mechanism affects biomarker performance
The form in which miRNAs are transported in plasma has been shown to differ between neurological diseases and so have diagnostic and mechanistic value [21]. For example, exosome-enclosed miRNA may reflect controlled release (i.e. paracrine signaling) mechanisms which correspond to different cellular contributions to patho-mechanisms, creating opportunities for greater diagnostic specificity. We therefore processed a sub-set of plasma samples from controls and TLE patients (baseline and after seizure) for analysis of the miRNAs in the exosome-enriched microvesicle fraction and AGO2 (protein-bound) form and compared to the total miRNA levels (Fig. 5a).
Fig. 5.

Analysis of the mechanism of miRNA transport in plasma increases diagnostic yield.(a) Schematic showing study design. A subset of plasma samples were processed to assess total, exosomal and AGO2-bound miRNA. (b) Graphs show miRNA expression within exosomal and AGO2-bound fractions relative to the total for each of the three miRNAs. Note that a majority of the miRNA was detected in the exosomal fraction. Also, the relative fraction of miR-328-3p in the AGO2 fraction selectively increased in samples obtained after seizures relative to baseline. (c) ROC plots of the exosomal data for TLE compared to controls. Note, combinations of exosomal miRNAs resulted in higher biomarker performance.
Overall, a greater portion of miRNA was recovered from the exosomal fraction compared to AGO2-bound (Fig. 5b). ROC assessment of the sensitivity and specificity of the levels of miRNA in these fractions showed a strong performance to differentiate EBS samples from controls. This was highest for the exosome-derived miRNA levels, with an AUC of 0.83 and 0.85 for miR-27a-3p and miR-328-3p, respectively (Fig. 5c and Supplementary Fig. S6). Binomial logistic regression showed that combining all three resulted in an AUC of 0.93 (Fig. 5c). Biomarker performance was generally lower for AGO2-bound miRNA to distinguish EBS samples from controls, with AUC ranging from 0.6 (miR-654-3p) to 0.69 (miR-27a-3p) for individual miRNAs (Supplementary Fig. S6). Binomial logistic regression showed that combining all three from the AGO2 pool resulted in an AUC of 0.82 (Supplementary Fig. S6).
Analysis of the performance of the three miRNAs in the exosome fraction using post-seizure samples (EAS) generated AUC results ranging from 0.71 (miR-653-3p) to 0.85 (miR-328-3p), although the combination of all three miRNAs in the exosome fraction achieved an AUC of 0.86 (Supplementary Fig. S6). Interestingly, a shift toward the AGO2-bound form was noted in EAS samples. This shift was significant for miR-328-3p where the fraction bound to AGO2 increased from ~20 to 40% in EAS samples (Fig. 5a, b). As a result, the best means of discriminating post-seizure samples from baseline within epilepsy patients (i.e. a seizure biomarker) was by analysis of the AGO2-bound fraction, with AUC of 0.86 (for combination of all three miRNAs) (Fig. 5c). Thus, analysis of miRNA within specific pools in the circulation potentially offers superior diagnostic accuracy either to discriminate patients from controls or for diagnosis of a recent seizure.
3.5.4. Cellular localization of plasma miRNA biomarkers in human brain
To establish mechanistic links between the three miRNAs and epilepsy we interrogated a human miRNA expression atlas [10]. This showed that miR-27a-3p is expressed at low level across multiple brain regions. miR-328-3p is also expressed across multiple brain regions but was most enriched in spleen. miR-654-3p is brain-enriched, although also expressed in spleen. To support these insights we performed in situ hybridization for all three miRNAs using tissue sections prepared from surgically-resected hippocampus from patients with intractable epilepsy. These analyses revealed clear neuronal expression of miR-27a-3p and miR-328-3p (Fig. 6). Notably, the signal was often detected within the nucleus (Fig. 6), as reported previously for several epilepsy-altered miRNAs in similar material [49,50]. We did not obtain a reliable in situ signal for miR-654-3p.
Fig. 6.
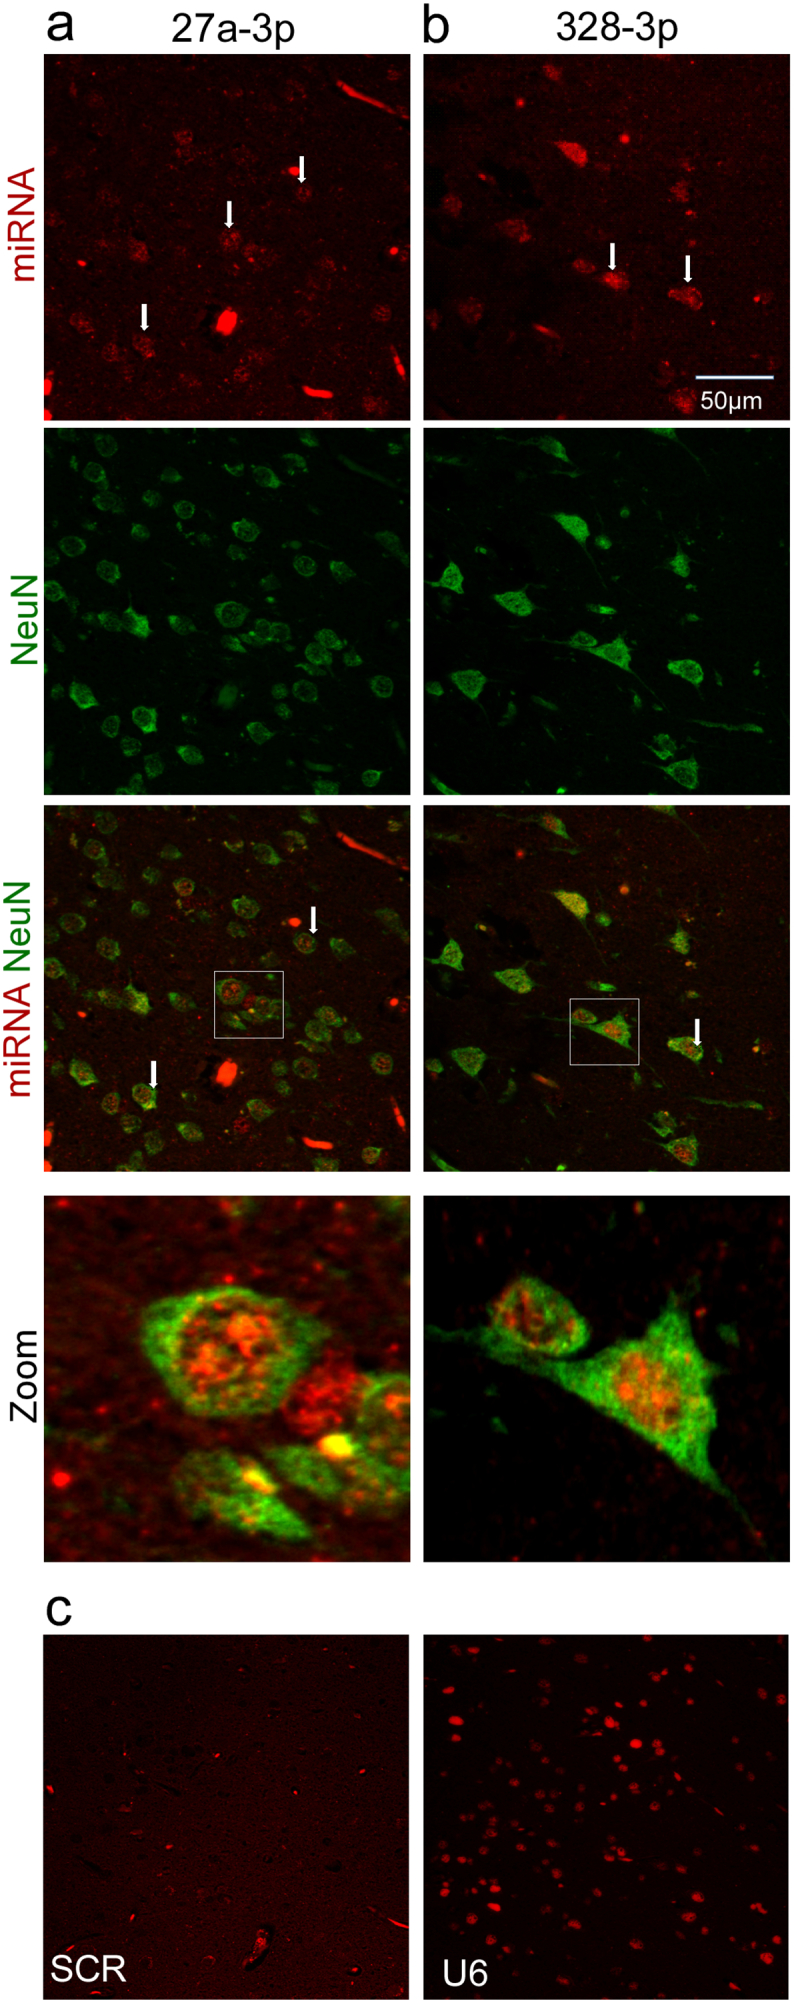
Cellular localization of miR-27a-3p and miR-328-3p in human brain. (a, b) Panels show in situ hybridization for miR-27a-3p and miR-328-3p in human hippocampal tissue sections from TLE patients. Note neuronal localization of both miRNAs and nuclear localization. (c) Specificity controls showing absence of staining with a scrambled probe and staining for U6 as a positive control.
3.5.5. Targets and pathways under control of miR-27a-3p, miR-328-3p and miR-654-3p
Finally, we performed in silico analysis of the experimentally-validated and predicted targets, and the pathways in which they function. miR-27a-3p had the most targets, with fewer targets for miR-328-3p and miR-654-3p (Fig. 7a). Among these targets were numerous genes associated with epilepsy (Supplementary Table S4), including experimentally validated targets such as ATP-binding cassette drug transporters (ABCG2 and ABCA1), glutamate transporter SLC7A11 and TP53 which encodes the p53 tumour suppressor protein. GLRA2, a glycine receptor subunit whose expression is elevated in the brain, has been associated with epilepsy and is targeted by both miR-654-3p and miR-27a-3p. Pathway analysis of these target genes revealed that 5/12 significantly enriched pathways related to growth factor signaling (Fig. 7b), including epidermal and insulin growth factors EGFR and IGF1. Targets and pathways associated with Ras and PI3K-Akt-FoxO signaling were also identified, which are direct mediators of growth factor signaling and are linked to epilepsy [1,3,51] (Fig. 7a,b).
Fig. 7.

Targets and pathways regulated by miRNA biomarkers of epilepsy.(a) Chord diagram showing the validated and predicted targets of hsa-miR-27a-3p, hsa-miR-328-3p and hsa-miR-654-3p. The three miRNA and their mRNA targets are represented by coloured sectors around the outside of the circle. The two outer ‘orbits’ highlight transcription factors (inner grey sectors) and mRNA targets that have been associated with epilepsy (outer red sectors). Sectors are linked if a miRNA-target interaction (MTI) has been demonstrated between the miRNA and mRNA target. MTIs that have been validated with ‘strong evidence’ as classified by miRTarBase are highlighted by links with black borders. The width of each link corresponds to the MTI score associated with that link, as described in the Methods (MTIs with wider links have higher scores). (b) Bar chart showing the -log10(adjusted p-value) of significantly enriched (adjusted p-value <.001) PANTHER pathways for the 95 targets shown in (A). The number of targets in each pathway relative to the total number of proteins in that pathway is shown in parentheses.
4. Discussion
The present study identifies a set of circulating miRNAs that represent potential molecular biomarkers of epilepsy. Our study featured a dual-center, dual-platform approach to discover TLE biomarkers followed by interrogation of three miRNAs in a large cohort of samples that included patients with other forms of epilepsy. These investigations provide evidence of discriminatory value in PNES patients, copy number assessment, neuronal expression, conservation of plasma miRNA differences in an animal model of epilepsy, and analysis of extracellular carriage mechanisms, and show that these biomarkers can be quantified using a prototype electrochemical sample-to-answer device. Together, the results support plasma miRNAs as an important class of molecular biomarker to support the diagnosis of epilepsy.
The identification of one or more molecular biomarker that could be reliably detected in a convenient biofluid such as blood would transform epilepsy diagnosis [3,13]. miRNAs are among the leading candidates in this regard with recent studies reporting miRNA biomarkers of epilepsy in serum, plasma and cerebrospinal fluid [[16], [17], [18], [19], [20], [21]]. The present study represents an important advance on earlier work and supports the biomarker potential of circulating miRNAs, as well as opportunities for further progress. We focused on plasma because it is a more readily available biofluid than cerebrospinal fluid while avoiding clotting-related events in serum that can introduce variability to miRNA profiles [52,53]. A key advance was to perform genome-wide analysis and a dual-platform, dual-center approach during miRNA discovery to avoid the limitations of reliance on a single platform [22,23,25], single clinical cohort or profiling using individual [19,21] or pooled-only samples [16]. We detected the highest numbers of circulating miRNAs using RNA-seq, as expected, but the OpenArray platform performed well, identifying high numbers of miRNAs known to be abundant in plasma [26,27]. Consistent with our expectations and as noted by others [25], we found few differentially expressed miRNAs to be shared across platforms and clinical cohorts, necessitating selection of miRNAs for validation from both OpenArray and RNAseq datasets. We selected a larger number of miRNAs to take forward for validation than previous epilepsy miRNA biomarker studies [[16], [17], [18], [19], [20], [21]] and found most, but not all, validated when analyzed individually using the discovery cohort samples. This led us to focus on three miRNAs that showed potential as epilepsy biomarkers based on consistent and robust differences in patients compared to controls, responses to acute seizures and cell-of-origin links to the brain according to tissue expression [10].
None of the three miRNAs we selected for extended validation have been previously focused on as epilepsy biomarkers [[16], [17], [18], [19], [20], [21]], suggesting our approach to discovery can identify novel biomarkers. Moreover, these miRNAs came from both OpenArray profiling and RNA-seq, supporting the benefit of using two platforms for discovery, which has also been successful when applied to brain tissue from TLE patients [23]. The ROC analysis of sensitivity and specificity of miR-27a-3p, miR-328-3p and miR-654-3p as epilepsy biomarkers supported good performance to distinguish TLE patients from healthy controls as well as some ability to discriminate between TLE and GGE patients. Combinations of the three miRNA provided some further discriminatory value consistent with our findings in cerebrospinal fluid [21] and reports by other groups that used miRNA combinations [17,18]. These ROC results were superior to some but not all previous findings [17,18,20] suggesting additional studies may be necessary to identify optimal individual or combinatorial blood-based miRNA biomarkers of epilepsies. However, several of the previously identified miRNAs in epilepsy biomarker studies [17,20] are unlikely to be bona fide miRNAs [54], are too ubiquitous in blood [18] or are not expressed in the brain [10]. All three miRNAs we selected for extended validation were dysregulated in experimentally-induced epilepsy in mice and plasma levels were not altered by dosing animals with two different anticonvulsant drugs, excluding common sources of bias such as medication. Moreover, an oligonucleotide-based miRNA inhibitor partially corrected plasma levels of the miRNAs in mice, supporting their responsiveness to a disease-modifying therapy [37]. This suggests these or other miRNAs may have prognostic value or use as biomarkers in clinical trials of anti-epileptogenic therapies.
Our study included the first analysis of miRNAs in plasma from PNES patients. It also featured the largest cohort of TLE patient plasma samples analyzed to date during the validation phase [[16], [17], [18], [19], [20]] and only one other study has used comparable numbers of epilepsy patient samples [17]. Psychogenic non-epileptic seizures are difficult to diagnose without EMU monitoring and many PNES patients are treated with anti-seizure medicines for prolonged periods [5,6]. Levels of the three miRNAs were not different to control in PNES patient plasma indicating that PNES patients could potentially be distinguished from TLE patients by comparing levels of one or other miRNA to reference control plasma.
There are additional mechanistic links between the miRNAs subject to extended validation and epilepsy. For example, miR-27a-3p is upregulated in seizure-damaged hippocampus after experimental status epilepticus in mice [36] and is one of several miRNAs under epigenetic influence by DNA methylation in the hippocampus of patients with TLE [55]. Other studies have reported altered miR-27a-3p levels in TLE patient brain samples [49] and animal models [56], as confirmed by a recent meta-analysis of miRNAs dysregulated in epilepsy [14]. Additional findings here increase confidence that altered plasma miR-27a-3p is a TLE biomarker. We found that miR-27a-3p is expressed by hippocampal neurons in tissue sections from TLE patients, where the signal mainly localized to the nucleus. This nuclear localization has been previously reported for other miRNAs in TLE samples and may reflect altered processing [57] or targets of the miRNA [49,50]. There is evidence linking miR-328-3p to epilepsy in animal studies [58,59] although this miRNA has not appeared in previous human studies [15]. miR-654-3p is brain-enriched [10] but has not previously been linked to epilepsy or other neurological disorders. However, miR-654-3p levels fell below the limits of detection in some of our validation studies, questioning its potential as an epilepsy biomarker. We did not detect differential expression of several miRNAs previously reported as biomarkers of epilepsy [16,17]. This highlights the need for additional validation of miRNA biomarkers but also supports our approach which may more reliably identify biomarkers than previous study designs. Finally, bioinformatics analysis of the targets of the three miRNAs identified pathways with established links to brain excitability and epilepsy, including prominent enrichment of growth factor signaling [3]. Apoptosis-associated signaling proteins such as p53 were also targets of the miRNAs. This is mechanistically relevant because p53 is over-expressed in sclerotic hippocampus from patients with TLE [60] and genetic manipulation of p53 influences both seizure susceptibility and neuropathological outcomes in animal models [61]. There was strong overlap between the pathways under the control of these miRNAs and pathways linked to miRNA biomarkers identified in cerebrospinal fluid [21]. Other pathways reportedly under miRNA control in epilepsy were not associated with these three miRNAs [13,14,23] suggesting not all epilepsy-associated pathophysiological processes are represented among the circulating pool of miRNA biomarkers.
The miRNAs which underwent extended validation are brain expressed but not exclusively. Thus, the altered circulating miRNAs may be due to other systemic factors altered in epilepsy. For example, circulating immune cells exposed locally to epileptic tissue via breaches in blood-brain barrier or other mechanisms may influence plasma miRNA profiles. Seizures, their co-morbidities and treatment have effects on organs besides the brain and, notably, higher levels of miR-122, a liver-specific miRNA was evident in our discovery dataset. It is perhaps surprising that the best-performing miRNA biomarkers were at lower levels in TLE patients compared to controls. This runs contrary to the assumed higher levels that would be expected if the appearance of plasma miRNAs resulted from trafficking from brain into circulation. The mechanism (s) of their release and composition may therefore represent a complex relationship to underlying pathophysiology. The mechanism by which miRNAs become extracellular and enter the circulating biofluid pool is through a combination of passive and active (e.g. secreted) pathways [9,21]. Assessment of this distribution therefore provides both mechanistic links and opportunities to enhance biomarker specificity as neurological diseases have common but also distinct combinations of neuronal injury, gliosis, other pathophysiological changes and perturbations of the cerebrovasculature [51,62]. This could produce unique combinations of release mechanisms that, if possible to measure in biofluids, could further enhance biomarker potential. Notably, analysis of miRNA trafficking mechanisms in cerebrospinal fluid found higher AGO2-bound miRNA in status epilepticus samples than other neurological diseases while chronic neurological diseases showed higher exosome miRNA content [21]. We found the exosome-enriched microvesicle pool contained the greater fraction for each of the tested plasma miRNAs suggesting secreted forms may be the dominate mechanism of transfer in epilepsy although technical factors such as efficiency of miRNA recovery cannot be excluded. Moreover, when the combined levels of the three miRNAs were examined in exosomes we achieved an AUC of 0.93, which is excellent for a biomarker. This extends a recent study that reported a set of miRNAs with favorable sensitivity and specificity in plasma exosomes from patients with epilepsy [20]. The present study also identifies plasma miRNAs that change after seizures. This would be particularly beneficial if the same miRNA did not change following an event in a PNES patient. Changes to miRNA levels have been reported after generalized tonic-clonic seizures but mainly immediately after the seizure and likely related to systemic factors [19]. We found that AGO2-bound miR-328-3p was increased in post-seizure samples, indicating a potential seizure biomarker. Since in situ hybridization revealed miR-328-3p to be mainly neuronal, the increased AGO2-bound form in plasma might have occurred due to injury-induced release. While it is unclear why a similar change was not observed for miR-27a-3p, our results demonstrate that analysis of the circulating forms of extracellular miRNA may increase the diagnostic yield and could be incorporated into future studies profiling biofluids obtained before and after seizures.
It is worthwhile to compare the performance of these miRNA biomarkers to non-RNA-based alternatives. Isoforms of high mobility group box 1 (HMGB1) are among the best-performing protein biomarkers of epilepsy [8]. However, HMGB1 is a ubiquitous molecule and elevated in the blood in neurological and non-neurological disease states [63]. Adoption of a molecular biomarker of epilepsy must also factor how it would be assayed in the clinical setting. Protein isoform detection and quantification requires off-line mass spectrometry which is technically challenging and time-consuming [8]. Here, we report a proof-of-principle microfluidic device that could be a prototype of a simple point-of-care test or assay for the biomarkers of interest allowing the concentrations of these biomarkers to be tracked over time. Such approaches represent the next generation point-of-care devices and as co-developed here, will accelerate the move from discovery of miRNA biomarkers of epilepsy toward clinical application. The technique used here termed tornado was able to rapidly (1.5 h) detect three miRNAs. The tornado results closely matched previous work using the device to detect miR-134-5p [38], which is also linked to epilepsy, and correlated well with the copy number data on the same samples. Further advances and calibration of this device may provide a promising direction for a future clinical test.
There are a number of limitations to consider in interpretation of the present study. We do not know how generalizable our findings are since the patients were enrolled from a limited number of sites. Anti-seizure medication is a potential confounder that was not controlled for presently. We cannot claim that the miRNAs studied here are diagnostic for TLE as levels were generally similar in other epilepsies. We did not explore whether miRNA profiles differed according to antecedents of TLE such as complex prolonged febrile seizures or trauma. Group sizes for the other forms of epilepsy in the validation cohorts and experiments using the tornado device and animal model were small and possibly underpowered to detect significant effects. Our use of a single time point for post-seizure sampling is restrictive and it will be important to include serial sampling in the future. We did not adjust for time-of-day sampling or food ingested which could affect miRNA profiles [64]. Last, we did not identify associations between the miRNA levels and seizure burden or other clinical parameters including the presence or absence of hippocampal sclerosis.
In conclusion, by using a dual-center, dual-platform genome-wide approach to profiling and including an extensive set of validation steps we have identified a set of circulating miRNAs which may be biomarkers of epilepsy and assist differential diagnosis in patients with PNES. We demonstrate a technique for their rapid detection and plausible mechanistic links through their neuronal cellular localization, extracellular carriage, conserved responses in an animal model of epilepsy and the signaling pathways in which they operate. Although further efforts are required to identify better biomarkers of acute seizures, these and other circulating plasma miRNAs are promising diagnostic biomarkers.
The following are the supplementary data related to this article.
Detection of miRNAs in individual samples (Ct < 25 threshold) by centre. Graphs show numbers of miRNAs called present for each sample (n = 16 per group) after standard Ct filtering for the two clinical Centres.
Individual miRNA assay confirmation of profiling data. Graphs show results of individual Taqman assays for the five miRNAs identified by OA profiling to be significantly dysregulated in one or both TLE samples compared to healthy controls. (* =adj p-value<0.05; **= adj. p-value <0.01; ***= adj. p-value <0.001). Note: lower ct indicates higher expression. n = 32 per group.
a Performance of dysregulated miRNAs as TLE biomarkers using original samples from Discovery (OpenArray-selected). Graphs showing AUC results from ROC analysis of the five miRNAs selected from the OpenArray individual sample Discovery profiling. Blue boxes highlight two of the highest performing miRNAs as biomarkers of seizures in epilepsy patients. C, Control; EBS, Epilepsy-baseline sample; EAS, Epilepsy-after seizure sample (n = 32 per group).
Additional ROC graphs showing statistical performance of the miRNAs to discriminate different forms of epilepsy using full validation cohort. ROC analysis of additional individual miRNAs for which plasma levels were determined in the full cohort and, using binomial logistic regression, combinations of miRNAs.
Additional responses of the miRNAs in an animal model of adult TLE and response to anti-epileptic drugs and disease-modifying therapies. a). Overview of experiment and graph showing results of analysis of miR-654-3p in plasma from epileptic mice. Note, lower expression in Epi samples consistent with human findings. Treatment with CBX (carbamazepine) or diazepam (DZM) did not strongly affect miRNA levels. * p < 0.05 vs. control. b). Overview of experiment and data for miR-328-3p. Although expression of miR-328-3p was lower in epileptic mice as expected, levels of this miRNA were not recovered by the disease-modifying therapy.
Additional ROC analysis showing performance of the individual and combined miRNAs in Exo and AGO2 fractions. Table and representative graphs showing AUC results from ROC analysis of the Exosomal (Exo) and AGO2 fractions for the three miRNAs and various combinations thereof. Note, Exo fractions generally yielded superior results when comparing baseline samples to controls but the AGO2 fraction performs best when distinguishing before and after seizure samples in patients.
Patient demographics, diagnosis, drug therapy and the origin of each sample
Most abundant miRNAs detected in plasma during miRNA profiling
Statistical analysis (p values) for validation of the three miRNAs in the full cohort for each group compared to controls and each other.
Targets of miRNA biomarkers used in bioinformatics studies
Extended (complete) miRNA expression profiling data sets
Acknowledgments
Acknowledgements
Foremost, we thank the patients and their families for their cooperation and participation in this study. We thank Ilka Immisch, MD and Petra Mueller for clinical support and Lisa Anne Byrne for support with ethics. We would like to thank Donncha O'Brien and Michael Farrell for provision of tissue sections for in situ hybridization.
Funding sources
This publication has emanated from research conducted with the financial support of the European Union's ‘Seventh Framework’ Programme (FP7) under Grant Agreement no. 602130. Additional support was from Science Foundation Ireland (SFI) under grants SFI/13/IA/1891, SFI/14/ADV/RC2721, 12/COEN/18 and 12/RC/2272. Additionally, this publication has emanated from research supported in part by a research grant from Science Foundation Ireland (SFI) under Grant Number 16/RC/3948 and co-funded under the European Regional Development Fund and by FutureNeuro industry partners. Additional funding support was from Citizens United for Research in Epilepsy, the Detlev-Wrobel-Fonds for Epilepsy Research Frankfurt and a fellowship from the Iraqi Ministry of Higher Education and Scientific Research. The funders had no role in study design, data collection and analysis, decision to publish, or preparation of the manuscript. The corresponding author (DCH) confirms that he had full access to all the data in the study and had final responsibility for the decision to submit for publication.
Declaration of Interests
Dr. Raoof reports grants from Iraqi Ministry of Higher Education and Scientific Research, during the conduct of the study; Dr. Bauer reports grants from European Union's FP7 (Grant 602,130), during the conduct of the study; Dr. El-Naggar reports grants from European Union's FP7 (Grant 602,130), grants from Science Foundation Ireland (Grant SFI/13/IA/1891, SFI/16/RC/3948), during the conduct of the study; Dr. Connolly has nothing to disclose; Dr. Brennan reports grants from Citizens United for Research in Epilepsy, during the conduct of the study; Ms. Brindley has nothing to disclose; Dr. Hill reports grants from European Union's FP7 (602130), grants from Science Foundation Ireland (SFI/13/IA/1891), during the conduct of the study; Dr. McArdle has nothing to disclose; Dr. Spain has nothing to disclose; Dr. Forster has nothing to disclose; Dr. Prehn reports grants from European Union's FP7 (602130), grants from Science Foundation Ireland (12/COEN/18), during the conduct of the study; Dr. Hamer reports grants from European Union's FP7 (602130), during the conduct of the study; personal fees from UCB, personal fees from Desitin, personal fees from Eisai, personal fees from Cerbomed, personal fees from Novartis, personal fees from IQWiG, personal fees from Hexal, personal fees from Ingelheim Boehringer, personal fees from Bial, outside the submitted work; Dr. Delanty reports grants from European Union's FP7 (602130), grants from Science Foundation Ireland (SFI/13/IA/1891), during the conduct of the study; Dr. Rosenow reports grants from European Union's FP7 (602130), grants from Detlev-Wrobel-Fonds for Epilepsy Research, during the conduct of the study; personal fees from UCB Pharma, personal fees from EISAI, personal fees from Novartis, personal fees from Desitin Arzneimittel, personal fees from Bial, personal fees from cerbomed, personal fees and other from GW Pharma, other from Medtronic, personal fees from Shire, personal fees from Sandoz, outside the submitted work; Dr. Mooney reports grants from Science Foundation Ireland (SFI/14/ADV/RC2721), during the conduct of the study; Dr. Henshall reports grants from European Union's FP7 (602130), grants from Science Foundation Ireland (SFI/13/IA/1891, SFI/14/ADV/RC2721, 12/RC/2272 and SFI/16/RC/3948), during the conduct of the study; In addition, Dr. Henshall has a patent awarded on the use of a microRNA-134 inhibitor for the treatment of epilepsy. US patent No. US 9,803,200 B2 “Inhibition of microRNA-134 for the treatment of seizure-related disorders and neurologic injuries”. issued.
Author contributions
RR performed RNA extractions, profiling and validation studies and literature searches. SB, HEN, HH, ND and FR collected clinical samples and clinical data. NMCC and JHMP performed bioinformatics studies. GPB and TH performed rodent studies. EB performed exosome and AGO2 analyses. HM, ES and RJF developed the electrochemical detector tornado and tested plasma samples. CM analyzed OpenArray data and performed statistical testing. RR, CM and DCH designed the study and wrote the manuscript.
References
- 1.Moshe S.L., Perucca E., Ryvlin P., Tomson T. Epilepsy: New advances. Lancet. 2015;385:884–898. doi: 10.1016/S0140-6736(14)60456-6. [DOI] [PubMed] [Google Scholar]
- 2.Engel J., Jr., Pitkanen A., Loeb J.A., Edward Dudek F., Bertram E.H., III, Cole A.J. Epilepsy biomarkers. Epilepsia. 2013;54 Suppl 4:61–69. doi: 10.1111/epi.12299. [DOI] [PMC free article] [PubMed] [Google Scholar]
- 3.Walker L.E., Janigro D., Heinemann U., Riikonen R., Bernard C., Patel M. WONOEP appraisal: Molecular and cellular biomarkers for epilepsy. Epilepsia. 2016;57:1354–1362. doi: 10.1111/epi.13460. [DOI] [PMC free article] [PubMed] [Google Scholar]
- 4.Muhlhofer W., Tan Y.L., Mueller S.G., Knowlton R. MRI-negative temporal lobe epilepsy-what do we know? Epilepsia. 2017;58:727–742. doi: 10.1111/epi.13699. [DOI] [PubMed] [Google Scholar]
- 5.Chowdhury F.A., Nashef L., Elwes R.D. Misdiagnosis in epilepsy: A review and recognition of diagnostic uncertainty. Eur. J. Neurol. 2008;15:1034–1042. doi: 10.1111/j.1468-1331.2008.02260.x. [DOI] [PubMed] [Google Scholar]
- 6.Brown R.J., Syed T.U., Benbadis S., Lafrance W.C., Jr., Reuber M. Psychogenic nonepileptic seizures. Epilepsy Behav. 2011;22:85–93. doi: 10.1016/j.yebeh.2011.02.016. [DOI] [PubMed] [Google Scholar]
- 7.Pitkanen A., Loscher W., Vezzani A., Becker A.J., Simonato M., Lukasiuk K. Advances in the development of biomarkers for epilepsy. Lancet Neurol. 2016;15:843–856. doi: 10.1016/S1474-4422(16)00112-5. [DOI] [PubMed] [Google Scholar]
- 8.Walker L.E., Frigerio F., Ravizza T., Ricci E., Tse K., Jenkins R.E. Molecular isoforms of high-mobility group box 1 are mechanistic biomarkers for epilepsy. J. Clin. Invest. 2017;127:2118–2132. doi: 10.1172/JCI92001. [DOI] [PMC free article] [PubMed] [Google Scholar] [Retracted]
- 9.Rao P., Benito E., Fischer A. MicroRNAs as biomarkers for CNS disease. Front. Mol. Neurosci. 2013;6:39. doi: 10.3389/fnmol.2013.00039. [DOI] [PMC free article] [PubMed] [Google Scholar]
- 10.Ludwig N., Leidinger P., Becker K., Backes C., Fehlmann T., Pallasch C. Distribution of miRNA expression across human tissues. Nucleic Acids Res. 2016;44:3865–3877. doi: 10.1093/nar/gkw116. [DOI] [PMC free article] [PubMed] [Google Scholar]
- 11.Jovicic A., Roshan R., Moisoi N., Pradervand S., Moser R., Pillai B. Comprehensive expression analyses of neural cell-type-specific miRNAs identify new determinants of the specification and maintenance of neuronal phenotypes. J. Neurosci. 2013;33:5127–5137. doi: 10.1523/JNEUROSCI.0600-12.2013. [DOI] [PMC free article] [PubMed] [Google Scholar]
- 12.Hunt E.A., Broyles D., Head T., Deo S.K. MicroRNA detection: Current technology and research strategies. Annu Rev Anal Chem (Palo Alto, Calif) 2015;8:217–237. doi: 10.1146/annurev-anchem-071114-040343. [DOI] [PubMed] [Google Scholar]
- 13.Henshall D.C., Hamer H.M., Pasterkamp R.J., Goldstein D.B., Kjems J., Prehn J.H. MicroRNAs in epilepsy: Pathophysiology and clinical utility. Lancet Neurol. 2016;15:1368–1376. doi: 10.1016/S1474-4422(16)30246-0. [DOI] [PubMed] [Google Scholar]
- 14.Korotkov A., Mills J.D., Gorter J.A., van Vliet E.A., Aronica E. Systematic review and meta-analysis of differentially expressed miRNAs in experimental and human temporal lobe epilepsy. Sci. Rep. 2017;7:11592. doi: 10.1038/s41598-017-11510-8. [DOI] [PMC free article] [PubMed] [Google Scholar]
- 15.Mooney C., Becker B.A., Raoof R., Henshall D.C. EpimiRBase: a comprehensive database of microRNA-epilepsy associations. Bioinformatics. 2016;32:1436–1438. doi: 10.1093/bioinformatics/btw008. [DOI] [PubMed] [Google Scholar]
- 16.Wang J., Yu J.T., Tan L., Tian Y., Ma J., Tan C.C. Genome-wide circulating microRNA expression profiling indicates biomarkers for epilepsy. Sci. Rep. 2015;5:9522. doi: 10.1038/srep09522. [DOI] [PMC free article] [PubMed] [Google Scholar]
- 17.Wang J., Tan L., Tan L., Tian Y., Ma J., Tan C.C. Circulating microRNAs are promising novel biomarkers for drug-resistant epilepsy. Sci. Rep. 2015;5:10201. doi: 10.1038/srep10201. [DOI] [PMC free article] [PubMed] [Google Scholar]
- 18.An N., Zhao W., Liu Y., Yang X., Chen P. Elevated serum miR-106b and miR-146a in patients with focal and generalized epilepsy. Epilepsy Res. 2016;127:311–316. doi: 10.1016/j.eplepsyres.2016.09.019. [DOI] [PubMed] [Google Scholar]
- 19.Surges R., Kretschmann A., Abnaof K., van Rikxoort M., Ridder K., Frohlich H. Changes in serum miRNAs following generalized convulsive seizures in human mesial temporal lobe epilepsy. Biochem. Biophys. Res. Commun. 2016;481:13–18. doi: 10.1016/j.bbrc.2016.11.029. [DOI] [PubMed] [Google Scholar]
- 20.Yan S., Zhang H., Xie W., Meng F., Zhang K., Jiang Y. Altered microRNA profiles in plasma exosomes from mesial temporal lobe epilepsy with hippocampal sclerosis. Oncotarget. 2017;8:4136–4146. doi: 10.18632/oncotarget.13744. [DOI] [PMC free article] [PubMed] [Google Scholar]
- 21.Raoof R., Jimenez-Mateos E.M., Bauer S., Tackenberg B., Rosenow F., Lang J. Cerebrospinal fluid microRNAs are potential biomarkers of temporal lobe epilepsy and status epilepticus. Sci. Rep. 2017;7:3328. doi: 10.1038/s41598-017-02969-6. [DOI] [PMC free article] [PubMed] [Google Scholar]
- 22.Mestdagh P., Hartmann N., Baeriswyl L., Andreasen D., Bernard N., Chen C. Evaluation of quantitative miRNA expression platforms in the microRNA quality control (miRQC) study. Nat. Methods. 2014;11:809–815. doi: 10.1038/nmeth.3014. [DOI] [PubMed] [Google Scholar]
- 23.Bencurova P., Baloun J., Musilova K., Radova L., Tichy B., Pail M. MicroRNA and mesial temporal lobe epilepsy with hippocampal sclerosis: Whole miRNome profiling of human hippocampus. Epilepsia. 2017;58:1782–1793. doi: 10.1111/epi.13870. [DOI] [PubMed] [Google Scholar]
- 24.Peterson S.M., Thompson J.A., Ufkin M.L., Sathyanarayana P., Liaw L., Congdon C.B. Common features of microRNA target prediction tools. Front. Genet. 2014;5:23. doi: 10.3389/fgene.2014.00023. [DOI] [PMC free article] [PubMed] [Google Scholar]
- 25.Pritchard C.C., Cheng H.H., Tewari M. MicroRNA profiling: Approaches and considerations. Nat. Rev. Genet. 2012;13:358–369. doi: 10.1038/nrg3198. [DOI] [PMC free article] [PubMed] [Google Scholar]
- 26.Cheng H.H., Yi H.S., Kim Y., Kroh E.M., Chien J.W., Eaton K.D. Plasma processing conditions substantially influence circulating microRNA biomarker levels. PLoS One. 2013;8:e64795. doi: 10.1371/journal.pone.0064795. [DOI] [PMC free article] [PubMed] [Google Scholar]
- 27.Mooney C., Raoof R., El-Naggar H., Sanz-Rodriguez A., Jimenez-Mateos E.M., Henshall D.C. High throughput qPCR expression profiling of circulating microRNAs reveals minimal sex- and sample timing-related variation in plasma of healthy volunteers. PLoS One. 2015;10:e0145316. doi: 10.1371/journal.pone.0145316. [DOI] [PMC free article] [PubMed] [Google Scholar]
- 28.Kirschner M.B., Kao S.C., Edelman J.J., Armstrong N.J., Vallely M.P., van Zandwijk N. Haemolysis during sample preparation alters microRNA content of plasma. PLoS One. 2011;6:e24145. doi: 10.1371/journal.pone.0024145. [DOI] [PMC free article] [PubMed] [Google Scholar]
- 29.El-Khoury V., Pierson S., Kaoma T., Bernardin F., Berchem G. Assessing cellular and circulating miRNA recovery: the impact of the RNA isolation method and the quantity of input material. Sci. Rep. 2016;6:19529. doi: 10.1038/srep19529. [DOI] [PMC free article] [PubMed] [Google Scholar]
- 30.Huber W., Carey V.J., Gentleman R., Anders S., Carlson M., Carvalho B.S. Orchestrating high-throughput genomic analysis with bioconductor. Nat. Methods. 2015;12:115–121. doi: 10.1038/nmeth.3252. [DOI] [PMC free article] [PubMed] [Google Scholar]
- 31.McCall M.N., McMurray H.R., Land H., Almudevar A. On non-detects in qPCR data. Bioinformatics. 2014;30:2310–2316. doi: 10.1093/bioinformatics/btu239. [DOI] [PMC free article] [PubMed] [Google Scholar]
- 32.Vandesompele J., De Preter K., Pattyn F., Poppe B., Van Roy N., De Paepe A. Accurate normalization of real-time quantitative RT-PCR data by geometric averaging of multiple internal control genes. Genome Biol. 2002;3 doi: 10.1186/gb-2002-3-7-research0034. (RESEARCH0034) [DOI] [PMC free article] [PubMed] [Google Scholar]
- 33.Benjamini Y., Hochberg Y. Controlling the false discovery rate: a practical and powerful approach to multiple testing. J R Stat Soc B Methodol. 1995;57:289–300. [Google Scholar]
- 34.Robinson M.D., McCarthy D.J., Smyth G.K. edgeR: A bioconductor package for differential expression analysis of digital gene expression data. Bioinformatics. 2010;26:139–140. doi: 10.1093/bioinformatics/btp616. [DOI] [PMC free article] [PubMed] [Google Scholar]
- 35.Robin X., Turck N., Hainard A., Tiberti N., Lisacek F., Sanchez J.C. pROC: An open-source package for R and S+ to analyze and compare ROC curves. BMC Bioinformatics. 2011;12:77. doi: 10.1186/1471-2105-12-77. [DOI] [PMC free article] [PubMed] [Google Scholar]
- 36.Jimenez-Mateos E.M., Bray I., Sanz-Rodriguez A., Engel T., McKiernan R.C., Mouri G. miRNA Expression profile after status epilepticus and hippocampal neuroprotection by targeting miR-132. Am. J. Pathol. 2011;179:2519–2532. doi: 10.1016/j.ajpath.2011.07.036. [DOI] [PMC free article] [PubMed] [Google Scholar]
- 37.Jimenez-Mateos E.M., Engel T., Merino-Serrais P., McKiernan R.C., Tanaka K., Mouri G. Silencing microRNA-134 produces neuroprotective and prolonged seizure-suppressive effects. Nat. Med. 2012;18:1087–1094. doi: 10.1038/nm.2834. [DOI] [PMC free article] [PubMed] [Google Scholar]
- 38.McArdle H., Jimenez-Mateos E.M., Raoof R., Carthy E., Boyle D., Elnaggar H. "TORNADO" - theranostic One-step RNA detector; microfluidic disc for the direct detection of microRNA-134 in plasma and cerebrospinal fluid. Sci. Rep. 2017;7:1750. doi: 10.1038/s41598-017-01947-2. [DOI] [PMC free article] [PubMed] [Google Scholar]
- 39.Kinahan D.J., Kearney S.M., Dimov N., Glynn M.T., Ducree J. Event-triggered logical flow control for comprehensive process integration of multi-step assays on centrifugal microfluidic platforms. Lab Chip. 2014;14:2249–2258. doi: 10.1039/c4lc00380b. [DOI] [PubMed] [Google Scholar]
- 40.Chou C.H., Chang N.W., Shrestha S., Hsu S.D., Lin Y.L., Lee W.H. miRTarBase 2016: Updates to the experimentally validated miRNA-target interactions database. Nucleic Acids Res. 2016;44:D239–D247. doi: 10.1093/nar/gkv1258. [DOI] [PMC free article] [PubMed] [Google Scholar]
- 41.Agarwal V., Bell G.W., Nam J.W., Bartel D.P. Predicting effective microRNA target sites in mammalian mRNAs. elife. 2015;4 doi: 10.7554/eLife.05005. [DOI] [PMC free article] [PubMed] [Google Scholar]
- 42.Wong N., Wang X. miRDB: an online resource for microRNA target prediction and functional annotations. Nucleic Acids Res. 2015;43:D146–D152. doi: 10.1093/nar/gku1104. [DOI] [PMC free article] [PubMed] [Google Scholar]
- 43.Gu Z., Gu L., Eils R., Schlesner M., Brors B. Circlize Implements and enhances circular visualization in R. Bioinformatics. 2014;30:2811–2812. doi: 10.1093/bioinformatics/btu393. [DOI] [PubMed] [Google Scholar]
- 44.Zhang H.M., Liu T., Liu C.J., Song S., Zhang X., Liu W. AnimalTFDB 2.0: A resource for expression, prediction and functional study of animal transcription factors. Nucleic Acids Res. 2015;43:D76–D81. doi: 10.1093/nar/gku887. [DOI] [PMC free article] [PubMed] [Google Scholar]
- 45.Kuleshov M.V., Jones M.R., Rouillard A.D., Fernandez N.F., Duan Q., Wang Z. Enrichr: a comprehensive gene set enrichment analysis web server 2016 update. Nucleic Acids Res. 2016;44:W90–W97. doi: 10.1093/nar/gkw377. [DOI] [PMC free article] [PubMed] [Google Scholar]
- 46.Mi H., Poudel S., Muruganujan A., Casagrande J.T., Thomas P.D. PANTHER version 10: Expanded protein families and functions, and analysis tools. Nucleic Acids Res. 2016;44:D336–D342. doi: 10.1093/nar/gkv1194. [DOI] [PMC free article] [PubMed] [Google Scholar]
- 47.Klein S., Bankstahl M., Loscher W. Inter-individual variation in the effect of antiepileptic drugs in the intrahippocampal kainate model of mesial temporal lobe epilepsy in mice. Neuropharmacology. 2015;90:53–62. doi: 10.1016/j.neuropharm.2014.11.008. [DOI] [PubMed] [Google Scholar]
- 48.Spain E., Jimenez-Mateos E.M., Raoof R., El Naggar H., Delanty N., Forster R.J. Direct, non-amplified detection of microRNA-134 in plasma from epilepsy patients. RSC Adv. 2015;5:90071–90078. [Google Scholar]
- 49.Kan A.A., van Erp S., Derijck A.A., de Wit M., Hessel E.V., O'Duibhir E. Genome-wide microRNA profiling of human temporal lobe epilepsy identifies modulators of the immune response. Cell. Mol. Life Sci. 2012;69:3127–3145. doi: 10.1007/s00018-012-0992-7. [DOI] [PMC free article] [PubMed] [Google Scholar]
- 50.Brennan G.P., Dey D., Chen Y., Patterson K.P., Magnetta E.J., Hall A.M. Dual and opposing roles of microRNA-124 in epilepsy are mediated through inflammatory and NRSF-dependent gene networks. Cell Rep. 2016;14:2402–2412. doi: 10.1016/j.celrep.2016.02.042. [DOI] [PMC free article] [PubMed] [Google Scholar]
- 51.Klein P., Dingledine R., Aronica E., Bernard C., Blumcke I., Boison D. 2017. Commonalities in epileptogenic processes from different acute brain insults: Do they translate? Epilepsia. [DOI] [PMC free article] [PubMed] [Google Scholar]
- 52.Wang K., Yuan Y., Cho J.H., McClarty S., Baxter D., Galas D.J. Comparing the MicroRNA spectrum between serum and plasma. PLoS One. 2012;7:e41561. doi: 10.1371/journal.pone.0041561. [DOI] [PMC free article] [PubMed] [Google Scholar]
- 53.van Vliet E.A., Puhakka N., Mills J.D., Srivastava P.K., Johnson M.R., Roncon P. Standardization procedure for plasma biomarker analysis in rat models of epileptogenesis: Focus on circulating microRNAs. Epilepsia. 2017;58:2013–2024. doi: 10.1111/epi.13915. [DOI] [PubMed] [Google Scholar]
- 54.Fromm B., Billipp T., Peck L.E., Johansen M., Tarver J.E., King B.L. A uniform system for the annotation of vertebrate microRNA genes and the evolution of the human microRNAome. Annu. Rev. Genet. 2015;49:213–242. doi: 10.1146/annurev-genet-120213-092023. [DOI] [PMC free article] [PubMed] [Google Scholar]
- 55.Miller-Delaney S.F., Bryan K., Das S., McKiernan R.C., Bray I.M., Reynolds J.P. Differential DNA methylation profiles of coding and non-coding genes define hippocampal sclerosis in human temporal lobe epilepsy. Brain. 2015;138:616–631. doi: 10.1093/brain/awu373. [DOI] [PMC free article] [PubMed] [Google Scholar]
- 56.Gorter J.A., Iyer A., White I., Colzi A., van Vliet E.A., Sisodiya S. Hippocampal subregion-specific microRNA expression during epileptogenesis in experimental temporal lobe epilepsy. Neurobiol. Dis. 2014;62:508–520. doi: 10.1016/j.nbd.2013.10.026. [DOI] [PubMed] [Google Scholar]
- 57.McKiernan R.C., Jimenez-Mateos E.M., Bray I., Engel T., Brennan G.P., Sano T. Reduced mature microRNA levels in association with dicer loss in human temporal lobe epilepsy with hippocampal sclerosis. PLoS One. 2012;7:e35921. doi: 10.1371/journal.pone.0035921. [DOI] [PMC free article] [PubMed] [Google Scholar]
- 58.Kretschmann A., Danis B., Andonovic L., Abnaof K., van Rikxoort M., Siegel F. Different microRNA profiles in chronic epilepsy versus acute seizure mouse models. J. Mol. Neurosci. 2015;55:466–479. doi: 10.1007/s12031-014-0368-6. [DOI] [PMC free article] [PubMed] [Google Scholar]
- 59.Risbud R.M., Porter B.E. Changes in microRNA expression in the whole hippocampus and hippocampal synaptoneurosome fraction following pilocarpine induced status epilepticus. PLoS One. 2013;8:e53464. doi: 10.1371/journal.pone.0053464. [DOI] [PMC free article] [PubMed] [Google Scholar]
- 60.Engel T., Murphy B.M., Schindler C.K., Henshall D.C. Elevated p53 and lower MDM2 expression in hippocampus from patients with intractable temporal lobe epilepsy. Epilepsy Res. 2007;77:151–156. doi: 10.1016/j.eplepsyres.2007.09.001. [DOI] [PMC free article] [PubMed] [Google Scholar]
- 61.Engel T., Tanaka K., Jimenez-Mateos E.M., Caballero-Caballero A., Prehn J.H., Henshall D.C. Loss of p53 results in protracted electrographic seizures and development of an aggravated epileptic phenotype following status epilepticus. Cell Death Dis. 2010;1:e79. doi: 10.1038/cddis.2010.55. [DOI] [PMC free article] [PubMed] [Google Scholar]
- 62.Liou A.K., Clark R.S., Henshall D.C., Yin X.M., Chen J. To die or not to die for neurons in ischemia, traumatic brain injury and epilepsy: a review on the stress-activated signaling pathways and apoptotic pathways. Prog. Neurobiol. 2003;69:103–142. doi: 10.1016/s0301-0082(03)00005-4. [DOI] [PubMed] [Google Scholar]
- 63.Venereau E., De Leo F., Mezzapelle R., Careccia G., Musco G., Bianchi M.E. HMGB1 as biomarker and drug target. Pharmacol. Res. 2016;111:534–544. doi: 10.1016/j.phrs.2016.06.031. [DOI] [PubMed] [Google Scholar]
- 64.Moldovan L., Batte K.E., Trgovcich J., Wisler J., Marsh C.B., Piper M. Methodological challenges in utilizing miRNAs as circulating biomarkers. J. Cell. Mol. Med. 2014;18:371–390. doi: 10.1111/jcmm.12236. [DOI] [PMC free article] [PubMed] [Google Scholar]
Associated Data
This section collects any data citations, data availability statements, or supplementary materials included in this article.
Supplementary Materials
Detection of miRNAs in individual samples (Ct < 25 threshold) by centre. Graphs show numbers of miRNAs called present for each sample (n = 16 per group) after standard Ct filtering for the two clinical Centres.
Individual miRNA assay confirmation of profiling data. Graphs show results of individual Taqman assays for the five miRNAs identified by OA profiling to be significantly dysregulated in one or both TLE samples compared to healthy controls. (* =adj p-value<0.05; **= adj. p-value <0.01; ***= adj. p-value <0.001). Note: lower ct indicates higher expression. n = 32 per group.
a Performance of dysregulated miRNAs as TLE biomarkers using original samples from Discovery (OpenArray-selected). Graphs showing AUC results from ROC analysis of the five miRNAs selected from the OpenArray individual sample Discovery profiling. Blue boxes highlight two of the highest performing miRNAs as biomarkers of seizures in epilepsy patients. C, Control; EBS, Epilepsy-baseline sample; EAS, Epilepsy-after seizure sample (n = 32 per group).
Additional ROC graphs showing statistical performance of the miRNAs to discriminate different forms of epilepsy using full validation cohort. ROC analysis of additional individual miRNAs for which plasma levels were determined in the full cohort and, using binomial logistic regression, combinations of miRNAs.
Additional responses of the miRNAs in an animal model of adult TLE and response to anti-epileptic drugs and disease-modifying therapies. a). Overview of experiment and graph showing results of analysis of miR-654-3p in plasma from epileptic mice. Note, lower expression in Epi samples consistent with human findings. Treatment with CBX (carbamazepine) or diazepam (DZM) did not strongly affect miRNA levels. * p < 0.05 vs. control. b). Overview of experiment and data for miR-328-3p. Although expression of miR-328-3p was lower in epileptic mice as expected, levels of this miRNA were not recovered by the disease-modifying therapy.
Additional ROC analysis showing performance of the individual and combined miRNAs in Exo and AGO2 fractions. Table and representative graphs showing AUC results from ROC analysis of the Exosomal (Exo) and AGO2 fractions for the three miRNAs and various combinations thereof. Note, Exo fractions generally yielded superior results when comparing baseline samples to controls but the AGO2 fraction performs best when distinguishing before and after seizure samples in patients.
Patient demographics, diagnosis, drug therapy and the origin of each sample
Most abundant miRNAs detected in plasma during miRNA profiling
Statistical analysis (p values) for validation of the three miRNAs in the full cohort for each group compared to controls and each other.
Targets of miRNA biomarkers used in bioinformatics studies
Extended (complete) miRNA expression profiling data sets