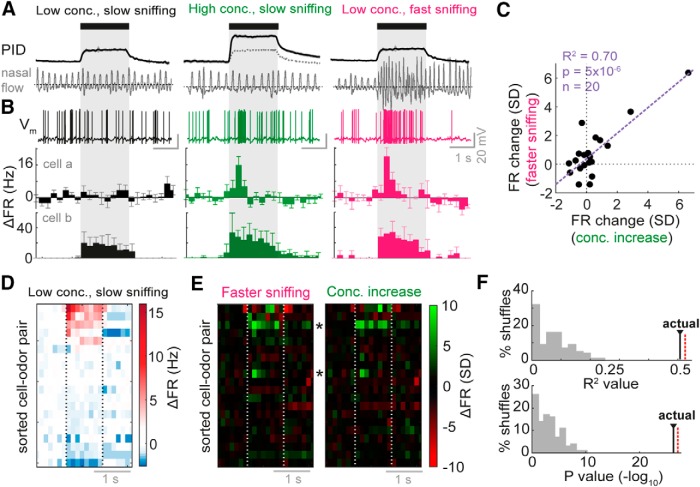
Figure 1.
Sniff change and concentration change have very similar effects on FR responses of MTCs. A, Stimulation paradigm during whole-cell recordings. PID traces show response of photoionization detector (magnitude proportional to odor concentration), while nasal flow traces show example sniffing behavior recorded using external flow sensor for the three types of trial. See Figs. 1-1 and 1-2 for details about sniff parameters. Black bar and gray box shows where odor is applied. B, Example odor responses recorded in each stimulus condition. Vm traces show example responses for cell a, while PSTHs below show averaged FR responses in 250 ms time bins for five trials in each case. Bottom-most PSTHs are calculated for a different example, cell b. Error bars show standard deviation (SD). All are aligned to first inhalation onset after odor onset. C, Scatter plot comparing mean FR response change for concentration change and sniff frequency change (normalized by the SD of baseline FR changes in the 2 s before odor stimulus for each cell-odor pair) across first second of odor stimulus. n = 20 cell-odor pairs. D, Heatmap of average FR responses for all cell odor pairs in the low concentration, slow sniff frequency condition, ordered by mean FR response. E, Heatmap of FR response differences (difference between PSTHs) normalized by the SD of baseline FR differences in the 2 s before odor stimulus for each cell-odor pair. Concentration increase = high concentration, slow sniffing, minus low concentration, slow sniffing. Faster sniffing = low concentration, fast sniffing, minus low concentration, slow sniffing. Asterisks indicate cell a and cell b examples. F, Top: R 2 values for correlations across all odor time bins as shown in E, between FR changes due to concentration change and those due to sniff frequency change. Histogram shows R 2 values for shuffle controls, “actual” shows R 2 value for real data. Red dotted line indicates value for correlation between FR changes due to concentration increase for two separate sets of high concentration trials. Bottom: as for above, but histogram showing p-values for the correlations (–log10). See Fig. 1-3 for analysis of membrane potential responses.

