Figure 3.
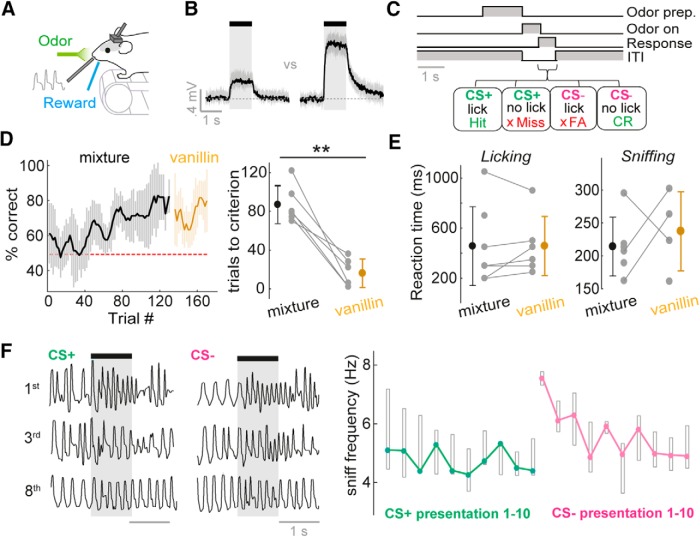
Mice rapidly learn to discriminate concentrations on fast timescales. A, Diagram of head-fixed behavior setup. B, Average PID traces for concentration go/no-go stimuli. Shaded area shows SD. See Fig. 3-1A for odor outlet flow traces. C, Concentration go/no-go task sequence. See Fig. 3-1B for training protocol. D, Left: average learning curve for eight mice. Percentage correct is calculated as a moving average over 5 CS+ and 5 CS– trials. Shaded area indicates SD. Mice are initially trained on two concentrations of an odor mixture, and subsequently tested on the same two concentrations of vanillin. Right: distribution of learning times to criterion (four successive learning curve points at or above 80% correct), for the odor mixture and vanillin. E, Left: distribution of reaction times (RTs) calculated from licking behavior for the odor mixture and vanillin. Right: as for left, but for RTs calculated from sniffing behavior (see Methods). F, Left: example sniff traces for the 1st, 3rd, and 8th presentation of the CS+ and CS– concentrations for the initial concentration discrimination learning session. Note that in this session, the CS+ concentration is first presented 10 times to ensure retention of the lick pattern learned the day before, and then the CS– is interleaved in a pseudorandom order. Right: plot to show median sniff frequency across 8 mice (regardless of concentration-reward contingency) for presentations 1–10 of the CS+ and CS– concentration in the first 2 concentration discrimination sessions. Boxes show upper and lower quartiles.

