Abstract
Quality characteristics of olive products significantly depend on cultivar (cv), among other factors. In this study, seven traditional, noncommercial Greek cultivars, along with the commercial Spanish Arbequina cv., were examined for the phenolic antioxidant dynamic of their leaves. Polar extracts (aqueous, methanol, and ethanol) were analyzed for Total Phenol (TP), Flavonoid (TFL), Hydroxycinnamic Acid Derivatives (THAD), Flavonol (TFLVN) contents, DPPH radical scavenging ability, and Ferric Reducing Capacity (FRAP). Selective characteristics of olive leaf methanol extracts for all cultivars were re-examined on a second sampling period. Olive leaf is considered a rich source of phenolic antioxidants total phenol content reaching 29.3 ± 1.3, 30.6 ± 0.4, and 27.0 ± 1.1 mg caffeic acid/g dry leaf for aqueous, methanol, and ethanol extracts, respectively) and all cultivars were considered of equal bioactive dynamic. TP data derived from Folin–Ciocalteu and another spectrophotometric assay employed presented a high correlation for all examined cases (R2 = 71.5–86.9%). High correlation (R2 = 0.92) was also found between TP and FRAP findings of aqueous extracts. Olive leaf is considered a promising source of phenolic antioxidants irrelevant to cultivar and therefore even cultivars less effective for oil or table olive production could be efficiently exploited for the bioactive dynamic of their leaves.
Keywords: olive leaves, cultivar, phenols, flavonoids, antioxidants, Olea europaea L.
1. Introduction
The culture and significance of the olive tree in Mediterranean, and particularly in Greece, is manifested in many ways (documentary and Linear B tablets evidence, iconographic representations, archaeological evidence, paleobotanical remains, molecular analysis evidence, mythology, ethnobotanical information, literature, and customs) and dates back to prehistoric times. The olive tree is one of the earliest horticultural fruit trees whose products were and still are a part of religious rituals and ceremonial activities, symbols of peace, prosperity, and victory, used for aromatic oils and ointment preparation, as pharmaceuticals, cosmetics, food consumption, and other daily needs (lighting and heating) [1,2].
Today the higher living standards and demand for a healthier life style and extended life expectancy renewed the interest for olive products [3]. The well documented health related benefits of olive products, mainly due to their polyphenolic constituents, have launched the interest of consumers, industries (food, medicinal, and cosmetic) and scientists. EFSA’s claim [4] on the protection of blood lipids from oxidative stress and the related disorders from olive oil polyphenols intake (at least 5 mg of hydroxytyrosol and its derivatives per day) initiated the marketing of relevant products.
Olive leaf is a byproduct of olive cultivation and processing resulting from tree pruning (~25% by weight), drupes collection for oil (up to 10% of olives total weight arriving at mills), and table olives production. It is considered an exceptionally cheap natural source of high-value-added compounds [3,5,6]. As a material, it has a long history of traditional use due its medicinal and bioactive properties [7,8], many of which have been verified from current scientific data [3,9,10]. Olive leaves contain high quantities of a large variety of phenolic bioactive compounds, similar to those present in olive oil, table olives, and other olive materials. Among the bioactive compounds of olive leaves are simple phenols (e.g., hydroxytyrosol), flavonoids (flavones, flavanones, flavonols, and 3-flavanols), and secoiridoids (e.g., oleuropein and derivatives), which show well-documented biologic activities including antioxidant, antimicrobial, anti-inflammatory, anticancer, and neuroprotective [3,5,6,10,11]. Today, there is still a huge potential for extended valorization of olive leaves for the production of pharmaceuticals, cosmetics, nutraceuticals and functional foods [3,6]. Available literature data deal mainly with commercial varieties, while varieties of low productivity in the oil and table olives sectors and of ornamental use, have not been studied.
One of the most important factors that significantly affect phenolic content and composition is cultivar [3,12]. Today, more than 2000 cultivars are spread throughout olive growing regions. A large number of ancient cultivars still exist, but only a few are being cultivated for commercial reasons. The different olive cultivars present diverse morphological and physiological characteristics resulting in different uses and product qualities [13,14,15].
Greece is the third largest olive oil producer in the world, it is among the world’s top table olive producers while it possesses more olive varieties than any other country (~100) [14,15]. Its favorable olive tree environment results in products with exceptional quality characteristics. More than 70% of oil produced is extra-virgin [16] and Greek table olives hold an exceptional phenolic antioxidant potential [17,18].
In the present study, seven native but noncommercial Greek olive cultivars (since they are of low dynamic for oil and table olives production or they are used as ornamentals) are employed and the phenolic antioxidant potential of their leaves is comparatively examined. Olive leaf polar extracts (aqueous, methanol, and ethanol) are analyzed for their total phenol, flavonoid, hydroxycinnamic acid derivatives and flavonols contents, as well as 1,1-diphenyl-2-picrylhydrazyl (DPPH) radical scavenging ability and ferric reducing capacity. Selective characteristics of olive leaf extracts are re-examined during a second time period. The study aims to check the potency of profitable exploitation of olive leaves coming from widely distributed in Greece noncommercial cultivars to boost local income and benefit consumers, industries, markets, and society.
2. Materials and Methods
2.1. Materials
Caffeic acid (98%, CAF) was purchased from Riedel de Haën (Seelze, Germany). Gallic acid (99.5%, GAL), DPPH radical (1,1-diphenyl-2-picrylhydrazyl, 90%), 2,4,6-tripyridyl-s-triazine (TPTZ), FeCl3·6H2O, and quercetin (QUERC) were purchased from Sigma Chemical Co. (St. Louis, MO, USA). Folin–Ciocalteu reagent, AlCl3, and Νa2CO3 (99.8%) were from Panreac Quimica (Barcelona, Spain). HPLC-grade methanol (MeOH) and ethanol (EtOH), as well as acetic acid were from Merck (Darmstadt, Germany). All other common reagents and solvents were of the appropriate purity from various suppliers. The water used was deionized, obtained by an ion-exchange resin system (ZALION 2000, IONEL, Athens, Greece) with a minimum resistance of 800,000 Ω/cm.
2.2. Plant Material
Olive leaf samples were collected on two sampling dates (1 December 2012 and 10 December 2013) following fruit harvest in the last ten days of November. The examined cultivars were the representative and widely known Arbequina Spanish cv., and seven Greek traditional but unexploited ones, namely Asprolia, Atsilochou, Chrysophilli, Veroia, Gigas, Petrolia, and Pikrolia. Selective characteristics of the employed cultivars are summarized in Table 1 [14]. Trees were of approximately the same age (25–30 years old), cultivated under the same agricultural practices (no fertilization, average irrigation applied per drop, 1–2 times every 15 days from May to September with average water 2500–3000 m3/ha) in the same orchard (Troizina, Poros Island, Greece; coordinates: 37.505849° N, 23.406250° E, 5 m above sea level). The microclimate of the location is characterized by a mean average yearly rainfall of 480.7 mm; the months November to January account for 50% of total rain. The lowest mean average temperature is observed in February (8.4 °C) while July is the hottest month with a mean average temperature of 27.3 °C. The winds are north for most of the year with the exception of the months April to June and September when they turn south. Each sample corresponded to leaves collected by hand from same height branches of the whole perimeter of 5 trees for each cultivar. The leaves from the 5 trees were combined into a representative batch (~0.5 kg), which was used to contact analysis in triplicate. Samples collected had completed their developmental stage (mature leaves) and trees employed had reached their optimal maturity. Leaf material was immediately transferred in the lab, washed with deionized water (dH2O), and lyophilized (Christ, Gamma 1–20, Germany). Dried olive leaf samples (OLF) were placed in dark containers and stored in desiccators in a cool dark place at room temperature. Analysis was performed within a brief time period.
Table 1.
Characteristics of the olive cultivars employed in the present study [14].
| Cultivar | Use | Drupe Size | Location/Origin | Harvest Period | Particular Characteristics |
|---|---|---|---|---|---|
| Arbequina | Oil | Small | Spanish commercial cultivar, Globally known | Middle November–Middle December | Very productive; Resistant to cold; Moderately resistant to saline water, verticillium, & cycloconium; Suitable for super-high density planting linear cultivation systems |
| Asprolia | Ornamental | Small | Plant collections, Greece | Late November–Middle February | Average productive; Moderately resistant to cycloconium & cancer; Sensitive to cold |
| Atsilochou Ntopia | Oil | Small–medium | Central Peloponnese, Greece | November–December | Productive; Resistant to cold, winds & cancer; Moderately sensitive to olive fly & cycloconium; Suitable for high altitudes |
| Chrysophilli Epilogis | Ornamental | Small | East Africa, South Asia, Greece | November | Sensitive to cold. Sensitive to environments near sea; Resistant to dryness, winds, olive fly, cycloconium & cancer |
| Gigas Mastoeidis N.K. | Oil | Small–medium | East Peloponnese, Greece | Late November–Middle January | Productive when watered; Resistant to cold, cancer; Moderately resistant to cycloconium |
| Petrolia Serron | Oil Table Olives |
Medium | Serres, Central & East Macedonia, Greece | Late November–Late December | Medium productive; Medium resistant to cold; Sensitive to olive fly & cycloconium |
| Pikrolia Corfu | Oil Ornamental |
Medium | Corfu island, Greece | November–December | Low productivity; Resistant to poor soils, cold, cancer & cycloconium |
| Veroia Ntopia | Oil | Medium | Pieria mountains, Greece | November–December | Low productivity; Resistant to cold, snow & cycloconium |
2.3. OLF Extracts’ Preparation
OLF (2%, w/v) was treated in an ultrasonic bath (Elmas 30H Elmasonic, Singen, Germany; ultrasonic power effective 80 W, ultrasonic frequency 37 kHz) at room temperature for 15 min. Extraction solvents were water, ethanol, or methanol. OLF extracts were prepared in triplicate and each preparation was further analyzed.
2.4. Content in Total Phenols Determined via the Folin–Ciocalteu Assay (TPFC)
The assay employed was according to that described elsewhere [12]. Suitable aliquots (0.25 mL) of OLF extracts were transferred into a 10 mL volumetric flask. Subsequently, 5 mL of water and 0.5 mL of the Folin–Ciocalteu reagent were added. After 3 min, 1 mL of saturated (35%, w/v) sodium carbonate solution was added and the mixture was then diluted with water to 10 mL. One hour later the absorbance was measured at 725 nm against a blank solution. Calibration curves were constructed using standard solutions of CAF and TPFC content was expressed as mg CAF/g dry leaf.
2.5. Content in Total Flavonoids (TFL)
The TFL was determined according to Cvek et al. [19] with slight modifications. An aliquot (0.1 mL) of an aluminum chloride solution (2% aluminum chloride in 95/5 MeOH/acetic acid, v/v) was added to an aliquot of OLF extract (0.3–1 mL), and subsequently 1.4 mL of MeOH/acetic acid mixture (95/5, v/v) was added. The mixture was left for 30 min at room temperature, and thereafter the absorbance was measured at 415 nm against the control. Absorbance measurements were corrected by subtracting initial sample absorbance at 415 nm. Calibration curves were constructed using standard solutions of QUERC and TFL results were expressed as mg QUERC/g dry leaf.
2.6. Antioxidant Activity Determined via the DPPH Assay
The ability of methanolic and ethanolic OLF extracts to scavenge the DPPH radical was determined according to Nenadis and Tsimidou [20] with some modifications: 2.9 mL of a DPPH• solution (0.1 mM in MeOH or EtOH) was mixed with 0.1 mL of methanolic or ethanolic OLF extract. The absorption at 516 nm (A516) was recorded at the beginning of the reaction (t = 0) and after 20 min (t = 20). The results were expressed as % Inhibition = ((A516 (t = 0) − A516 (t = 20)) × 100/A516 (t = 0)).
2.7. Antioxidant Activity Determined via the FRAP Assay
The FRAP assay was carried out according to Benzie and Strain [21] with some modifications. A mixture containing 3 mL of freshly prepared and prewarmed (at 37 °C) FRAP reagent and an aliquot of OLF aqueous extract was incubated at 37 °C for 20 min and the absorbance was then recorded at 593 nm. The ferric reducing ability of the examined extracts was assessed as CAF equivalents via the use of a respective calibration curve.
2.8. Content in Total Phenols (TPHCl), Hydroxycinnamic Acid Derivatives (THAD), and Flavonols (TFLVN)
Determination of bioactive phenolic classes was carried out according to Obied et al. [22] with slight modifications: 0.5 mL of OLF extract (ethanol, methanol, aqueous) was mixed with 1 mL 0.1% HCl–ethanol solution (0.1 mL HCl per 100 mL 95% ethanol) and 8.5 mL 2% HCl–ethanol solution. The absorbance of the mixture was measured after 20 min at 280, 320, and 360 nm to evaluate total phenols (TPHCl), hydroxycinnamic acid derivatives (THAD), and flavonols (TFLVN) expressed as mg GAL, mg CAF and mg QUERC/g dry leaf, respectively, through the corresponding calibration curves.
2.9. Statistical Analysis
Experiments were carried out in triplicate and results were expressed as mean ± standard deviation for every set of data and each sampling period examined. Data were analyzed using one-way analysis of variance (ANOVA), (p < 0.05); pair-wise Tukey’s Honestly Significant Difference test of means was also performed. Statistical analysis was carried out using JMP 13.1 (2016, SAS Institute Inc., Cary, NC, USA) and Minitab 18 (2017, Minitab Inc., State College, PA, USA). Variables and varieties were subjected to two-way hierarchical cluster analysis to detect meaningful groups. In the same set of data Principal Component Analysis (PCA) was also employed to detect particular relationships.
3. Results and Discussion
3.1. Total Phenol Content of Olive Leaf Polar Extracts
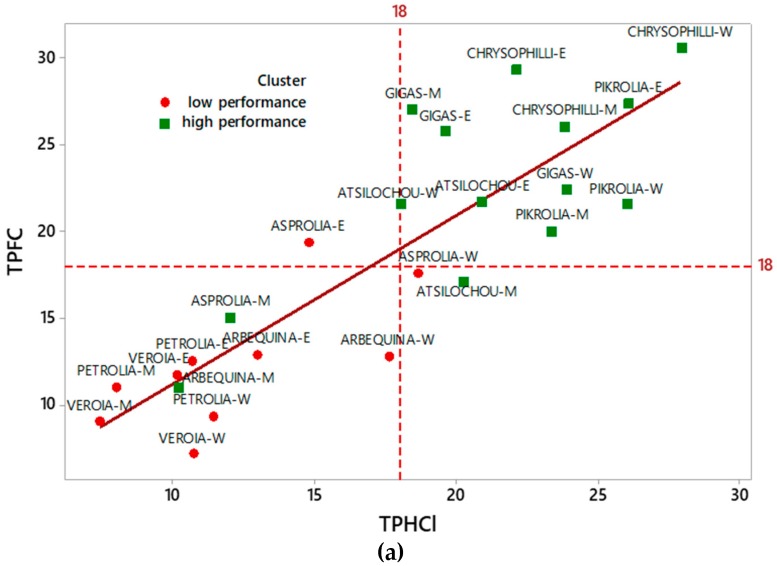
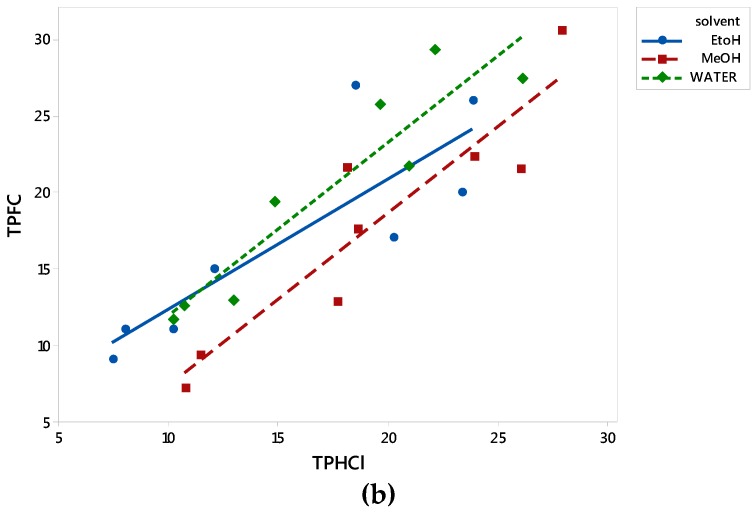
Total phenol content was determined by two protocols; the widely employed Folin–Ciocalteu (TPFC), which is quite laborious, expensive, and time-consuming and an alternative (TPHCl) spectrophotometric one [22]. The latter, which generally enables also the simultaneous determination of other bioactive classes (total hydroxycinnamic acid derivatives, flavonols, and anthocyanins), is easier, less expensive, and quicker. The results of the two methods (y = TPFC and x = TPHCl) employed for total phenol content determination correlated very well for all analyzed extracts as is depicted in Figure 1. The equations of correlation for all the extracts together, and the individual ones (aqueous, methanolic, and ethanolic) were y = 1.532 + 0.970x (R2 = 0.741), y = 0.566 + 1.136x (R2 = 0.869), y = −3.964 + 1.131x (R2 = 0.853), and y = 3.824 + 0.8533x (R2 = 0.715), respectively. The high R2 revealed that the alternative protocol can be efficiently employed for the phenol content determination of olive leaf polar extracts in a quick, easy and cheap way, especially in the case of a large number of samples, avoiding the labor of the Folin–Ciocalteu protocol. The efficient use of this protocol for TP content determination has been also employed in olive leaves and other natural products by others [23,24,25,26]. Goulas and Manganaris [26] also report a high correlation (r = 0.984) between the two methods for strawberry extracts.
Figure 1.
Correlation between TPFC and TPHCl data for all examined extracts. (a) W-indicates aqueous, M-methanol, and E-ethanol OLF extracts, respectively. (b) Data for aqueous, methanol and ethanol OLF extracts are depicted with green dashed line fitted in rectangles, red dashed line fitted in squares, and blue solid line fitted in circles, respectively. TPFC, total phenols determined via the Folin–Ciocalteu assay; TPHCl, total phenols determined via the alternative spectrophotometric assay; OLF, olive leaf samples.
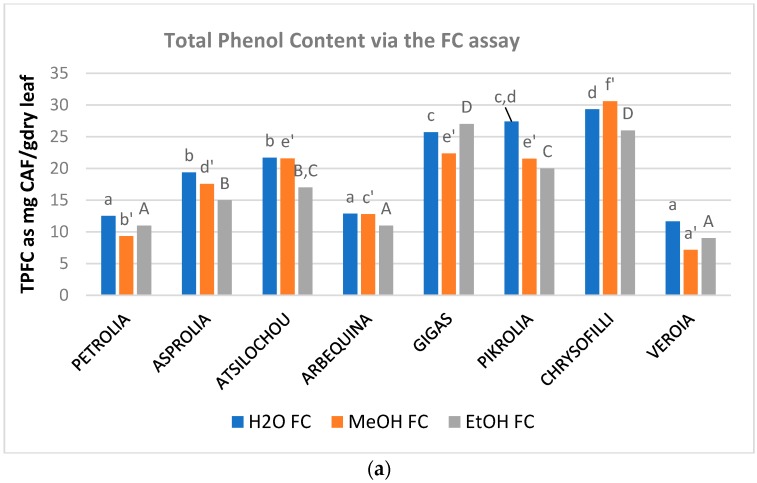
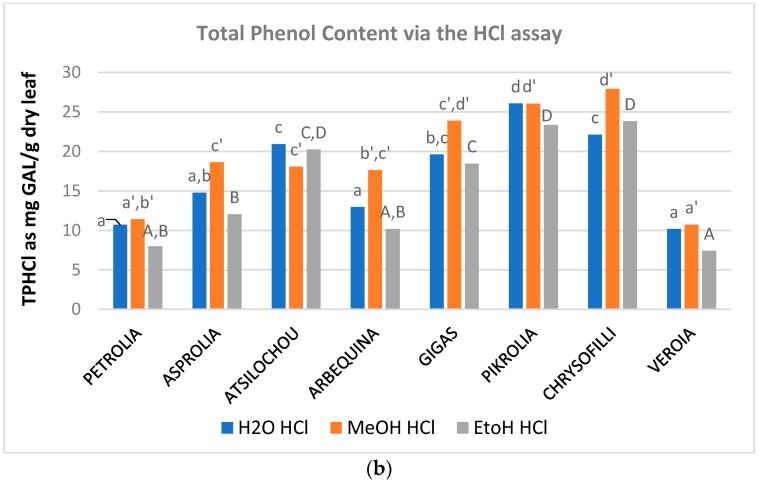
The phenol content (Figure 2, Table A1) of the examined aqueous, methanol, and ethanol OLF extracts ranged from 12 to 29, 7 to 31, and 9 to 27 mg CAF/g dry leaf as determined via the TPFC method and 10–26, 11–28, and 7–24 mg GAL/g dry leaf as determined via the TPHCl assay. The varieties analyzed showed almost similar trends in the three solvents employed and were therefore classified as being of higher (Chrysophilli, Pikrolia, Gigas, and Atsilochou) and lower (Asprolia, Arbequina, Petrolia, and Veroia) phenolic dynamic (Figure 1a and Figure 2). TP results were of the same size with those reported by other studies [25,27,28,29], although differentiations in sample treatments and experimental approaches do not always allow direct comparison of data. OLF polar extracts prepared under similar procedure from samples of 10 Greek cultivars (different than those examined in the present study, commercial ones, and from different sampling periods) possessed 5–19 mg CAF/g dry leaf [12,30]. Once more, olive leaf material was shown to be an exceptional source of phenols, with a content higher than that of other bioactive natural products (such as fruits, vegetables, nuts, spices, cereals, and grain legume seeds) [31,32].
Figure 2.
Total phenol content of OLF polar (aqueous, methanol, and ethanol) extracts as determined via the (a) Folin–Ciocalteu (TPFC) and (b) spectrophotometric by Obied et al. [22] assay (TPHCl); different letters (a–d, a’–f’, A–F) indicate statistical significant differences.
3.2. Content of OLF Polar Extracts in Total Hydroxycinnamic Acid Derivatives (THAD), Total Flavonols (TFLVN), and Total Flavonoids (TFL)
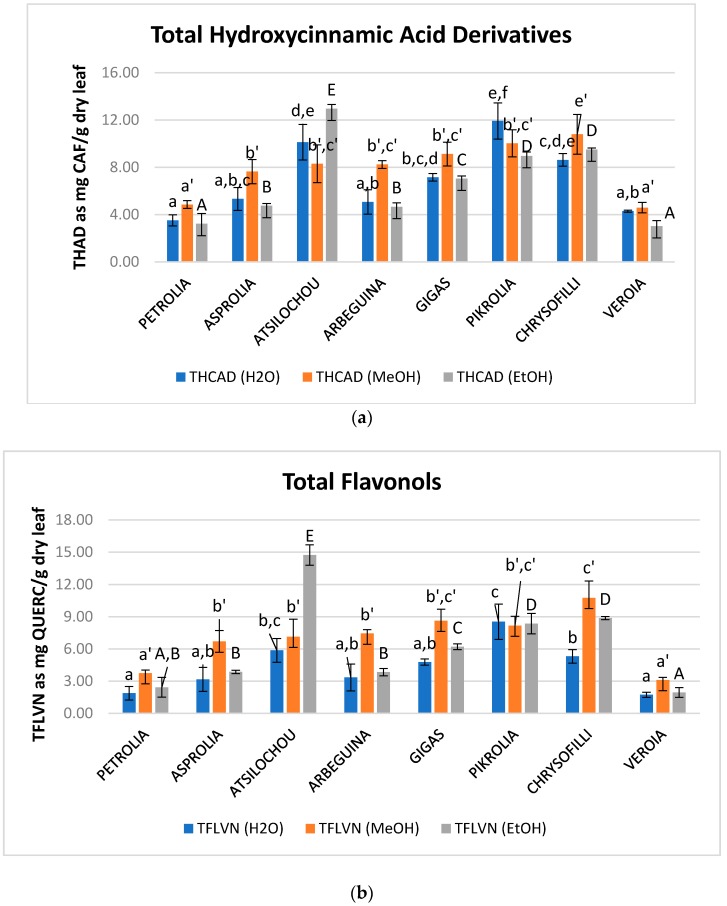
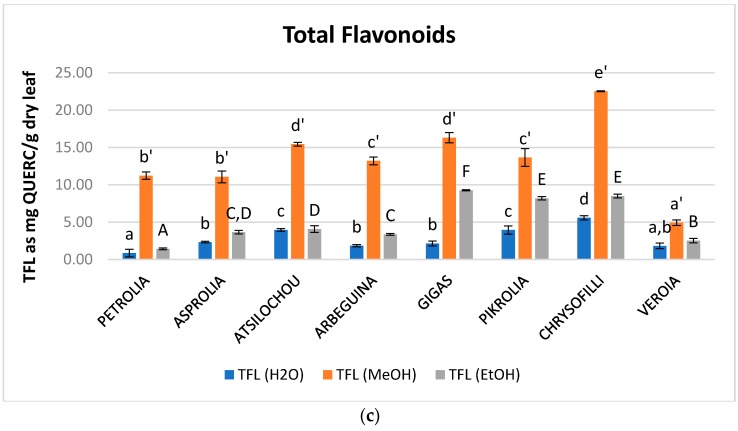
Flavonoids are considered an important fraction of olive leaf phenolics contributing to an important extend in the antioxidant activity of its extracts [23]. Total flavonoid content of the examined extracts ranged from 0.9 to 5.6, 4.9 to 22.5, and 1.4 to 9.3 mg QUERC/g dry leaf for water, methanol, and ethanol, respectively (Figure 3, Table A1). MeOH extracts presented significantly higher FL content for all examined cultivars in comparison to ethanol and aqueous ones (Figure 3c). Many of the flavonoids that are expected in OLF are found in their glycosidic form [11] and this form is known not to achieve high ethanol levels for extraction [33]. Moreover, water is considered less preferable for the extraction of flavonoids from OLF [5] while flavonols are also expected to present low solubility in this solvent [34]. On the other hand, methanol has been reported to preferable extract flavonoids from natural products when compared to water and ethanol [35,36,37,38]. Methanol extracts of the present study presented similar values with the methanol extracts studied in another study [24] (up to 26.5 mg QUERC/g dry material) although extraction conditions and the employed analytical protocol are different.
Figure 3.
Content in total (a) hydroxycinnamic acid derivatives (THAD), (b) flavonols (TFLVN), and (c) flavonoids (TFL) of aqueous, methanol, and ethanol olive leaf (OLF) extracts; different letters (a–f, a’–e’, A–F) indicate statistical significant differences.
Hydroxycinnamic acid derivatives are also considered an important fraction of olive leaf material since they comprise compounds such as verbascoside and caffeic, ferulic, coumaric, chlorogenic acids, that are considered to contribute noticeably to the activity of OLF extracts [23,39,40]. Regarding flavonols, quercetin and rutin [3,11,39] are mainly expected in olive leaves and are also considered to be related with health benefits [41,42] and contribute to the bioactive character of OLF [23,40]. THAD and TFLVN values of examined extracts: EtOH: 3–13, MeOH: 5–11, H2O: 4–12 mg CAF/g dry leaf and EtOH: 2–15, MeOH: 3–11, H2O: 2–9 mg QUERC/g dry leaf, respectively (Figure 3a,b, Table A1). Atsilochou ethanol extracts presented significantly high THAD and TFLVN values (Figure 3a,b, Table A1). Methanol extracts of the present study exhibit similar THAD and TFLVN values with those reported by Putnik et al. [24] (up to 2.6 mg CAF and 9.6 mg QUERC/g dry material, respectively). Moreover, the ethanol extracts of the studied low dynamic varieties (Petrolia, Veroia, Asprolia, and Arbequina) presented similar THAD and TFLVN values with those examined by Tsakona and collaborators [25] (2.1 mg CAF/g dry leaf and 3.8 mg QUERC/g dry leaf). The THAD and TFLVN values of the studied olive leaf extracts were of the same size to those reported for strawberry [26] and aromatic plant (Salvia fruticosa and Origanum dictamnus L.) extracts [25] examined under similar methodologies.
Total flavonoid and total flavonol contents were better correlated in the case of methanol (R2 = 0.82) and less in the case of water (R2 = 0.53). Regarding ethanol extracts no correlation was shown (R2 = 0.19). Although total flavonoids should include total flavonols, the values of the latter were not always lower than that of the former, which was attributed to the different principles of the employed protocols. It is known that analytical parameters employed even for the same determination (e.g., total flavonoid content) can even alter the order of the examined samples in terms of the measured value [37].
3.3. Statistical Analysis Data of the TP, THAD, TFL, and TFLVN Parameters
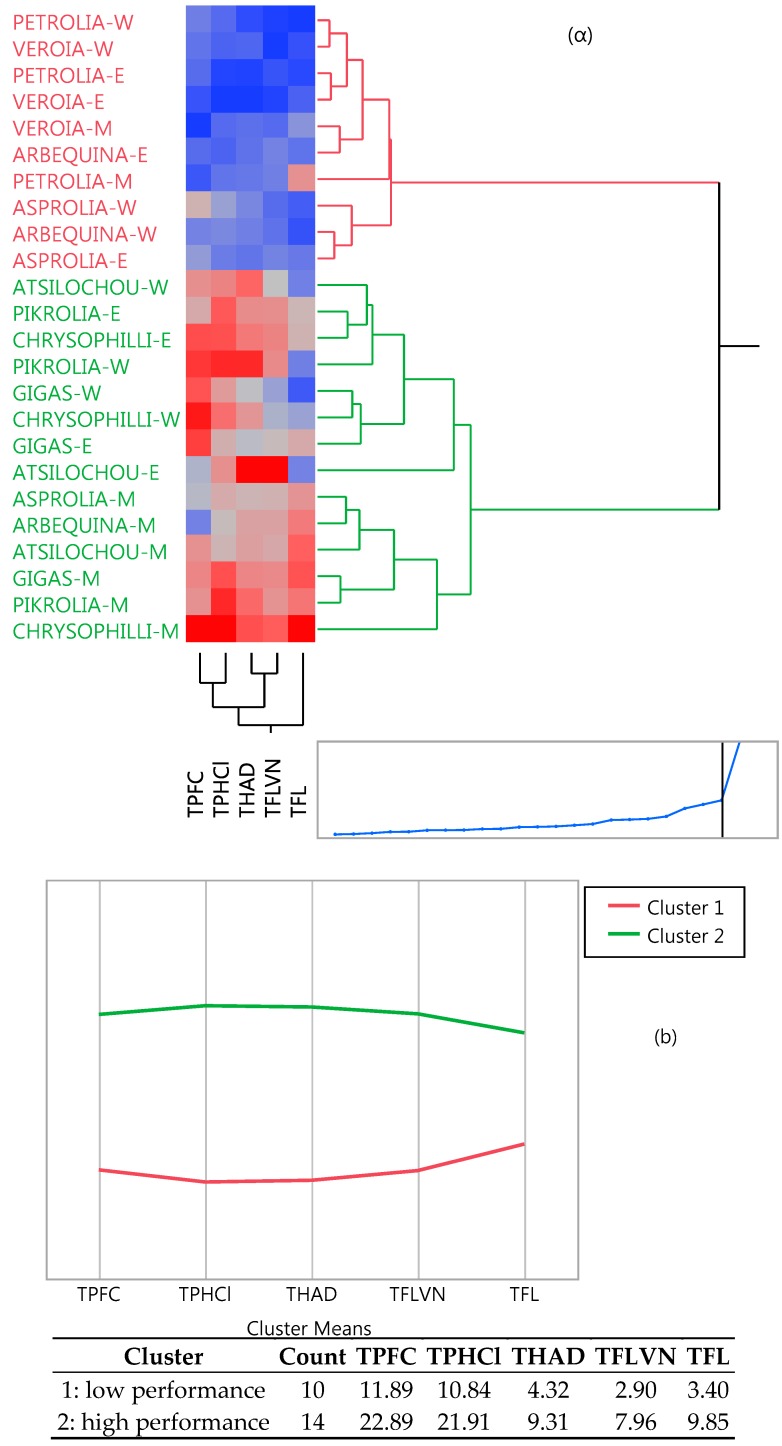
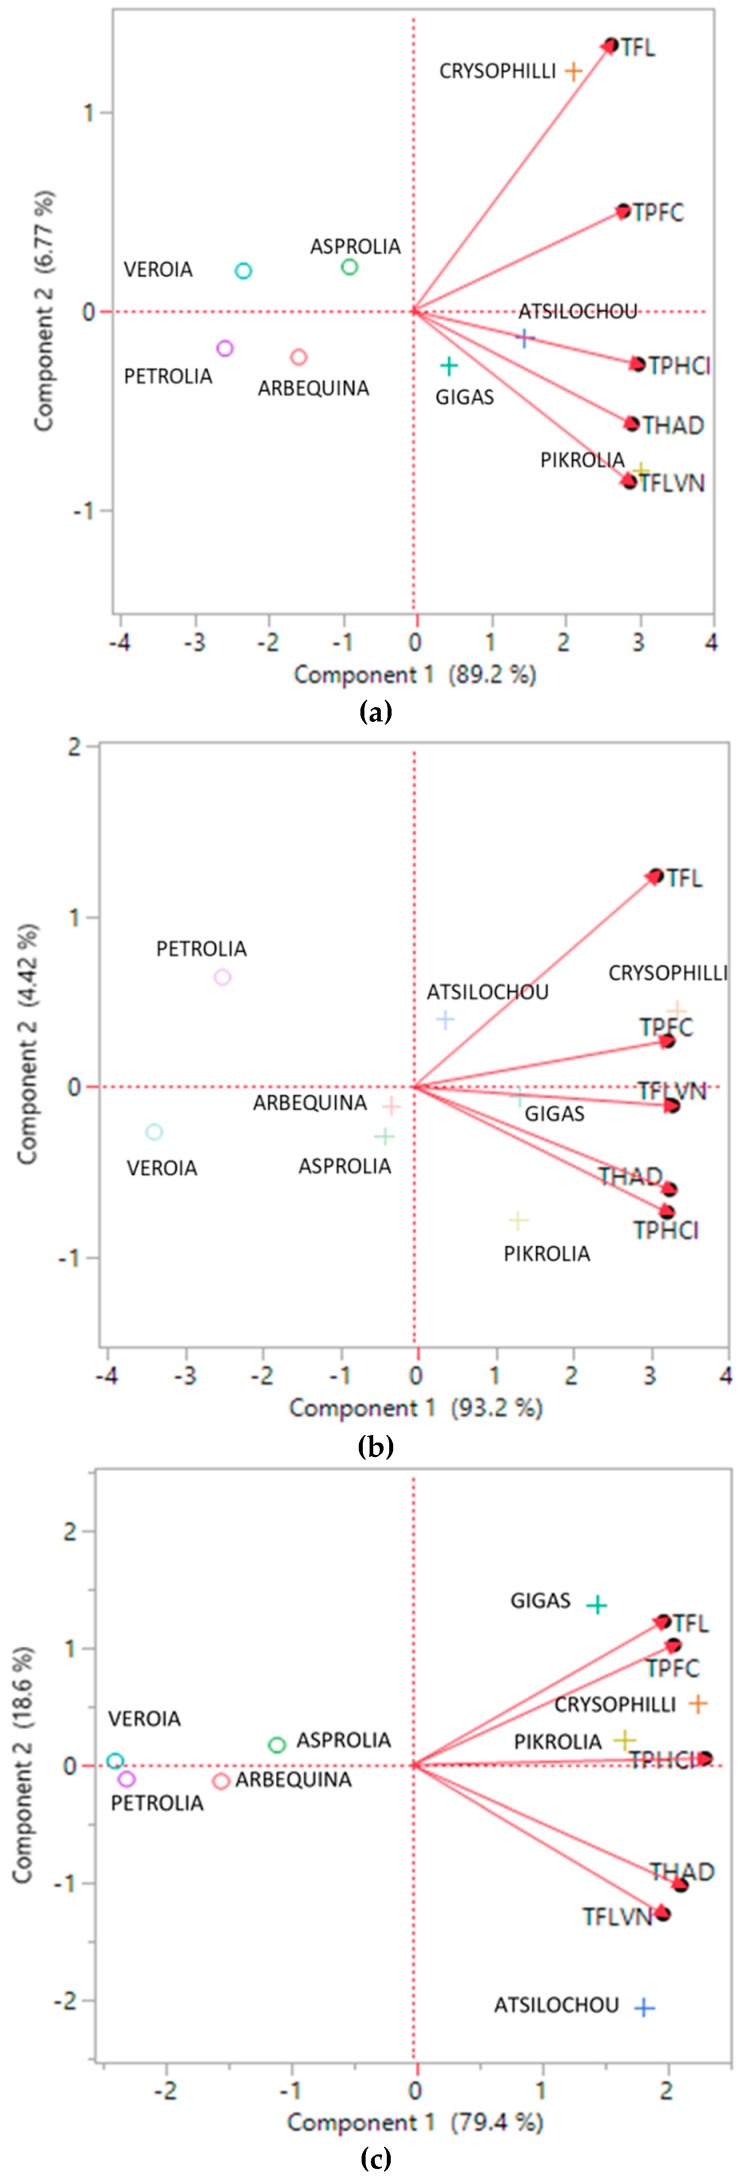
Cluster analysis (Figure 4) revealed two distinctive groups, one of lower and one of higher performance, as the dendrogram and the means of the table and graph clearly show. High cluster group means were two to three-fold higher than those of the low cluster group. The same clusters are also depicted in Figure 1a (in which two and one misfits are found respectively in the low and high performance cluster). Moreover, the same classification can be also shown from the PCA data (Figure 5), since the low performance varieties are illustrated on the left side and the high ones on the right side of the graphs. Furthermore, from the same PCA graphs the correlation between the studied parameters can be determined; parameters showing angles with low apertures indicate a strong positive relationship, while those with vertical apertures do not correlate at all.
Figure 4.
Two-way clustering dendrogram showing (a) the position of cultivars in the two clusters and (b) the intensity and means of the studied parameters; red and green denotes low and high performance clusters, respectively.
Figure 5.
PCA biplots summarizing the relationship between the studied parameters and the olive leaf varieties. (a), (b), and (c) depict data from the aqueous, methanol, and ethanol extracts, respectively. TPFC, total phenols determined via the Folin–Ciocalteu assay; TPHCl, total phenols determined via the alternative spectrophotometric assay; THAD, total hydroxycinnamic acid derivatives; TFLVN, total flavonols; TFL, total flavonoids.
3.4. Antioxidant Activity of Olive Leaf Polar Extracts
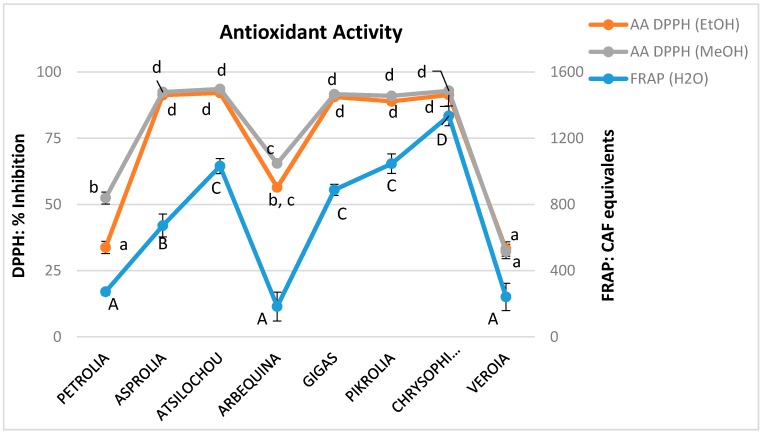
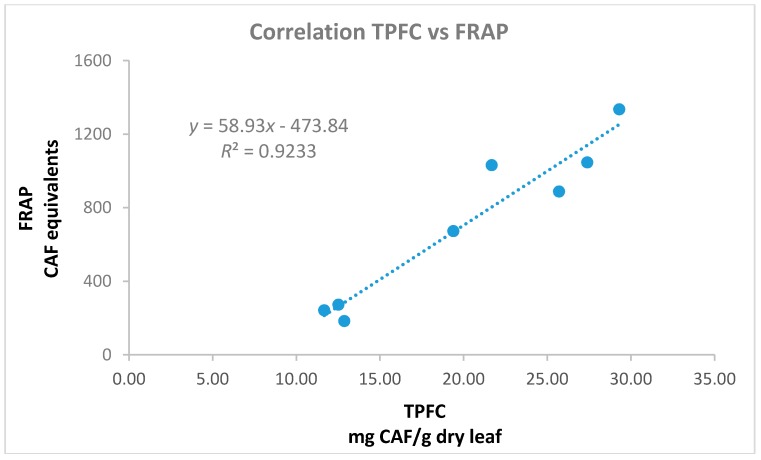
The antioxidant activity of the materials was examined by the application of the FRAP assay in the aqueous olive leaf extracts and the DPPH radical scavenging activity in the alcoholic extracts. The methods employed are commonly applied for the analysis of many matrices [43] such as nuts [44], vegetable oils [45], fruits, and relevant products [26,46,47,48]. All the examined polar extracts (aqueous, methanol, and ethanol) presented similar trends (Figure 6, Table A1). Those with higher TP content showed remarkable antioxidant performance, when lower activity was shown for extracts with inferior TP values as has been expected and discussed by other studies on olive leaves [49]. Methanol and ethanol extracts possessed almost identical DPPH radical scavenging activity (although their TP, THAD, TFLVN, and TFL values presented statistical significantly differences), dividing cultivars in stronger (Chrysophilli, Gigas, Pikrolia, Atsilochou, and Asprolia; MeOH: 91–94%, EtOH: 89–92% inhibition) and weaker (Arbequina, Petrolia, and Veroia; MeOH: 32–65%, EtOH: 33–56% inhibition) scavengers. Additionally, Chrysophilli, Gigas, and Pikrolia were distinguished for their ferric reducing ability, while Petrolia and Veroia showed a significantly inferior performance (Figure 6). The correlation of their antioxidant activity (either FRAP or DPPH) was checked with their TPFC, TPHCl, THAD, TFLVN, and TFL contents. The best correlation was found for the aqueous preparations between the FRAP and TPFC data (Figure 7) with an equation y = 58.93x − 473.84 and R2 = 0.92; where y = FRAP and x = TPFC. The lower correlation of DPPH scavenging activity with TP content of the studied extracts (MeOH: R2 = 0.78 and EtOH: R2 = 0.59) was attributed to the fact that five out of the eight extracts examined (with TP values for MeOH: 18–31 mg/g dry leaf and EtOH: 15–26 mg/g dry leaf) exhibited very high % inhibition values (MeoH: 89–92% and EtoH: 91–94%) that did not allow direct discrimination between samples [20]. According to Nenadis and Tsimidou [20], the relative concentration of the tested antioxidant is very critical and high antioxidant/[DPPH•] ratios resulting in % Inhibition values >80% do not permit observations for samples differentiation.
Figure 6.
Antioxidant activity as determined via the 1,1-diphenyl-2-picrylhydrazyl (DPPH) assay, expressed as % DPPH radical scavenging inhibition for the methanol and ethanol extracts as well as ferric reducing capacity (FRAP), expressed as CAF equivalents (mg/L) for the respective aqueous extracts; different letters (a–d, A–D) indicate statistical significantly differences.
Figure 7.
Correlation of total phenols determined via the Folin-Ciocalteu assay (TPFC, mg CAF/g dry leaf) and ferric reducing capacity (FRAP, mg CAF/L) data of the aqueous olive leaf extracts.
3.5. Comparative Study of the Phenolic Bioactive Content of Olive Leaves from Two Sampling Periods
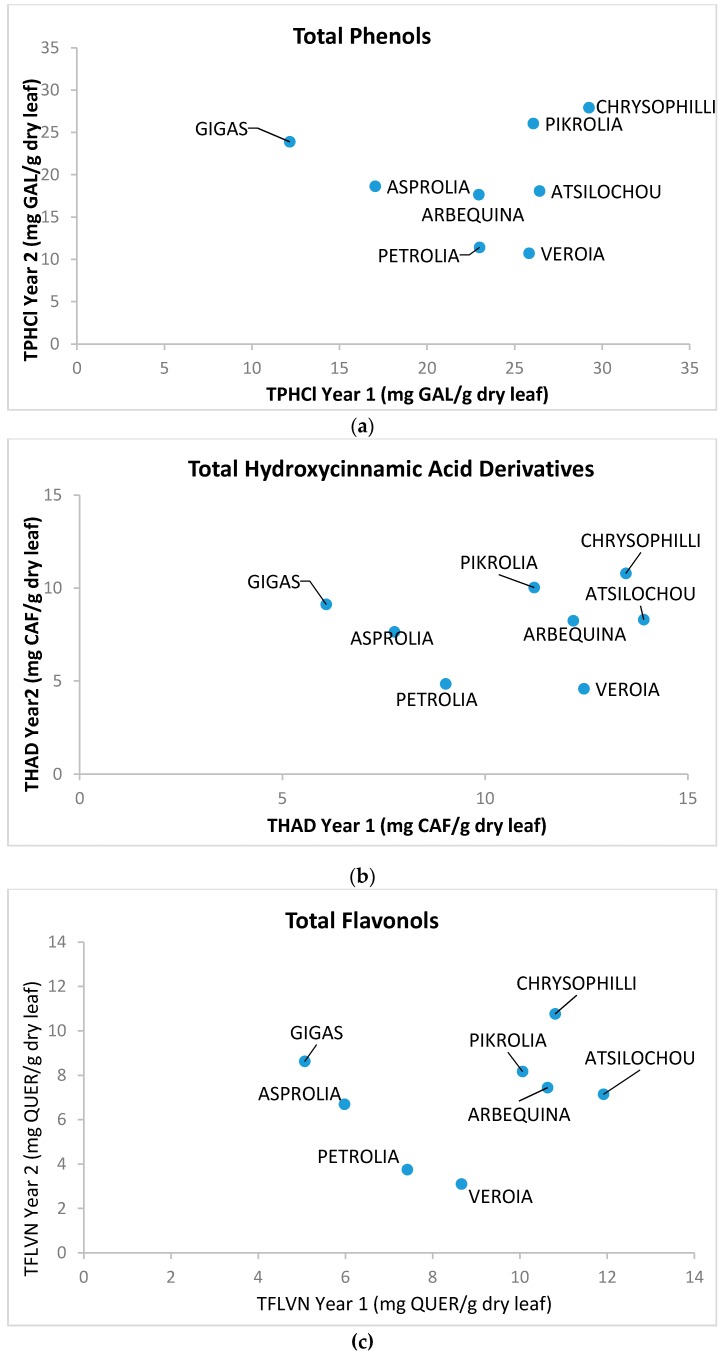
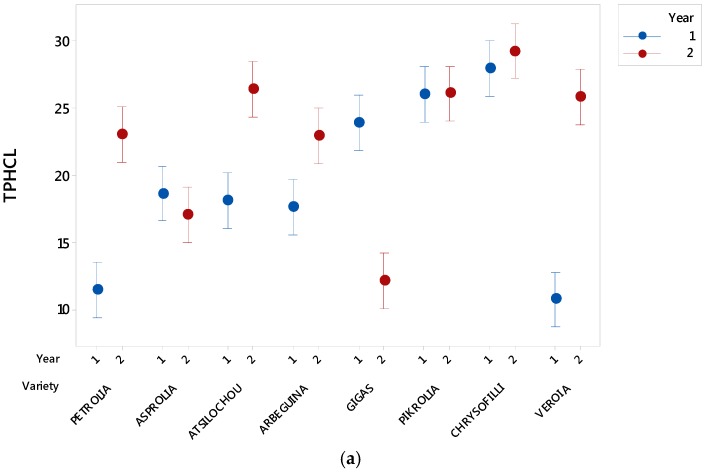
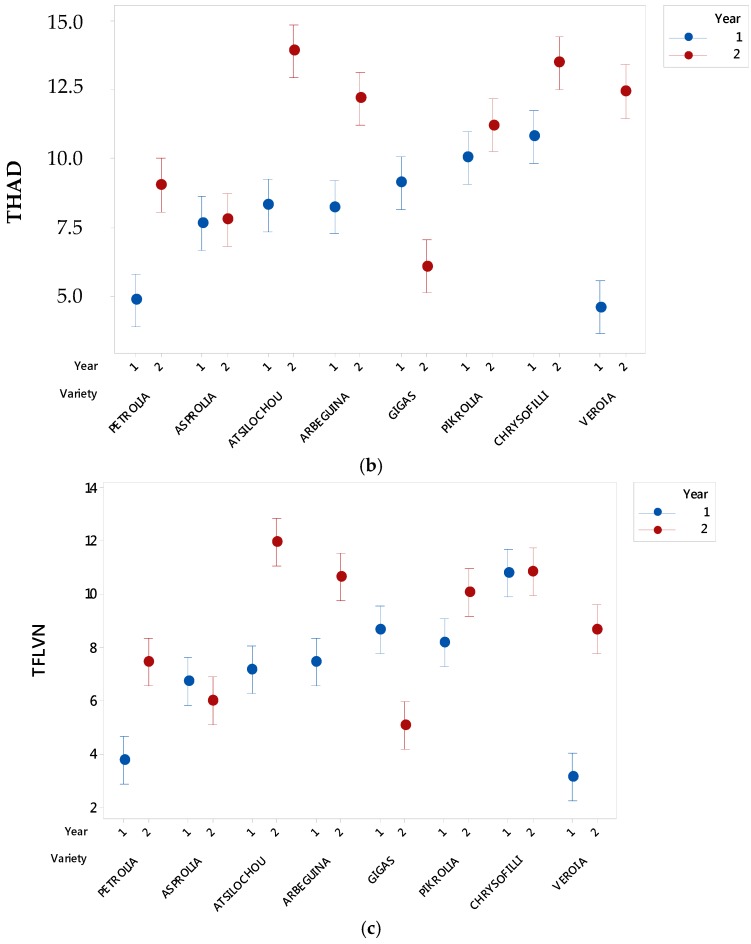
As presented (Figure 1, Figure 2, Figure 3, Figure 4, Figure 5 and Figure 6) and discussed in the previous sections, statistically significant differences are shown between cultivars that allow cultivars classification in high and low dynamic ones. The fact that cultivar affects the final quality characteristics of the material was expected and has been already discussed elsewhere [3,12]. In the present study, selective quality characteristics were re-examined in olive leaves collected from the same orchard for all studied cultivars in a second time-period. Data for the TPHCl, THAD, and TFLVN content for samples regarding the two examined periods are comparatively presented in Figure 8. Results depict that the range of bioactive class content was similar for the two sampling periods; however, the trend was not kept within varieties. Therefore, and as can be seen from Figure 8, Gigas cv., which was among the richer ones regarding TP, THAD, and TFLVN in the first sampling year, had lower bioactive content in the second sampling period. Moreover, Veroia cv. with poor TPHCl, THAD, and TFLVN contents in the first sampling period, presented high contents of the examined parameters in the second year of sampling. Similar were the observations for the rest of the studied cultivars (see Figure A1, where statistically significant differences are depicted). This finding was in line with published data revealing that even trees of the same cultivar grown under the same soil–climatic conditions can complete their developmental stage in a different way which may result in differences in total and individual phenol content and composition at specific collection times [3,12]. Moreover, the same cultivar may present a richer or poorer phenol content in a different sampling period [3,12]. Therefore, cultivars cannot be finally classified as being of high or low potency but they were all considered to have similar phenolic antioxidant content. This was seen as a challenging opportunity for the valorization of olive leaves coming from all cultivars, even those that are used as ornamentals and/or are not profitable for the olive oil or table olives sector.
Figure 8.
Comparative representation of (a) total phenol content determined via the alternative spectrophotometric assay (TPHCl), (b) total hydroxycinnamic acid derivatives (THCAD), and (c) total flavonols (TFLVN) data for the methanol extracts prepared from olive leaves from two sampling periods: year 1 (2012) and 2 (2013).
4. Conclusions
Data from one sampling period led to olive leaf cultivars classification as being of lower or higher bioactivity as regards their content in TP, THAD, TFLVN, TFL, and antioxidant activity (DPPH and FRAP). However, data from the second sampling period depicted that although the range of bioactive class content was similar for the two sampling periods, the trend was not kept within varieties. Therefore, all the studied cultivars were considered rich and equally potent for the studied bioactive parameters. This was seen as a challenging opportunity for the valorization of olive leaves irrespectively to cultivar origin. Moreover, although statistically significant different, the employed solvents presented of the same size potency to extract TP, THAD, and TFLVN. Methanol extracts presented significantly higher TFL values in relation to respective aqueous and ethanol ones. Last but not least, the HCl spectrophotometric assay was considered similarly effective with the widely employed FC for TP content determination. TP data derived from the two assays correlated well for the three solvents employed, encouraging the simple, rapid and inexpensive use of the HCl protocol in routine analysis of olive leaves polar extracts.
Acknowledgments
The authors would like to gratefully acknowledge the contribution of Mr. Georgios Kostelenos (owner of the olive orchard Poros, Greece) and Dr. Athanasios Roubos (Professor of the Alexander Technological Institute of Thessaloniki, Greece) for providing the olive leaf samples and information regarding the potential of the examined unexploited Greek cultivars.
Appendix
Figure A1.
Effect of year and variety on total phenol content determined via the alternative spectrophotometric assay (TPHCl), total hydroxycinnamic acid derivatives (THCAD), and total flavonols (TFLVN) contents. Vertical bars denote the 95% confidence intervals of means calculated from the error mean square of the analysis of variance. Means whose 95% intervals do not overlap differ statistically significantly.
Table A1.
Content of olive leaf (OLF) aqueous (H2O), methanol (MeOH), and ethanol (EtOH) extracts in Total Phenols (via the Folin–Ciocalteu assay: TPFC and via the Obied et al., assay: TPHCl), Total Hydroxycinnamic Acid Derivatives (THAD), Total Flavonols (TFLVN), Total Flavonoids (TFL), and antioxidant activity (caffeic acid equivalents of ferric reducing capacity (FRAP) for the aqueous and % DPPH radical scavenging inhibition for the alcoholic extracts).
| Variety | TPFC | TPHCl | THAD | TFLVN | TFL | Antioxidant Activity | ||||||
|---|---|---|---|---|---|---|---|---|---|---|---|---|
| Bioactive Parameter | mg caffeic acid/g dry leaf | SD | mg gallic acid/g dry leaf | SD | mg caffeic acid/g dry leaf | SD | mg quercetin/g dry leaf | SD | mg quercetin/g dry leaf | SD | FRAP: Caffeic acid equivalents or DPPH: % Inhibition | SD |
| H2O OLF extracts | ||||||||||||
| PETROLIA | 12.52 | 1.31 | 10.71 | 0.50 | 3.51 | 0.47 | 1.87 | 0.63 | 0.87 | 0.50 | 272.58 | 19.38 |
| ASPROLIA | 19.39 | 0.40 | 14.78 | 1.59 | 5.32 | 0.97 | 3.17 | 1.11 | 2.33 | 0.11 | 672.31 | 68.85 |
| ATSILOCHOU | 21.69 | 1.10 | 20.92 | 1.56 | 10.12 | 2.73 | 5.87 | 1.11 | 3.97 | 0.18 | 1031.47 | 46.08 |
| ARBEQUINA | 12.87 | 0.47 | 12.95 | 2.23 | 5.06 | 1.03 | 3.34 | 1.25 | 1.85 | 0.15 | 183.14 | 87.15 |
| GIGAS | 25.71 | 1.88 | 19.60 | 1.55 | 7.15 | 0.31 | 4.77 | 0.29 | 2.15 | 0.33 | 888.14 | 33.23 |
| PIKROLIA | 27.40 | 0.96 | 26.07 | 1.72 | 11.92 | 1.53 | 8.53 | 2.64 | 3.95 | 0.55 | 1046.19 | 58.49 |
| CHRYSOPHILLI | 29.31 | 1.29 | 22.12 | 2.85 | 8.62 | 0.53 | 5.31 | 0.64 | 5.59 | 0.28 | 1335.08 | 59.47 |
| VEROIA | 11.67 | 0.34 | 10.17 | 1.16 | 4.28 | 0.08 | 1.73 | 0.24 | 1.82 | 0.37 | 241.50 | 82.11 |
| MeOH OLF extracts | ||||||||||||
| PETROLIA | 9.31 | 0.72 | 11.41 | 0.63 | 4.84 | 0.33 | 3.75 | 0.29 | 11.22 | 0.49 | 52.42 | 2.27 |
| ASPROLIA | 17.57 | 0.60 | 18.63 | 2.04 | 7.64 | 1.03 | 6.69 | 1.03 | 11.05 | 0.78 | 92.42 | 0.58 |
| ATSILOCHOU | 21.58 | 0.10 | 18.07 | 2.38 | 8.30 | 1.59 | 7.14 | 1.63 | 15.44 | 0.26 | 93.58 | 0.33 |
| ARBEQUINA | 12.80 | 0.22 | 17.64 | 0.82 | 8.24 | 0.33 | 7.44 | 0.35 | 13.20 | 0.52 | 65.47 | 0.59 |
| GIGAS | 22.36 | 0.22 | 23.89 | 1.91 | 9.11 | 1.00 | 8.62 | 1.07 | 16.31 | 0.68 | 91.60 | 1.05 |
| PIKROLIA | 21.54 | 0.23 | 26.04 | 4.47 | 10.02 | 1.15 | 8.17 | 0.86 | 13.66 | 1.18 | 90.97 | 0.39 |
| CHRYSOPHILLI | 30.57 | 0.35 | 27.93 | 2.67 | 10.79 | 1.69 | 10.76 | 1.58 | 22.54 | 0.06 | 92.92 | 0.33 |
| VEROIA | 7.15 | 0.11 | 10.72 | 1.12 | 4.58 | 0.44 | 3.10 | 0.25 | 4.93 | 0.38 | 32.23 | 2.72 |
| EtOH OLF extracts | ||||||||||||
| PETROLIA | 11.00 | 0.89 | 8.00 | 1.90 | 3.22 | 0.88 | 2.43 | 0.92 | 1.43 | 0.11 | 33.75 | 4.63 |
| ASPROLIA | 15.00 | 2.21 | 12.04 | 0.52 | 4.74 | 0.20 | 3.86 | 0.16 | 3.66 | 0.24 | 91.28 | 0.42 |
| ATSILOCHOU | 17.00 | 1.36 | 20.25 | 1.99 | 12.96 | 0.35 | 14.73 | 0.95 | 4.08 | 0.45 | 92.14 | 0.21 |
| ARBEQUINA | 11.00 | 1.30 | 10.18 | 0.66 | 4.66 | 0.34 | 3.84 | 0.35 | 3.36 | 0.13 | 56.43 | 9.95 |
| GIGAS | 27.00 | 1.05 | 18.45 | 0.34 | 7.04 | 0.22 | 6.20 | 0.27 | 9.26 | 0.07 | 90.59 | 1.07 |
| PIKROLIA | 20.00 | 1.30 | 23.36 | 2.72 | 8.95 | 0.33 | 8.36 | 0.95 | 8.20 | 0.23 | 88.93 | 1.05 |
| CHRYSOPHILLI | 26.00 | 1.34 | 23.82 | 0.35 | 9.51 | 0.12 | 8.87 | 0.14 | 8.49 | 0.25 | 91.38 | 1.00 |
| VEROIA | 9.00 | 1.18 | 7.42 | 1.03 | 3.01 | 0.47 | 1.94 | 0.46 | 2.54 | 0.30 | 33.13 | 5.41 |
SD: standard deviation.
Author Contributions
V.T.P. and M.P. were responsible for the conceptualization, overall supervision of experiments, validation, writing, review, and editing of the manuscript. V.T.P. also prepared the first draft. D.P. performed the statistical treatment whereas, V.T.P., K.D, E.A., and K.A. were responsible for the experimentation and data gathering.
Funding
This research received no external funding.
Conflicts of Interest
The authors declare no conflicts of interest.
References
- 1.Polymerou-Kamilakis A. The Culture of the Olive Tree (Mediterranean World) Elsevier; Amsterdam, The Netherlands: 2006. pp. 1–12. [Google Scholar]
- 2.Roumpou M., Kilikoglou V., Suzanne Müller N., Kalogeropoulos N. Olive Oil in the Mediterranean Diet. Greek Lipid Forum; Athens, Greece: 2017. The use of olives and olive oil in the Aegean in antiquity. [Google Scholar]
- 3.Talhaoui N., Taamalli A., Gómez-Caravaca A.M., Fernández-Gutiérrez A., Segura-Carretero A. Phenolic compounds in olive leaves: Analytical determination, biotic and abiotic influence, and health benefits. Food Res. Int. 2015;77:92–108. doi: 10.1016/j.foodres.2015.09.011. [DOI] [Google Scholar]
- 4.Panel on Dietetic Products, Nutrition and Allergies Polyphenols in olive related health claims. EFSA J. 2011;9:2033. doi: 10.2903/j.efsa.2011.2033. [DOI] [Google Scholar]
- 5.Skaltsounis A.-L., Argyropoulou A., Aligiannis N., Xynos N. Recovery of high added value compounds from olive tree products and olive processing byproducts. In: Boskou D., editor. Olive and Olive Oil Bioactive Constituents. Elsevier; Amsterdam, The Netherlands: 2015. pp. 333–356. [Google Scholar]
- 6.Rahmanian N., Jafari S.M., Wani T.A. Bioactive profile, dehydration, extraction and application of the bioactive components of olive leaves. Trends Food Sci. Technol. 2015;42:150–172. doi: 10.1016/j.tifs.2014.12.009. [DOI] [Google Scholar]
- 7.Khan M.Y., Panchal S., Vyas N., Butani A., Kumar V. Olea europaea: A phyto-pharmacological review. Pharmacogn. Rev. 2007;1:114–118. [Google Scholar]
- 8.Hashmi M.A., Khan A., Hanif M., Farooq U., Perveen S. Traditional uses, phytochemistry, and pharmacology of Olea europaea (olive) J. Evid. Based Complement. Altern. Med. 2015;29:1–29. doi: 10.1155/2015/541591. [DOI] [PMC free article] [PubMed] [Google Scholar]
- 9.Barbaro B., Toietta G., Maggio R., Arciello M., Tarocchi M., Galli A., Balsano C. Effects of the olive-derived polyphenol oleuropein on human health. Int. J. Mol. Sci. 2014;15:18508–18524. doi: 10.3390/ijms151018508. [DOI] [PMC free article] [PubMed] [Google Scholar]
- 10.Lockyer S., Yaqoob P., Spencer J.P.E., Rowland I. Olive leaf phenolics and cardiovascular risk reduction: Physiological effects and mechanisms of action. Nutr. Aging. 2012;1:125–140. [Google Scholar]
- 11.Tsimidou M.Z., Papoti V.T. Bioactive Ingredients in olive leaves. In: Preedy V.R., Watson R.R., editors. Olives and Olive Oil in Health and Disease Prevention. Academic Press; San Diego, CA, USA: 2010. pp. 349–356. [Google Scholar]
- 12.Papoti V.T., Tsimidou M.Z. Looking through the qualities of a fluorimetric assay for the total phenol content estimation in virgin olive oil, olive fruit or leaf polar extract. Food Chem. 2009;112:246–252. doi: 10.1016/j.foodchem.2008.05.081. [DOI] [Google Scholar]
- 13.Ilarioni L., Proietti P. Olive tree cultivars. In: Peri C., editor. The Extra Virgin Olive Oil Handbook. Wiley; Hoboken, NJ, USA: 2014. [Google Scholar]
- 14.Kostelenos G. Elements of Olive Cultivation: History, Description, Distribution of Olive Cultivars in Greece. Embryo Publications; Athens, Greece: 2011. [Google Scholar]
- 15.International Olive Council (IOC) World Catalogue of Olive Varieties. IOC; Madrid, Spain: 2000. [Google Scholar]
- 16.International Olive Council (IOC) Overview of the Olive and Olive Oil Sector Itemised by Country and Based on the Official Replies to IOC Questionnaires. [(accessed on 24 June 2018)]; Available online: http://www.internationaloliveoil.org/estaticos/view/136-country-profiles.
- 17.Boskou G. Antioxidant capacity and phenolic profile of table olives from the Greek market. In: Watson R.R., editor. Olives and Olive Oil in Health and Disease Prevention. Academic Press; San Diego, CA, USA: 2010. pp. 925–934. [Google Scholar]
- 18.Brenes-Balbuena M., Garcia-Garcia P., Garrido-Fernandez A. Phenolic compounds related to the black color formed during the processing of ripe olives. J. Agric. Food Chem. 1992;40:1192–1196. doi: 10.1021/jf00019a023. [DOI] [Google Scholar]
- 19.Cvek J., Medić-Šarić M., Jasprica I., Zubčić S., Vitali D., Mornar A., Vedrina-Dragojević I., Tomić S. Optimisation of an extraction procedure and chemical characterisation of Croatian propolis tinctures. Phytochem. Anal. 2007;18:451–459. doi: 10.1002/pca.1001. [DOI] [PubMed] [Google Scholar]
- 20.Nenadis N., Tsimidou M. Observations on the estimation of scavenging activity of phenolic compounds using rapid 1,1-diphenyl-2-picrylhydrazyl (DPPH•) tests. J. Am. Oil Chem. Soc. 2002;79:1191–1195. doi: 10.1007/s11746-002-0626-z. [DOI] [Google Scholar]
- 21.Benzie I.F.F., Strain J.J. The ferric reducing ability of plasma (FRAP) as a measure of “antioxidant power”: The FRAP assay. Anal. Biochem. 1996;239:70–76. doi: 10.1006/abio.1996.0292. [DOI] [PubMed] [Google Scholar]
- 22.Obied H.K., Allen M.S., Bedgood D.R., Prenzler P.D., Robards K. Investigation of Australian olive mill waste for recovery of biophenols. J. Agric. Food Chem. 2005;53:9911–9920. doi: 10.1021/jf0518352. [DOI] [PubMed] [Google Scholar]
- 23.Goulas V., Papoti V.T., Exarchou V., Tsimidou M.Z., Gerothanassis I.P. Contribution of flavonoids to the overall radical scavenging activity of olive (Olea europaea L.) leaf polar extracts. J. Agric. Food Chem. 2010;58:3303–3308. doi: 10.1021/jf903823x. [DOI] [PubMed] [Google Scholar]
- 24.Putnik P., Barba F.J., Španić I., Zorić Z., Dragović-Uzelac V., Bursać Kovačević D. Green extraction approach for the recovery of polyphenols from Croatian olive leaves (Olea europea) Food Bioprod. Process. 2017;106:19–28. doi: 10.1016/j.fbp.2017.08.004. [DOI] [Google Scholar]
- 25.Tsakona S., Galanakis C.M., Gekas V. Hydro-ethanolic mixtures for the recovery of phenols from Mediterranean plant materials. Food Bioprocess Technol. 2012;5:1384–1393. doi: 10.1007/s11947-010-0419-0. [DOI] [Google Scholar]
- 26.Goulas V., Manganaris G. The effect of postharvest ripening on strawberry bioactive composition and antioxidant potential. J. Sci. Food Agric. 2011;91:1907–1914. doi: 10.1002/jsfa.4406. [DOI] [PubMed] [Google Scholar]
- 27.Bilgin M., Şahin S. Effects of geographical origin and extraction methods on total phenolic yield of olive tree (Olea europaea) leaves. J. Taiwan Inst. Chem. Eng. 2013;44:8–12. doi: 10.1016/j.jtice.2012.08.008. [DOI] [Google Scholar]
- 28.Boudhrioua N., Bahloul N., Ben Slimen I., Kechaou N. Comparison on the total phenol contents and the color of fresh and infrared dried olive leaves. Ind. Crops Prod. 2009;29:412–419. doi: 10.1016/j.indcrop.2008.08.001. [DOI] [Google Scholar]
- 29.Şahin S., Şamlı R. Optimization of olive leaf extract obtained by ultrasound-assisted extraction with response surface methodology. Ultrason. Sonochem. 2013;20:595–602. doi: 10.1016/j.ultsonch.2012.07.029. [DOI] [PubMed] [Google Scholar]
- 30.Papoti V.T. Ph.D. Thesis. Aristotle University of Thessaloniki; Thessaloniki, Greece: 2009. Exploitation of Bioactive Compounds for the Preparation of Dietary Supplements. The Case of Olea europaea L. Leaves. [Google Scholar]
- 31.Singh B., Singh J.P., Kaur A., Singh N. Phenolic composition and antioxidant potential of grain legume seeds: A review. Food Res. Int. 2017;101:1–16. doi: 10.1016/j.foodres.2017.09.026. [DOI] [PubMed] [Google Scholar]
- 32.Wu X., Beecher G.R., Holden J.M., Haytowitz D.B., Gebhardt S.E., Prior R.L. Lipophilic and hydrophilic antioxidant capacities of common foods in the united states. J. Agric. Food Chem. 2004;52:4026–4037. doi: 10.1021/jf049696w. [DOI] [PubMed] [Google Scholar]
- 33.Khiari Z., Makris D.P., Kefalas P. An investigation on the recovery of antioxidant phenolics from onion solid wastes employing water/ethanol-based solvent systems. Food Bioprocess Technol. 2007;2:337–343. doi: 10.1007/s11947-007-0044-8. [DOI] [Google Scholar]
- 34.Cacace J.E., Mazza G. Optimization of extraction of anthocyanins from black currants with aqueous ethanol. J. Food Sci. 2003;68:240–248. doi: 10.1111/j.1365-2621.2003.tb14146.x. [DOI] [Google Scholar]
- 35.Dhawan D., Gupta J. Comparison of different solvents for phytochemical extraction potential from datura metel plant leaves. Int. J. Biol. Chem. 2017;11:17–22. [Google Scholar]
- 36.Julkunen-Tiitto R., Nenadis N., Neugart S., Robson M., Agati G., Vepsalainen J., Zipoli G., Nybakken L., Winkler B., Jansen M.A.K. Assessing the response of plant flavonoids to UV radiation: An overview of appropriate techniques. Phytochem. Rev. 2015;14:273–297. doi: 10.1007/s11101-014-9362-4. [DOI] [Google Scholar]
- 37.Papoti V.T., Xystouris S., Papagianni G., Tsimidou M.Z. “Total flavonoid” content assessment via aluminum [Al(III)] complexation reactions. What we really measure? Ital. J. Food Sci. 2011;23:252–259. [Google Scholar]
- 38.Sultana B., Anwar F., Ashraf M. Effect of extraction solvent/technique on the antioxidant activity of selected medicinal plant extracts. Molecules. 2009;14:2167–2180. doi: 10.3390/molecules14062167. [DOI] [PMC free article] [PubMed] [Google Scholar]
- 39.Musa Özcan M., Matthäus B. A review: Benefit and bioactive properties of olive (Olea europaea L.) leaves. Eur. Food Res. Technol. 2016;243:89–99. doi: 10.1007/s00217-016-2726-9. [DOI] [Google Scholar]
- 40.Xie P.-J., Huang L.-X., Zhang C.-H., Zhang Y.-L. Phenolic compositions, and antioxidant performance of olive leaf and fruit (Olea europaea L.) extracts and their structure-activity relationships. J. Funct. Foods. 2015;16:460–471. doi: 10.1016/j.jff.2015.05.005. [DOI] [Google Scholar]
- 41.Gullón B., Lú-Chau T.A., Moreira M.T., Lema J.M., Eibes G. Rutin: A review on extraction, identification and purification methods, biological activities and approaches to enhance its bioavailability. Trends Food Sci. Technol. 2017;67:220–235. doi: 10.1016/j.tifs.2017.07.008. [DOI] [Google Scholar]
- 42.Oroian M., Escriche I. Antioxidants: Characterization, natural sources, extraction and analysis. Food Res. Int. 2015;74:10–36. doi: 10.1016/j.foodres.2015.04.018. [DOI] [PubMed] [Google Scholar]
- 43.Cömert E.D., Gökmen V. Evolution of food antioxidants as a core topic of food science for a century. Food Res. Int. 2018;105:76–93. doi: 10.1016/j.foodres.2017.10.056. [DOI] [PubMed] [Google Scholar]
- 44.Papoti V.T., Kizaki N., Skaltsi A., Karayannakidis P.D., Papageorgiou M. The phytochemical rich potential of acorn (Quercus aegilops) products and by products. Food Sci. Biotechnol. 2018;27:819–828. doi: 10.1007/s10068-017-0293-x. [DOI] [PMC free article] [PubMed] [Google Scholar]
- 45.Giuffrè A.M. The evolution of free acidity and oxidation related parameters in olive oil during olive ripening from cultivars grown in the region of Calabria, South Italy. Emir. J. Food Agric. 2018;30:539–548. [Google Scholar]
- 46.Manganaris G.A., Drogoudi P., Goulas V., Tanou G., Georgiadou E.C., Pantelidis G.E., Paschalidis K.A., Fotopoulos V., Manganaris A. Deciphering the interplay among genotype, maturity stage and low-temperature storage on phytochemical composition and transcript levels of enzymatic antioxidants in Prunus persica fruit. Plant Physiol. Biochem. 2017;119:189–199. doi: 10.1016/j.plaphy.2017.08.022. [DOI] [PubMed] [Google Scholar]
- 47.Lubinska-Szczygieł M., Różańska A., Namieśnik J., Dymerski T., Shafreen R.B., Weisz M., Ezra A., Gorinstein S. Quality of limes juices based on the aroma and antioxidant properties. Food Control. 2018;89:270–279. doi: 10.1016/j.foodcont.2018.02.005. [DOI] [Google Scholar]
- 48.Thaipong K., Boonprakob U., Crosby K., Cisneros-Zevallos L., Hawkins Byrne D. Comparison of ABTS, DPPH, FRAP, and ORAC assays for estimating antioxidant activity from guava fruit extracts. J. Food Compos. Anal. 2006;19:669–675. doi: 10.1016/j.jfca.2006.01.003. [DOI] [Google Scholar]
- 49.Kiritsakis K., Kontominas M.G., Kontogiorgis C., Hadjipavlou-Litina D., Moustakas A., Kiritsakis A. Composition and antioxidant activity of olive leaf extracts from Greek olive cultivars. J. Am. Oil Chem. Soc. 2010;87:369–376. doi: 10.1007/s11746-009-1517-x. [DOI] [Google Scholar]


