Abstract
Objective
To investigate the MR imaging diagnostic features of intracranial solitary fibrous tumors (ISFTs).
Materials and methods
Seven patients (mean age of 52.9 years; M:F=3:4) with histopathologically proven ISFTs were identified at our institute. Clinical presentations and pathological features were reviewed. MR Imaging findings including signal intensity, gadopentetate dimeglumine enhanced pattern, and diffusion-weighted imaging (DWI) characterization of the tumors were retrospectively evaluated.
Results
Six tumors showed a multi-lobular contour. Five tumors showed heterogeneous signal intensity, and two tumors showed homogeneous signal intensity on T1WI. Low signal intensity linear, curved or interlacing lines were observed within the tumors in all seven cases. Seven tumors demonstrated moderate or strong enhancement, six showed heterogeneous enhancement, and one homogenous enhancement. All tumors showed heterogeneous signal intensity on DWI.A ring-like high signal intensity band distributed around within the tumor was noted in six cases on DWI.
Conclusion
Diagnostic evidence for ISFT on MR image includes heterogeneous signal intensity, intense enhancement of T2 signal intensity, low signal intensity lines within the tumor, heterogeneous signal intensity on DWI and a ring-like band around the tumor on DWI.
Keywords: Intracranial Solitary Fibrous Tumor, Magnetic resonance imaging, Diffusion-weighted Imaging
Introduction
Intracranial solitary fibrous tumor (ISFT) is a rare neoplasm described in 19961. ISFTs are typically dural-based, CD34-positive neoplasms of mesenchymal origin, resembling other spindle cell tumors such as fibrous meningiomas and hemangiopericytomas. Pathological and immunohistochemical studies usually help to achieve an accurate diagnosis2,3.
ISFT is a slow growing tumor that is generally asymptomatic or manifested with similar clinical symptoms to other brain tumors4. Because of its rarity, literature information is limited to case reports or small series5–7.The paucity of specific characteristics in clinical presentation may responsible for missed diagnoses prior to surgery4. Previous studies showed that CT and MR image were reliable and practical techniques for detection and evaluation of ISFTs. Findings of imaging have been proved to provide important diagnostic clues of ISFTs6,8,9. However, the information about imaging feature of ISFTs is limited in the literature. In this study, we retrospectively reviewed seven pathologically proven ISFTs'cases with the purpose to be particularly focused on their specific MR performance.
Materials and methods
Seven patients with pathologically and immunohistochemically proven ISFTs were identified via systematic search of our radiology and pathology department database. Cases were identified from November, 2008 to-March, 2013. The clinical, pathological and imaging data were retrospectively reviewed. The study included three men and four 4 women with a mean age of 52.1 years (range: 43–64 years). In general, the clinical information was non-specific. The most common presenting symptom of the patients was headache (100%, 7/7) ranging from 1 month to 3 years. One patient had left-sided weakness, two patients had vertigo with blurring vision, and one patient had headache with hearing disturbances for 1 year.
All seven patients underwent MR imaging examinations. MRI studies were performed on a 1.5 T MR unit (Signa, GE Medical Sytems, WI, US). Imaging protocols included FSE T1 weighted images (T1WI), FSE T2WI, and axial fluid attenuated inversion recovery (FLAIR) sequence. Axial T1-weighted and T2-weighted images were obtained with the following sequences: TR/TE: 1696–1708 ms /18–28ms for T1WI; TR/TE: 3060–480ms-98–110 ms for T2WI; FOV, 18–20 cm; section thickness, 5 mm with a 1.5-mm gap; and matrix size, 256 × 256. Contrast-enhanced T1-weighted spin-echo images were performed in five patients with (TR/TE: 2642–2643 ms/15–17ms) obtained in the axial, sagittal, and coronal planes after intravenous injection of 0.2 mmol/kg of gadopentetate dimeglumine with a injection rate of 3 ml/s. Diffusion weighted MR imaging (DWI) was performed in all patients with single-shot gradient-echo echo-planar pulse sequence: TR/TE: 5800ms/8 ms; and b-values of 1000.
MR images were reviewed by two neuroradiologists (with experience of 8 and 10 years, respectively) at a digital picture-archiving and communication system (PACS) diagnostic workstation. Two readers together reviewed all MR imaging sets, and findings were determined by consensus. MR imaging morphological characteristics included the followinging: location, size, shape, internal component, margin of the lesion, and the change of the adjacent structures were evaluated. The signal intensity, the pattern of enhancement, and the data of DWI were also reviewed. The size of the lesion was measured at its greatest diameter. On the T1- and T2-weighted MR images, the signal intensity abnormalities were categorized as homogeneous or heterogeneous (low, iso, or high) signal intensity. The pattern of intratumoral enhancement was categorized as homogeneous or heterogeneous, and the degree of enhancement was categorized as weak, moderate or strong.
Histopathological and immunohistochemical studies were performed on the excised specimens. Diagnosis of ISFT was established on the basis of histopathologic appearance and immunohistochemical pattern of a diffuse and strong positive reaction for CD34.
Results
Tumor characteristics of the seven cases are displayed in Table 1. All tumors were extra-axial brain masses, originated from the meninges. Six tumors were supratentorial; one tumor was infratentorial. One tumor was located at the cerebellopontine angle, one tumor at the right temporal-occipital area, one tumor at the left occipital lobe area, two tumors at the frontal lobe areas, and two 2 tumors near the cerebral falx on the right side. The mean maximum diameter of the tumors was 48.1mm (range, 13.6–68.8mm). All tumors were well-circumscribed solid, three tumors showed cystic change. Six tumors were multilobular, one small tumor was a smooth unilobular.
Table 1.
The tumor characteristics of the seven intracranial solitary fibrous tumor cases.
| No | Size (cm) | location | Margin | Morphology |
| 1 | Isointensity | Heterogeneous | Strong heterogeneous | Heterogeneous |
| 2 | Isointensity | Heterogeneous | Moderate heterogeneous | Heterogeneous |
| 3 | Hypointensity | Black-white | Strong heterogeneous | Heterogeneous |
| 4 | Hypointensity | Heterogeneous | Strong homogeneous | Heterogeneous |
| 5 | Isointensity | Heterogeneous | Moderate heterogeneous | Heterogeneous |
| 6 | hypointensity | Heterogeneous | Strong heterogeneous | Heterogeneous |
| 7 | hypointensity | Black-white | Strong heterogeneous | Heterogeneous |
The detailed MRI findings of the seven cases are summarized in Tables 2 and 3. On MR imaging, six tumors showed mass effect. Four tumors showed a homogeneous isotensity signal intensity, and three tumors showed slightly low signal intensity on T1WI. All tumors illustrated heterogeneous signal intensity on T2WI, two tumors showed substantial “black and white” patterns. Mixed hyperintense, isointense, and hypointense signal were seen in five lesions. Linear, curved and/or interweave low signal intensity lines within the lesions were found in all seven tumors.
Table 2.
Magnetic resonance imaging findings from the seven intracranial solitary fibrous tumor cases
| No | T1WI | T2WI | Enhancement pattern | DWI |
| 1 | Isointensity | Heterogeneous | Strong heterogeneous | Heterogeneous |
| 2 | Isointensity | Heterogeneous | Moderate heterogeneous | Heterogeneous |
| 3 | Hypointensity | Black-white | Strong heterogeneous | Heterogeneous |
| 4 | Hypointensity | Heterogeneous | Strong homogeneous | Heterogeneous |
| 5 | Isointensity | Heterogeneous | Moderate heterogeneous | Heterogeneous |
| 6 | hypointensity | Heterogeneous | Strong heterogeneous | Heterogeneous |
| 7 | hypointensity | Black-white | Strong heterogeneous | Heterogeneous |
Table 3.
Magnetic resonance imaging findings from the seven intracranial solitary fibrous tumor cases
| No | Flow void |
Low signal lines |
Mass effect |
Cystic change |
Necrosis | edema | Dural-tail | Ring-like band |
Restricted diffusion |
| 1 | yes | yes | yes | periphery | No | No | Yes | yes | Yes |
| 2 | yes | yes | yes | No | center | Yes | Yes | yes | No |
| 3 | yes | yes | yes | No | No | Yes | No | yes | No |
| 4 | yes | yes | no | no | No | No | No | no | No |
| 5 | yes | yes | yes | periphery | center | Yes | No | yes | Yes |
| 6 | yes | yes | yes | center | center | Yes | No | yes | Yes |
| 7 | yes | yes | yes | no | no | yes | yes | yes | no |
The lines llustrated an irregular interlace pattern, and were clearly showed on T2WI (Figure 1; Figure 2) Some lines might show unmarked on T1WI that needed to be careful observation and definition. Three tumors found cystic change areas in the peripheral region of the lesion, one tumor showed multiple cystic change areas within tumor. All cystic change regions showed high signal on T2WI, low signal on T1WI, without enhancement on contrast enhance T1WI. Peri-tumor fluid collection was noted in three tumors. Seven tumors showed irregular flow voids within the tumor or at the periphery of the tumor clearly demonstrated on T2WI.
Figure 1.
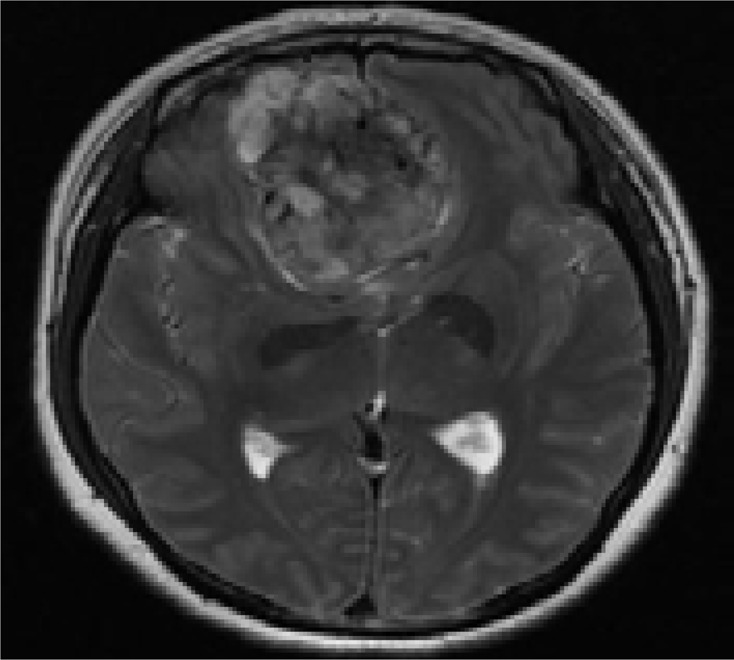
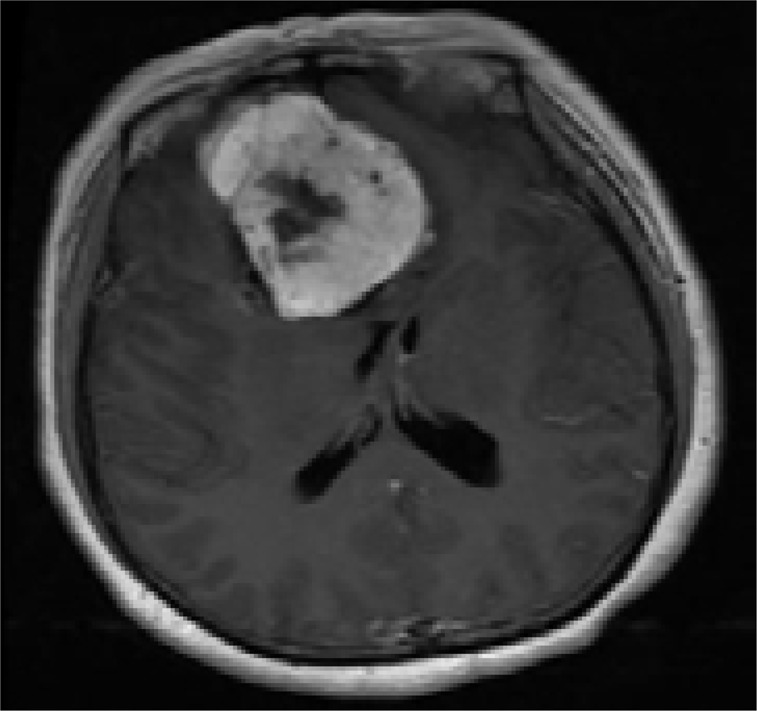
A 48-year-old woman with headache for 1 year: A. T2WI axial MR image. Low signal intensity lines, and flow voids are clearly illustrated;
B. Contrast-enhanced image shows intense homogeneous enhancement; necrosis area is located in the central part of the tumor (without enhancement).
Figure 2.
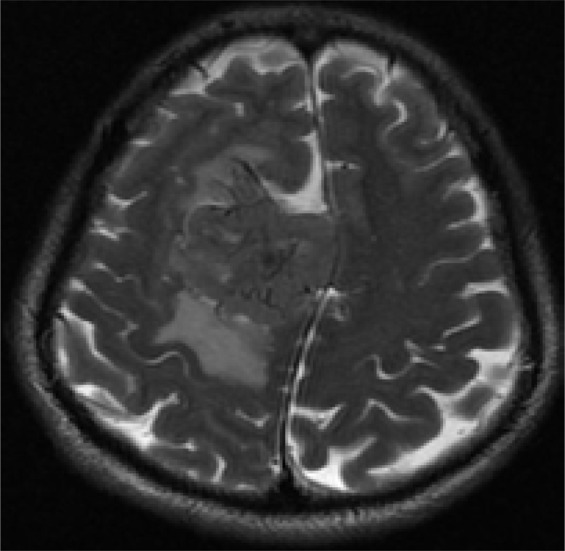
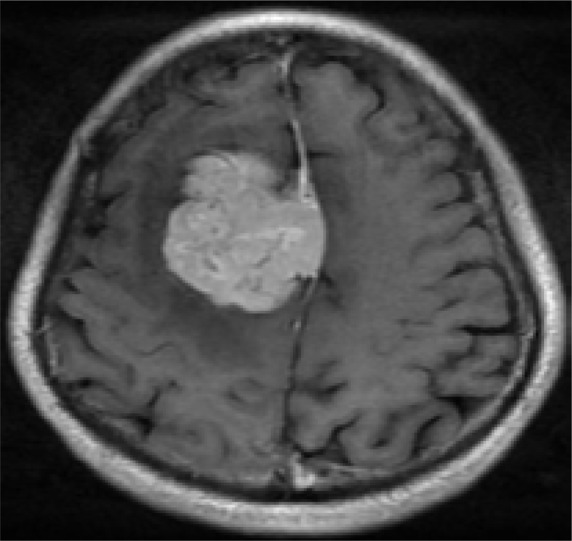
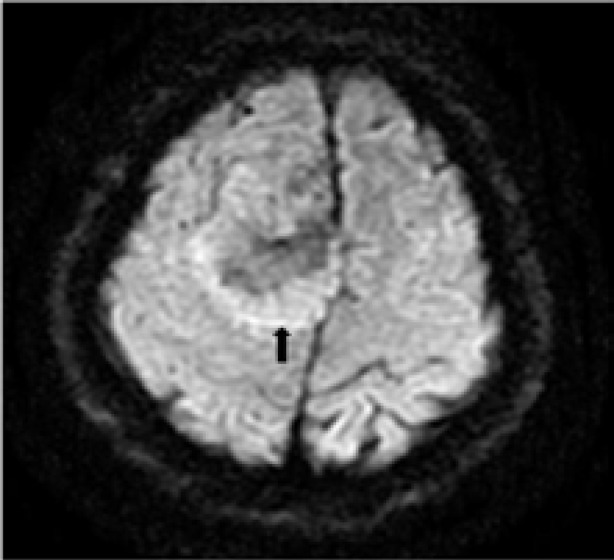
A 43-year-old man with headache and dizziness for 1 month: A.T2WI axial MR image shows a large lobulated mass located near cerebral falx of the right side with homogenous isotensity signal intensity. The irregular linear, strip low signal intensity lines are clearly illustrated.
B. The tumor shows intensely homogeneous enhancement after Gadopentetate Dimeglumine administration. Note: the “dural tail” sign(arrow)
C. A ring-like high signal intensity band around the tumor is clearly demonstrated on DWI(arrow).
On gadopentetate dimeglumine enhanced imaging, all tumors showed intense enhancement, six tumors showed heterogeneous enhancement, and one showed homogeneous enhancement. Both low T2WI signal intensity areas and high T2WI signal intensity areas showed substantial enhancement. However, the degree of enhancement was related to the T2WI signal intensity. The higher T2WI signal intensity areas exhibited stronger enhancement compared to the low T2WI signal intensity areas. Necrosis areas within the central part of the tumor were seen on one tumor(Figure 1). Three tumors demonstrated a “dural tail” sign(Figure 2). Peri-tumoral edema was seen in four tumors.
On DWI, all tumors showed heterogeneous signal intensity. Marked high signal intensity restricted diffusion areas were found in three tumors. The high T2WI signal intensity areas showed slightly high signal intensity compared with low T2WI signal intensity areas on DWI. A ring-like high signal intensity band distributed around within the tumor was noted in six cases(Figure 2).
Microscopic examination, the tumors showed a fascicular proliferation pattern with irregular intercellular collagen bundles. The spindle and oval cell with ovoid nuclear and less cytoplasm were found in all tumors, they exhibited a patternless architecture. Immunohistochemical studies showed that 100% (7/7) tumors were CD 34 positive reaction, 100% (7/7) were CD 99 positive reaction, 100% (3/3) BcL-2 positive reaction, 57.1% (4/7) vimenin positive reaction; S-100 negative reaction was noted in 100% (4/4), and PR negative reaction in 100% (4/4) were established.
Discussion
Solitary fibrous tumor (SFT), a rare mesenchymal neoplasm, was first described by Klemperer and Rabin10. Primary SFT involving the central nervous system (CNS) was described as a distinct pathological entity in 1996 by Carneiro et al1, who reported five 5 ISFTs and two spinal SFTs that were distinguished from fibrous meningioma by pathological and immunohistochemical findings.
ISFT can occur at any age with the largest proportion occurring at 51–60 years. It occurs roughly equally in males and females (F:M=49.4% :50.6%). The mean greatest diameter is 4.9 cm (range 1.3–9cm)11. Majority of ISFTs (87%) arise from the extra-axial space11, with a meningeal and a dura-based attachment1,7,12. However, intra-axial of brain parenchyma and ventricles have also been reported3,7,13,14. The extra-axial tumors without connected with the dura were about of 13%11. A review by Fargena et al12 showed that most ISFT were located along the tentorium cerebelli (16%) followed by the frontal convexity, the cerebellopontine angle (CPA), the ventricles, the falx cerebri and the posterior fossa. It has been reported that 51% of ISFTs were supratentorial, and 34.4% were infratentorial11. Metellus et al15 reported that 33.3% solitary fibrous tumor of the central nervous system were located in the posterior fossa, supratentorial in 22.2%.By contrast, in our small series, 85.7% (6/7) were supratentorial. The typical histologic features of ISFT are uniform spindle or oval cells arranged in a variable collagenous background or in interlacing fascicles, with prominent collagenous bands, and branching vascular channels with thin walls1,16. The amount of collagen and vascularity varies from tumor to tumor. Immunohistochemical study is a reliable method to identify the ISFT. The unique characteristic of SFTs is strong reactivity of the spindle cells for CD34 and a positive reaction for vimentin and BCL-2 EMA and S-100 are usually negative. The differential diagnosis of ISFT mainly includes fibroblastic meningioma and meningeal HPC. Although hemangiopericytoma also shows a positive reaction with vimentin and sometimes CD34, the reactivity is mild. Fibrous meningioma is usually positive for EMA (80%) and negative (or mildly positive) for CD341, 3, 16. In our cases, 100% (7/7) tumors were CD 34 positive reaction, 100% (3/3) bcl-2 positive reaction; and 100% (4/4) lesions were S-100 negative reaction.
On MR imaging, the ISFTs exhibited a diverse characteristics, with the appearance on the particular tissue components within the tumors. Generally, it was isointense on T1WI, and iso to hyperintense on T2WI, with intense heterogeneous or homogeneous enhancement17,18. Weon et al6 found that ISFTs mainly showed two different MR imaging features that was high or isosignal intensity on T1WI and low signal intensity on T2WI; and the isosignal or low signal intensity on T1WI and high signal intensity on T2WI.
Variable signal intensity showed on T2WI was noted by several studies, majority of tumors showed a heterogeneous pattern, a marked low signal intensity and high signal intensity presenting as a “black-and-white” mixed pattern has been accepted as an important feature in characterization of ISFT6,16, these mixed signals were corresponded to the heterogeneous of areas with different cellularity, which was one of the pathological features of SFT19. In our group, two tumors illustrate a marked “black- and-white” pattern. Previous studies have also established that the varied MR images were mainly due to the different hypercellular and fibrous hypocellular component particular to the amount of collagen, fibroblasts and degeneration. The tumor signal intensity on the T2WIs decreased as the collagenous component increased. Thus, the T2WI was useful for excluding hemangiopericytomas, because it did not contain the areas of thick bands of collagen which appeared as hypointense on the T2WI17,18.
Interestingly, findings of our study showed that 100% (7/7) of ISFTs had the linear, curved and/or interweave low signal intensity lines within the tumor. The lines were irregular interlace pattern clearly showed on T2WI. We presumed that these lines might be the bands of collagen or fibrosis17,18. Similar findings were also noted by previous investigators. Kim et al9 reported four 4 SFTs with that imaging feature. Pathological examination has established that those lines corresponded to the hypocellular collagenous stroma intervening in the hypercelluar area, and this hypocellular collagenous stroma was composed of a haphazard proliferation of spindle cells9. The authors recommended that hypointense lines were helpful in the differential diagnosis of masses involving the intracranial and extracranial head and neck regions. Based on a literature review and the results of our study, we believe that low signal intensity lines within the tumor may be a unique MR imaging feature of ISFTs, as ISFT contains collagen and fibrotic bands.
The contrast enhanced MR imaging also provided valuable imaging features in our study. All tumors demonstrated intense heterogeneous enhancement (n=6) and homogeneous enhancement (n=1). The enhancement degree of the lesions was associated with T2WI signal intensity. Although low T2WI signal intensity areas showed substantially intense enhancement, the enhancement degree of the higher T2WI signal intensity areas exhibited stronger than those of low T2WI signal intensity areas. Clarencon et al7 reported that the hypointense T2 signal intensity areas showed strong enhancement after contrast administration in the majority of ISFTs. But, this enhanced imaging feature was not showed in hemangiopericytomas6,7,9. The substantial intense enhancement was probably a result of rich vascularity of the SFT17,18. The “dural tail”, a non-specific sign for any extra-axial lesion, is usually considered as one of main MRI characteristics in meningiomas. Absent this sign has been suggested to be a diagnostic clue for ISFT by some researcher7,15. Contrary, several studies demonstrated that the “dural tail”was not uncommon seen in ISFTs6,9,18. In our group, three 3tumors had this sign on contrast enhanced MRI.
DWI reflects the random thermal motion of molecules (Brownian motion). The ADC value is used to quantify the Brownian motion, and decreased movement of molecules in tissue correlates with a low ADC value. Recent studies have reported that ADC values and maps from DWI were very useful for detecting malignant lesions and evaluating their extent in SFT occurred in pleura20. In general, hyperintense areas on DWI present a restricted diffusivity. Based on pathological findings and literature review, Clarencon et al7 speculated that the hypercellular areas found in ISFTs might be responsible for the decreased ADC. In our study, three tumors had high signal intensity restricted diffusion areas. We also noted that all tumors demonstrated heterogeneous signal intensities on DWI, the intensity of the lesion on DWI also seemed to be related to the T2WI signal intensity. A ring-like high signal intensity band distributed around within the tumor on DWI was seen in five 5 cases. The restricted diffusion areas are hypercellular, and there are branching vascular channels with thin walls in the mesenchyme; these are considered focal hemangiopericytoma-like pattern areas21. Therefore, even if DWI performance helps to obtain accurate diagnosis of ISFTs, nevertheless more information is required to confirm the diagnosis.
Conclusion
ISFT is rare entity. Limited imaging information remains a diagnostic challenging. The accurate diagnosis is mainly relied on histopathological and immunohistochemical studies. Based on our current study, we can conclude that several MR image manifestations may provide effective evidence for diagnosis of ISFTs. The main diagnostic features on MR imaging are as follows: a well-defined, multilobular mass with homogeneous iso or hypointense signal on T1WI, variably heterogeneous on T2WI, T2 signal related intense enhancement, linear, curve, interweave low signal lines within the tumor, high signal restricted diffusion areas within tumor on DWI and a ring-like high signal intensity band around the tumor.
Conflict of interest
None.
References
- 1.Carneiro SS, Scheithauer BW, Nascimento AG, et al. Solitary fibrous tumor of the meninges: a lesion distinct from fibrous meningioma. A clinicopathologic and immunohistochemical study. Am J Clin Pathol. 1996;106:217–224. doi: 10.1093/ajcp/106.2.217. [DOI] [PubMed] [Google Scholar]
- 2.Yilmaz C, Kabatas S, Ozen OI, et al. Solitary fibrous tumor. J Clin Neurosci. 2009;16:1578–1581. doi: 10.1016/j.jocn.2009.02.039. [DOI] [PubMed] [Google Scholar]
- 3.Tihan T, Viglione M, Rosenblum MK, et al. Solitary fibrous tumors in the central nervous system. A clinicopathologic review of 18 cases and comparison to meningeal hemangiopericytomas. Arch Pathol Lab Med. 2003;127:432–439. doi: 10.5858/2003-127-0432-SFTITC. [DOI] [PubMed] [Google Scholar]
- 4.Kasper E, Boruchow S, Lam FC, et al. “Hitting all the right markers to save a life” Solitary fibrous tumors of the central nervous system: Case series and review of the literature. Surg Neurol Int. 2012;3:83. doi: 10.4103/2152-7806.99173. [DOI] [PMC free article] [PubMed] [Google Scholar]
- 5.Boada M, Gomez E, Puig J, et al. Intraventricular fibrous tumor: a case report. Radiologia. 2009;51:512–515. doi: 10.1016/j.rx.2009.04.010. [DOI] [PubMed] [Google Scholar]
- 6.Weon YC, Kim EY, Kim HJ, et al. Intracranial solitary fibrous tumors: imaging findings in 6 consecutive patients. AJNR Am J Neuroradiol. 2007;28:1466–1469. doi: 10.3174/ajnr.A0609. [DOI] [PMC free article] [PubMed] [Google Scholar]
- 7.Clarencon F, Bonneville F, Rousseau A, et al. Intracranial solitary fibrous tumor: imaging findings. Eur J Radiol. 2011;80:387–394. doi: 10.1016/j.ejrad.2010.02.016. [DOI] [PubMed] [Google Scholar]
- 8.Bisceglia M, Dimitri L, Giannatempo G, et al. Solitary fibrous tumor of the central nervous system: report of an additional 5 cases with comprehensive literature review. Int J Surg Pathol. 2011;19:476–486. doi: 10.1177/1066896911405655. [DOI] [PubMed] [Google Scholar]
- 9.Kim HJ, Lee HK, Seo JJ, et al. MR imaging of solitary fibrous tumors in the head and neck. Korean J Radiol. 2005;6:136–142. doi: 10.3348/kjr.2005.6.3.136. [DOI] [PMC free article] [PubMed] [Google Scholar]
- 10.Klemperer P RC. Primary neoplasms of the pleura. A report of five cases. Arch Pathol. 1992:385–412. doi: 10.1002/ajim.4700220103. [DOI] [PubMed] [Google Scholar]
- 11.Bisceglia M, Galliani C, Giannatempo G, et al. Solitary fibrous tumor of the central nervous system: a 15-year literature survey of 220 cases (August 1996-July 2011) Adv Anat Pathol. 2011;18:356–392. doi: 10.1097/PAP.0b013e318229c004. [DOI] [PubMed] [Google Scholar]
- 12.Fargen KM, Opalach KJ, Wakefield D, et al. The central nervous system solitary fibrous tumor: a review of clinical, imaging and pathologic findings among all reported cases from 1996 to 2010. Clin Neurol Neurosurg. 2011;113:703–710. doi: 10.1016/j.clineuro.2011.07.024. [DOI] [PubMed] [Google Scholar]
- 13.Kim KA, Gonzalez I, McComb JG, et al. Unusual presentations of cerebral solitary fibrous tumors: report of four cases. Neurosurgery. 2004;54:1004–1009. doi: 10.1227/01.neu.0000115675.74366.87. discussion 9. [DOI] [PubMed] [Google Scholar]
- 14.Montano N, Doglietto F, Lauriola L, et al. Solitary fibrous tumour of the IV ventricle. Br J Neurosurg. 2010;24:495–496. doi: 10.3109/02688691003675226. [DOI] [PubMed] [Google Scholar]
- 15.Metellus P, Bouvier C, Guyotat J, et al. Solitary fibrous tumors of the central nervous system: clinicopathological and therapeutic considerations of 18 cases. Neurosurgery. 2007;60:715–722. doi: 10.1227/01.NEU.0000255418.93678.AD. discussion. [DOI] [PubMed] [Google Scholar]
- 16.Chan JK. Solitary fibrous tumour--everywhere, and a diagnosis in vogue. Histopathology. 1997;31:568–576. doi: 10.1046/j.1365-2559.1997.2400897.x. [DOI] [PubMed] [Google Scholar]
- 17.Tateishi U, Nishihara H, Morikawa T, et al. Solitary fibrous tumor of the pleura: MR appearance and enhancement pattern. J Comput Assist Tomogr. 2002;26:174–179. doi: 10.1097/00004728-200203000-00002. [DOI] [PubMed] [Google Scholar]
- 18.Martin AJ, Fisher C, Igbaseimokumo U, et al. Solitary fibrous tumours of the meninges: case series and literature review. J Neurooncol. 2001;54:57–69. doi: 10.1023/a:1012553119349. [DOI] [PubMed] [Google Scholar]
- 19.Nawashiro H, Nagakawa S, Osada H, et al. Solitary fibrous tumor of the meninges in the posterior cranial fossa: magnetic resonance imaging and histological correlation--case report. Neurol Med Chir (Tokyo) 2000;40:432–434. doi: 10.2176/nmc.40.432. [DOI] [PubMed] [Google Scholar]
- 20.Inaoka T, Takahashi K, Miyokawa N, et al. Solitary fibrous tumor of the pleura: apparent diffusion coefficient (ADC) value and ADC map to predict malignant transformation. J Magn Reson Imaging. 2007;26:155–158. doi: 10.1002/jmri.20942. [DOI] [PubMed] [Google Scholar]
- 21.Kim HJ, Kim HJ, Kim YD, et al. Solitary fibrous tumor of the orbit: CT and MR imaging findings. AJNR Am J Neuroradiol. 2008;29:857–862. doi: 10.3174/ajnr.A0961. [DOI] [PMC free article] [PubMed] [Google Scholar]


