Abstract
Introduction
Internal and external quality control (QC) of rapid diagnostic tests (RDTs) is important to increase reliability of RDTs currently used to diagnose malaria. However, cross-checking of used RDTs as part of quality assurance can rarely be done by off-site personnel because there is no guarantee of retaining visible test lines after manufacturers’ recommended reading time. Therefore, this study examined the potential of using Fionet™ technology for remote RDT quality monitoring at seven clinics, identifying reasons for making RDT processing and interpretation errors, and taking corrective actions for improvement of diagnosis and consequently improved management of febrile patients
Methods
The study was conducted at seven military health facilities in Mainland Tanzania and utilized RDTs capable of detecting Plasmodium falciparum specific Histidine-rich protein 2 (Pf-HRP2) and the genus specific Plasmodium lactate dehydrogenase (pLDH) for other species of plasmodium (P. vivax, P. malariae or P. ovale; pan-pLDH). Patients’ data and images of processed RDTs from seven clinics were uploaded on a Fionet web portal and reviewed regularly to monitor preparation procedures and visual interpretation of test results compared to automated analysis using the Deki reader of RDT. Problems detected were rapidly communicated to remote laboratory personnel at the clinic for corrective action and follow-up of patients who were falsely diagnosed as negative and missed treatment. Factors contributing to making errors in visual interpretation of RDT results were analyzed during visits to the health facilities.
Results
A total of 1,367 (1.6%) out of 83,294 RDT test images uploaded to the Fionet portal had discordant test results of which 822 (60.1%) and 545 (39.9%) were falsely reported as negative and positive, respectively. False negative and false positive test results were common for a single test line in 515 (62.7%) and 741 (54.2%) tests, respectively. Out of 1,367 RDT images assessed, 98 (7.2%) had quality problems related to preparation procedures of which 95(96.9%) errors were due to putting too much blood on the sample well or insufficient buffer in the respective wells. The reasons for discrepant results included, false reporting of none existent lines in 526 (38.5%) tests, missing a faint positive line in 493 (36.1%), missing a strong positive line in 248(18.1%) and errors caused by poorly processed RDTs in 96 (7.2%) tests. Among the false negative tests (n = 822), 669 (48.9%) patients were eligible for follow–up and only 339 (48.5%) were reached and 291 (85.8%) received appropriate anti-malaria therapy.
Conclusion
Fionet technology enabled remote monitoring of RDT quality issues, identifying reasons contributing to laboratory personnel making errors and provided a rapid method to implement corrective actions at remote sites to improve malaria diagnosis and consequently improved health care management of febrile patients infected with malaria.
Introduction
Malaria rapid diagnostic tests (RDTs) have become a reliable technique for confirmation of malaria infection and providing results for guiding patient treatment [1–3].The technique is now widely used [4]especially in settings with limited resources and where microscopy is not feasible due to its well documented limitations [5–7]. RDT tests do not require sophisticated infrastructure, are easily performed and the results correctly interpreted appropriately by trained health care workers even those with limited laboratory training or experience [8].
Despite their wide use in malaria diagnosis, RDTs face multiple potential quality problems starting at manufacturing through production transportation, storage and end-user’s performance [9]. False RDT results due to problems at any of the above stages may lead to increased malaria transmission[10], unnecessary exposure to anti-malaria therapy, increased risk of a lack of treatment for other diseases that cause fevers [11,12], and development of resistance by Plasmodium species.The Global Malaria program of the World Health Organization (WHO) has set up a comprehensive quality control (QC) strategy at levels of production, transport and product control in national reference laboratories as well as a lot testing program [13]. Many malaria programs, however, lack quality control (QC) processes to assess the use of RDTs under field conditions in order to ensure that they are still functioning properly after exposure to variable transport and storage conditions [14–16].
According to the WHO guidelines, the QC of RDTs describes all the activities to be undertaken by a laboratory to monitor each stage of a test procedure to ensure that RDTs are performed correctly and accurately interpreted to give precise results [17]. [18]. The recently developed positive control wells containing recombinant malaria antigen is a step forward for QC of RDT kits at the point of care which will help to improve the confidence of health workers in RDT results [16,19,20]. Findings from pilot studies in field conditions in Kenya and Tanzania suggest that this means of RDT quality assurance could improve health worker adherence to RDT testing procedures [20]. The dried tube specimen (DTS) method has also been tested and can be used under field conditions where appropriate [21].
In a previous study organized a short messaging systems (SMS) based external quality assurance procedure transmitting high resolution photographs of used RDT to enhance correct reading and interpretation of RDTs among laboratory health workers [22,23]. In order to enhance improvement of RDT quality control, Fio Corporation based in Toronto, Canada, innovated the use of its Fionet platform for remote monitoring and provision of real-time feedback on RDT testing conducted by users at clinics [24]. The Fionet system uses a device called Deki Reader™ which combines standard mobile devices with custom software to gather demographic patient data, provide guidance to health care workers on conducting testing, taking pictures of completed RDT assays, transmits data over commercially available cell phone services. It also contains a web portal for uploading processed RDT images, transmission of patient demographic information, and remote storage and access of the data [25–29]. This mobile health technology platform has been successfully used in small programs for quality assurance and quality improvement of malaria diagnosis by community health workers in Kenya [24].
In this study, an assessment was conducted on the potential application of Fionet technology for remote RDT quality monitoring at seven military clinics, identifying reasons for making RDT processing and interpretation errors, and taking corrective actions for improvement of diagnosis and consequently improved management of febrile patients.
Materials and methods
Study area
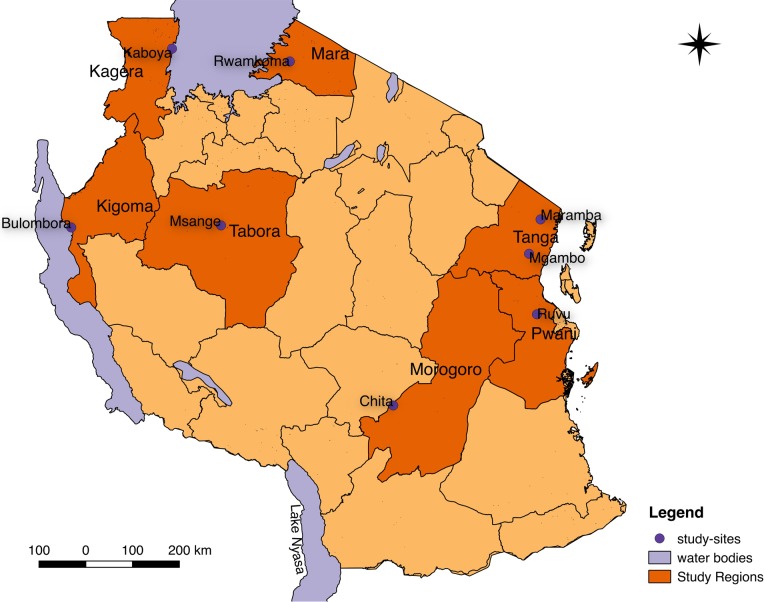
The study was conducted in seven rural military health facilities in Tanzania (Fig 1) including Ruvu (Coastal region), Mgambo and Maramba (Tanga region), Bulombora (Kigoma region), Chita (Morogoro region), Rwamkoma (Mara region) and Msange (Tabora region). The regions have varying malaria transmission intensity as previously shown by the nation-wide surveys [30–32]. The selected health facilities are owned by the Tanzanian national service commonly known as “Jeshi la Kujenga Taifa” (JKT), which is under the Tanzania Peoples Defense Forces (TPDF), and these facilities are primarily dispensaries serving both outpatients and inpatients.
Fig 1. Map of Tanzania showing distribution of study sites.
The map was generated using shape files and data using qGIS {version 3.2 (Bonn)} which is open source program [33].
Study design, populations and period
The study employed an analytical cross-sectional design and was nested on an ongoing larger study on the surveillance and quality improvement of malaria diagnosis in military health facilities. The study population was routine outpatients (military staff, recruits and civilians) of all ages and sex and ages seen at outpatient departments (OPDs) at the seven health facilities. This study was conducted for three years from January, 2014 to December, 2016.
Selection of study participants
Patients who presented at an OPD with fever occurring within a 24-hour period prior to presentation were conveniently sampled for the study. Sampling was done after obtaining a voluntary written consent from patients or parents/care-takers in case of children.
Training users on Fionet technology
A total of 16 project staff identified for data collection were trained on Fionet technology for three days. Of these, 14 were routine laboratory assistants identified as users of Deki Readers at clinic facilities and two were study investigators who worked as study monitors at the project base located in Dar es Salaam. Two laboratory assistants were selected from each of the seven study health facilities. On the first day of training, all project staff were trained on theoretical overview of Fionet technology. On the second day, laboratory assistants were trained on operating and using the Deki Readers while monitors were trained on how to remotely monitor laboratory personnel at clinic sites using the Fionet portal and mobile communication. On the third day, practical sessions were done as trials for preparing and reading RDTs, uploading data, and accessing data and reports in the portal. The study utilized a one step 05fk60 SD Bioline Malaria Antigen Pf/pan RDT cassettes from Standard Diagnostics Inc (Republic of Korea) capable of detection of malaria infection in whole blood of Plasmodium falciparum specific Histidine-rich protein 2 (Pf-HRP2) and the Plasmodium lactate dehydrogenase (pLDH) for other Plasmodium species (P. vivax, P. malariae or P. ovale, pan-pLDH). Monitors and laboratory personnel were also trained on how to communicate through two ways messaging between the Deki Reader and the portal as well as telephone conversations and SMS when errors were encountered and corrective actions were required. The data collection methods were piloted for one week as “extended training” and this training has been reported elsewhere [29]. Occasionally, in some health facilities, trained laboratory personnel were either transferred to other facilities or recruited for further studies and they were replaced by untrained personnel. In this scenario, untrained personnel received initial training from their peer laboratory personnel on how to use Deki Reader and perform RDTs but did not perform the tests for patients until after they were formally trained by study monitors during quarterly supportive supervision visits
Data collection procedures
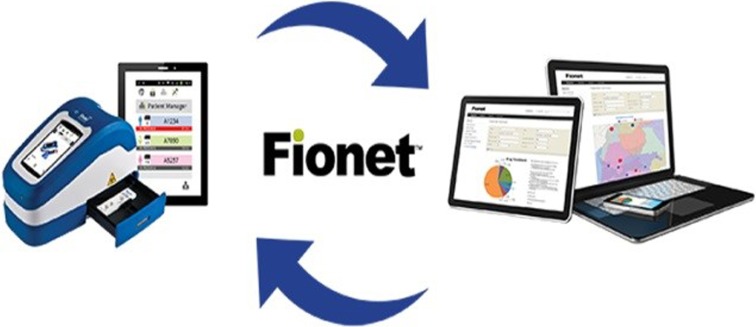
Data collection was done using Fionet technology (Fig 2). The laboratory personnel performed RDT testing using the Deki Reader, read the results, and directly submitted patient demographic data, manual laboratory evaluation of the RDT result, automated Deki Reader evaluation of the RDT result, and high resolution RDT test images to the portal as previously described [26,28,29]
Fig 2. Fionet platform for data capture and quality improvement of RDT.
(Reprinted from Fio Corporation marketing materials under a CC BY license, with permission from Fio Corporation, original copyright 2015).
Monitors used secure Fionet accounts to review records and RDT images uploaded to the web portal. HHuman errors in preparation procedures and interpretation of test results were investigated; but errors due to manufacturing, transportation, storage and effect of antigen/antibodies on the cassettes and other testing issues were not studied. The Deki Reader was considered superior to human interpretation of RDTs and hence the difference of test results between the two methods was regarded as “discordant results”. The study monitors rapidly contacted laboratory personnel through telephone calls or alert messages, for corrective actions of any detected errors. The study monitors also communicated test results reported falsely as negative to re-check patients’ results in the laboratory register. Laboratory personnel also followed- up with patients who missed treatment to present to clinic for appropriate treatment. Patients treated on follow-up or otherwise were analyzed and confirmed during physical quarterly site visits by the study monitors. Due to limited time and other logistical problems, civilians with false negative test results did not receive a follow-up visit. After confirmation of discrepant laboratory results, some patients who missed treatment on their first clinic visit due to false negative results were treated after their second clinic visit.
Reasons contributing to errors in visual interpretation of RDT results by laboratory staff were analyzed regularly by the study monitors through reviewing images of RDTs in the portal, recorded results in the laboratory registers, review of automated analysis results, and re-interpretation of stored old RDTs (if readable) during physical visits to the study sites. The overall results were compiled to help take corrective measures to improve malaria diagnosis. During physical visits at the clinic sites, monitors also verified laboratory records and patient records to confirm patients re-tested and treated after follow-up.
Ethical issues
The study received ethical approval from the National Medical Research Coordinating Committee (MRCC) of the National Institute for Medical Research (NIMR) and from Kilimanjaro Christian Medical University College’s (KCMUCo) Ethics Review Committee. Permission to conduct the study in military health facilities was granted by the Chief of Medical Services at the headquarters of the TPDF and the Commanding Officers (COs) of the respective military camps where the health facility was housed. Participants were informed about the nature and aims of the study, and its benefits and risks. They were also sensitized about the study and malaria diagnosis using RDT with Deki Readers before voluntarily consenting to participate. Military officers were not involved in the consenting process involving junior military personnel to avoid coercion. Only unique identification numbers for each patient and not personal identifiers such as names and initials were used in the data collection process. The national malaria treatment guidelines were used to treat patients with positive results by RDT as interpreted visually on their first clinic visit and after follow-up in case false negative results were detected by Deki Readers.
Data management
Data were entered by using the screen interface of the Deki Reader, which was connected to the national mobile network and data encryption was used to transmit data to the secured portal. In the portal, secured data were accessed by accredited project staff (study monitors) through a password-protected website with access controlled by the study managers. The test results were transferred to Microsoft Excel and assessed to detect discrepancies between visual and DR-interpreted RDT results. These were merged with another Excel dataset that included review information from the laboratory register, results of re-reading old RDTs, reasons for false results and patient follow-up data.
The data was then checked and transferred to STATA software (STATA Corp, College Station, TX) for analysis (S1). Descriptive statistics was used to describe the basic features of the data, proportions of discordant test, RDT quality problem due to interpretation procedures. Reasons for making errors in interpretation of RDT results and their corresponding 95% confidence intervals were analyzed using the Wilson score method. Simple graphic to describe errors in RDT preparation and interpretation of RDTs by facility and years are presented. Statistical significance was reported at p < 0.05
Results
Baseline characteristics of the study population
Out of 83,294 RDT images uploaded to the web portal, 2,008 were found to have discordant results after comparing laboratory personnel derived manual RDT results against results obtained by automated analysis using Deki Readers. Through analysis by study monitors and communication with laboratory personnel at clinic sites it was revealed that laboratory personnel erroneously transposed the results of 641(0.8%) tests when entering the results in the Deki Readers. They reported results as false negative as opposed to true positive results entered into the laboratory records at the clinic sites, and these results were therefore excluded from the analysis. Thus, a total of 1,367(1.6%) out of 83,294 RDT images uploaded to the Fionet portal were confirmed to have discordant results in RDT interpretation between laboratory personnel and automated analysis by the Deki Readers. The corresponding discordant results by year were 361 (0.8%) among 46,612 in 2014, 582(2.6%) among 22,401 in 2015 and 424(2.9%) among 14,282 uploaded images in 2016.
Table 1 summarizes the characteristics of discordant results. Maramba constituted 402(29.4%) discrepant results (the highest among all study sites) while the Rwamkoma had only 72(5.3%), the lowest among all sites. Participants aged 18-25years old constituted 972(71.1%) discrepant results; the highest of all age groups. In the first year (2014), Msange and Chita sites were not included in the study while Rwamkoma had missing data in 2015. The proportions of discrepant results among patients of different age groups, sex and those from the different study facilities were significantly different (p<0.001). A total of 699(51.1%) patients with discrepant results were eligible for follow-up.
Table 1. Baseline characteristics of study participants with discordant RDT results.
| Variables | 2014 (n = 361) |
2015 (n = 582) | 2016 (n = 424) |
Total (N = 1367) |
|---|---|---|---|---|
| n(%) | n(%) | n(%) | n(%) | |
| Sex* | ||||
| Male | 266(73.7) | 431(74.1) | 298(70.3) | 995(72.8) |
| Female | 95(26.3) | 151(25.90 | 126(29.7) | 372(27.2) |
| Patients' age groups(years)* | ||||
| <5 | 29(8.0) | 50(8.6) | 34(8.0) | 113(8.3) |
| 5–17 | 26(7.2) | 40(6.9) | 25(6.0) | 91(6.7) |
| 18–25 | 253(70.1) | 405(69.6) | 314(74.1) | 972(71.1) |
| >25+ | 53(14.7) | 87(14.9) | 51(12.0) | 191(14.0) |
| Health facilities* | ||||
| Bulombora | 104(28.8) | 17(2.9) | 9(1.1) | 130(9.5) |
| Chita | 0(0.0) | 80(13.7) | 64(15.1) | 144(10.5) |
| Maramba | 78(21.6) | 228(39.2) | 96(22.6) | 402(29.4) |
| Mgambo | 60(16.76) | 116(19.9) | 144(33.9) | 320(23.4) |
| Msange | 0(0.0) | 35(6.0) | 52(12.3) | 87(6.4) |
| Ruvu | 71(19.7) | 106(18.2) | 34(8.0) | 211(15.4) |
| Rwamkoma | 48(13.3) | 0(0.0) | 25(6.0) | 73(5.3) |
| Type of discordant results* | ||||
| False negative results | 245(67.9) | 346(59.5) | 231(54.5) | 822(60.1) |
| False positive results | 116(32.1) | 236(40.5) | 193(45.5) | 545(39.9) |
| Patients eligible for follow-up** | ||||
| Eligible | 200(55.4) | 282(48.4) | 217(51.2) | 699(51.1) |
| Not eligible | 161(44.6) | 300(51.6) | 207(48.8) | 668(48.9) |
* p≤0.001
** p≥0.001
Evaluation of discrepancies in interpretation of RDT results by laboratory personnel compared to automated analysis
Out of the 1,367 individuals with discordant RDTs results as assessed by comparing interpretation by laboratory personnel and automated analysis by Deki Readers, a significantly higher proportion (60.1%) had false negative compared to those with false positive results (39.9%) (p<0.001). A total of 741(54.2%) were due to personnel errors associated with an inability to discern a single test line displaying positive or negative results, 483(35.3%) were associated with inability to discern either of the two positive or negative lines and 143 (10.5%) were associated with inability to discern both of the two positive or negative lines.
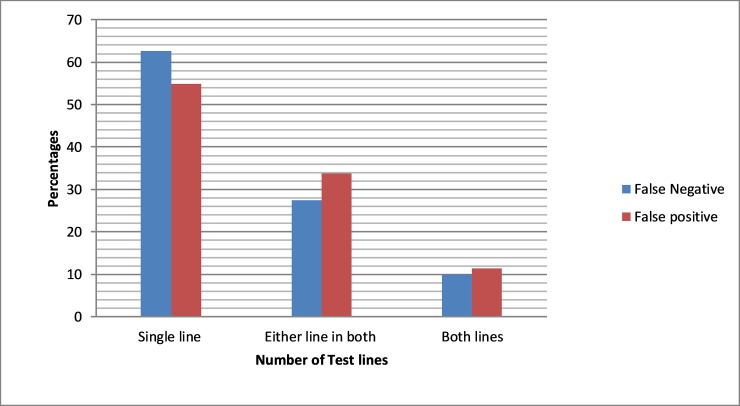
Of the false negative results, 515(62.7%) were due to personnel errors associated with inability to discern a single test line displaying positive results, 226(27.5%) were associated with in an inability to discern either of two positive lines and 81(9.9%) were associated with an inability to discern RDTs with two positive lines (Fig 3). Of the false positive results, 299(54.9%) tests were associated with personnel falsely reporting the presence of a single test line as positive, 184(27.5%) errors were associated with falsely reporting the presence of either line of the two test lines and 62(11.4%) errors were associated with falsely reporting both test lines as being positive (Fig 3). There was a significant difference (p<0.001) in making interpretation errors for a single RDT test line compared to errors associated with determining the validity of either line of an assumed double line and errors associated with cases where both test lines were implicated.
Fig 3. Characterization of interpretation errors of RDT by test line results.
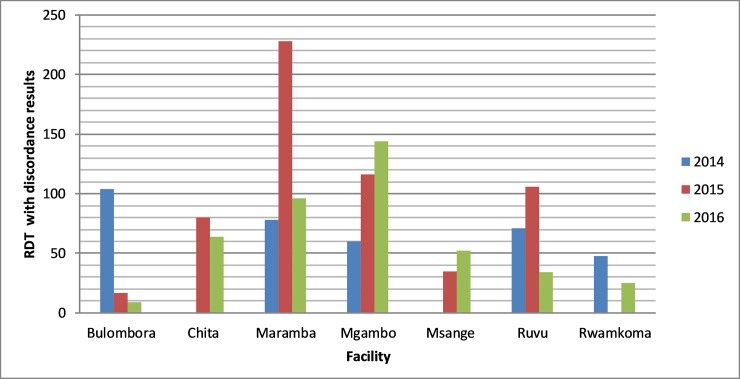
Despite remote monitoring of the sites, RDTs with discrepant results increased from 361 (26.4%) in 2014 to 582 (42.6%) in 2015 and decreased slightly to 424 (31.0%) in 2016. Generally, an increasing trend in making interpretation errors was observed in the three years period (Fig 4)
Fig 4. Number of RDT images with errors in interpretation reported by health facilities from 2014 to 2016.
Reported errors in preparation procedures of RDTs
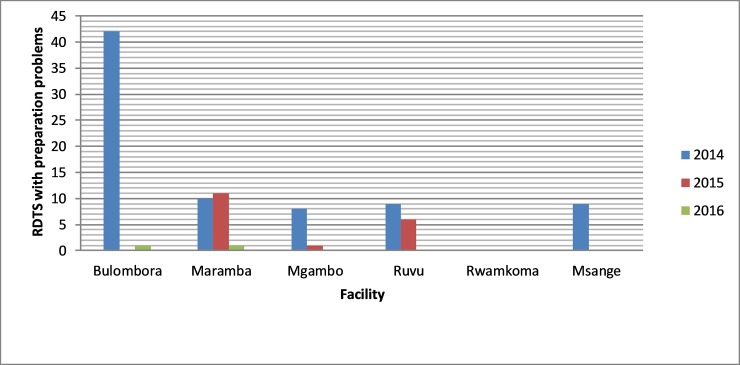
Of all the discordant results, 98(7.2%) involved review of RDT images which showed quality problems related to preparation procedures. Of these, 95(96.9%) errors were associated with errors caused by putting too much blood on the sample well or insufficient buffer in the respective wells while only 5(5.1%) were due to putting too little blood on the sample well or applying blood on walls of the wells. Out of 1367 RDT images with discordant results, 98(7.2%) had errors in preparation of which, 78(5.7%) were prepared in 2014, 18(1.3%) in 2015 and 2(0.1%) in 2016. Three out of seven study health facilities (Bulombora, Rwamkoma and Ruvu) contributed over 50% of all tests with processing errors.
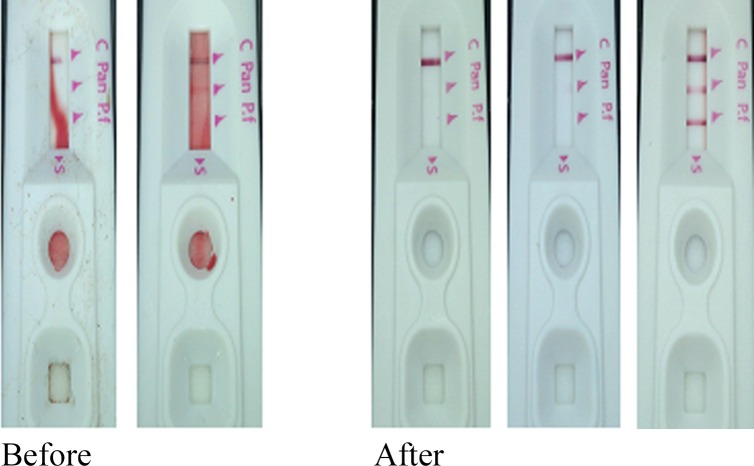
In the course of remote oversight, study monitors contacted laboratory personnel for corrective actions when mistakes were detected, leading to a significant decline in preparation errors (p < 0.001) from 5.7% in 2014 to 1.3% in 2015 and further to 0.1% in 2016. Except for Maramba where errors in preparation of RDTs were almost steady from 2014 to 2015, there was a noticeable decrease in errors for all study sites (Figs 5 and 6). After three years of remote monitoring with Fionet technology, errors associated with preparation of RDTs were reduced by 97%.
Fig 5. A sample set showing quality of RDTs prepared before and after remote monitoring.
Fig 6. Number of RDT images with preparation errors reported by health facilities from 2014 to 2016.
Reasons for making errors in interpretations of RDT results
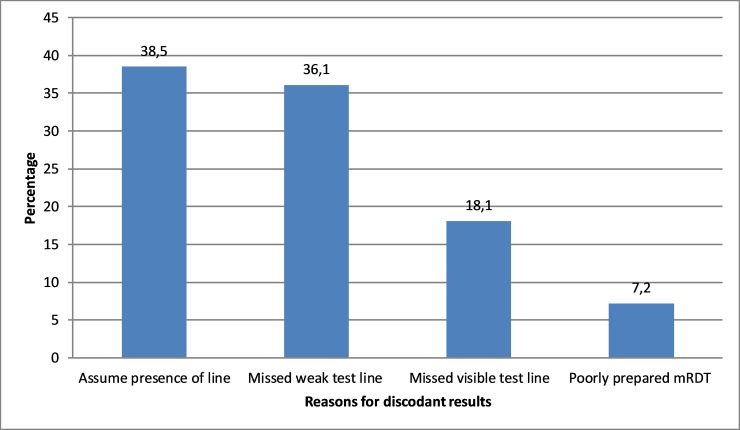
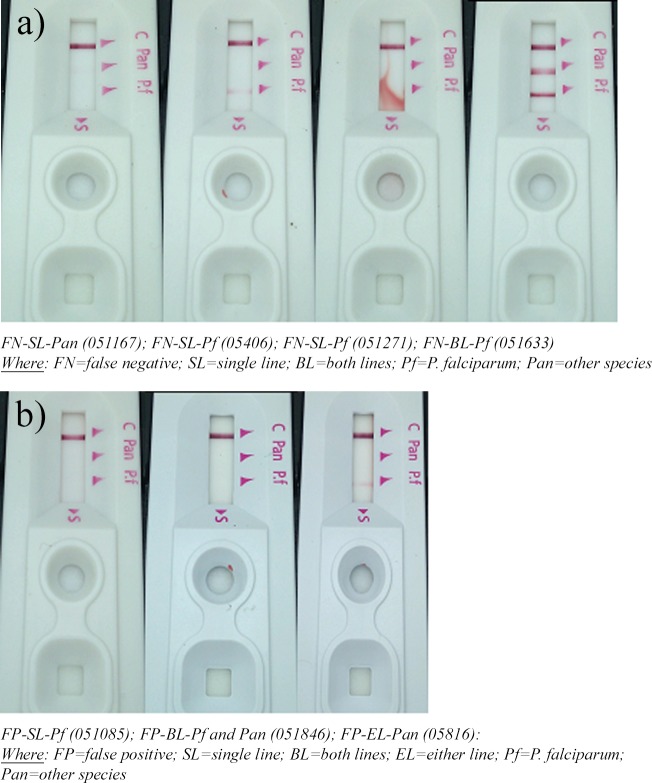
Errors in RDT interpretations were contributed mostly (>95%) by failure to adhere to testing procedures associated with RDT preparation and interpretation of RDT results by laboratory personnel. A total of 526 (38.5%) were due to errors by laboratory personnel who falsely observed positive test line on RDTs due to over interpretation when in fact these lines were not present while in 493 (36.1%) cases, a faint positive RDT test line(s) was missed by the end user. It was also observed that 248(18.1%) errors were due to laboratory personnel failing to observe and record strong positive test lines on RDTs, and 96 (7.2%) were associated with errors due to poorly processed RDT tests. Reasons for Laboratory personnel making errors in interpretation of RDT results are shown below in the bar chart (Fig 7); Examples of image of RDTs are also shown below as negative (Fig 8A) and positive (Fig 8B) falsely interpreted respectively.
Fig 7. Reasons for laboratory personnel making errors in interpretation of RDT.
Fig 8.
a) Examples of negative falsely interpreted test lines of RDTs at Maramba clinic in April, 2014. b) Examples of positive falsely interpreted test lines of RDTs at Maramba clinic in May, 2014.
Follow-up of patients who missed treatment on initial RDT false results
Out of 1,367 patients with discrepant test results, 699(51.1%) were eligible for follow-up to initiate malaria treatment because they were detected to be false negative RDT results after the initial tests. A total of 668(48.9%) patients were not eligible for follow-up because they had either false positive or false negative results (in one of the two lines but were reported as positive lines) and they were actually treated based on the initial RDT results. Among eligible patients for follow-up, 339(48.5%) were followed-up while 360(51.5%) were not followed-up because they were civilians coming from neighboring villages where follow-up was not logistically feasible. Of the patients who were followed-up, 291(85.8%) were treated with appropriate anti-malaria therapy while 48(14.2%) patients were not treated because of delays in communication with health workers at the clinic (Table 2). During follow-up, most of the patients were followed-up and treated on the same day the initial RDT results were reported (42.8%) or after one day (45.4%) (Table 2). There was no significant difference among health facilities and day of treatment after follow-up. However, the number of patients treated in 2015 were significantly higher (p< 0.001) compared to those treated in 2014 and 2016 (Table 2).
Table 2. Number of patients followed-up and the day of follow-up and treatment.
| Variable | Same day | 1day | 2 days | 3 days | > 3 days | Treated | Missed | Followed |
|---|---|---|---|---|---|---|---|---|
| # (%) | # (%) | # (%) | # (%) | # (%) | # (%) | # (%) | # | |
| H. facilities | ||||||||
| Rwamkoma | 13(68.4) | 5(26.3) | 1(5.3) | 0 (0.0) | 0 (0.0) | 19(95.0) | 1(0.5) | 20 |
| Bulombora | 17 (44.7) | 14 (36.8) | 4(10.5) | 1 (2.6) | 2 (5.3) | 38(84.4) | 7(15.6) | 45 |
| Maramba | 32 (40.0) | 41 (51.1) | 6 (7.5) | 1 (1.1) | 0 (0.0) | 80(86.0) | 13(14.0) | 93 |
| Mgambo | 25 (37.3) | 31 (46.3) | 5 (7.1) | 4 (7.5) | 2 (3.0) | 67(95.7) | 3(4.3) | 70 |
| Msange | 10(33.3) | 16 (53.3) | 4 (13.3) | 0 (0.0) | 0 (0.0) | 30(90.9) | 3(9.1) | 33 |
| Ruvu | 26(45.6) | 25(43.9) | 6(10.5) | 0 (0.0) | 0 (0.0) | 57(73.1) | 21(26.9) | 78 |
| All | 123 (42.3) | 132 (45.4) | 26(8.9) | 6 (2.1) | 2 (0.6) | 291(85.8) | 48(14.2) | 339 |
| Year of study | ||||||||
| 2014 | 55(55.6) | 24(24.2) | 14(14.1) | 2(2.0) | 4(4.0) | 99(82.5) | 21(17.5) | 120 |
| 2015 | 48(39.7) | 66(54.5) | 5(4.1) | 1(0.8) | 1(0.8) | 121(87.1) | 18(12.9) | 139 |
| 2016 | 20(28.2) | 40(56.3) | 8(11.3) | 3(4.2) | 0 (0.0) | 71(88.8) | 9(11.2) | 80 |
| All | 123 (42.3) | 130 (44.7) | 27(9.3) | 6 (2.1) | 2 (0.7) | 291(85.8) | 48(14.2) | 339 |
Discussion
External quality control (EQC) of malaria RDT is as important as internal quality control for increasing reliability in malaria diagnosis and management of febrile patients. However, at present there are no approved EQC methods for cross-checking of used RDTs by off-site personnel because there is no guarantee that the test lines will be visible after the manufacturers’ recommended reading time. Therefore, this study reports the finding on the potential use of Fionet technology for remote monitoring of RDT test quality issues at remote clinic sites, identifying reasons contributing to laboratory errors and taking corrective actions for improvement of diagnosis, and consequently improving the management of febrile patients.
Through remote monitoring of testing at the study sites, it was observed that human errors in preparation and interpretation of RDTs results significantly affected malaria diagnosis with RDTs and hence misguided treatment of patients. A discrepancy rate of approximately 2% was observed between the results interpreted by laboratory personnel and automated analysis by the Deki Reader. The interpretation error rate reported in this study is similar to that observed from community health workers in a previous study in Kenya [24]. Among the reported discordant test results, false negative results represented over 60% implying that malaria diagnosis and treatment would be compromised and the majority of the patients would miss anti-malarial treatment [34] due to errors in diagnosis by laboratory personnel. Consequently, these patients would be in danger of developing severe disease which can be potentially fatal. Common interpretation errors (>50%) occurred because laboratory personnel could not see the presence of a single positive test line on an RDT cassette. Unfortunately, both Pf and “Pan” single positive test lines were equally highly missed during diagnosis by 65.6% and 52.9%, respectively. This finding implies that there is a high probability for patient misdiagnosis in cases where positive results are inferred for a single test line coated with antibodies for either Pf or pan antigens. It is not clearly understood why there is a high chance of laboratory personnel failing to detect a single positive test line on an RDT compared to cases where both lines were not detected properly or in cases where either of the lines were misinterpreted where both positive lines should have been reported. Therefore, further investigation is recommended on the effect of two antigens on the density of test lines because in this study it was observed that the false negativity rate was due to laboratory personnel failing to see weak positive test line (36.1%) as also previously reported [23,35]. However, another possible explanation of missing weak test lines could be presumably due to poor lighting system in the laboratory room as also previously reported [36] and confirmed by the ease of seeing positive lines when reviewing RDT images in the web portal. Therefore, investigators introduced the use of an electric table lamp to increase lighting during preparation and interpretation of RDTs; unfortunately, the impact of this intervention could not be assessed because monitoring of the quality of RDTs was done remotely.
Paradoxically, many RDT images with visible/strong positive test lines were also erroneously reported negative due to poor concentration among laboratory personnel. It has been described previously by other authors that after a period of one year post training on RDT processing and interpretation, laboratory personnel still could not safely and accurately use RDTs for malaria diagnosis [37]. In our study, our opinion is that oversimplification of RDT evaluation by laboratory personnel could also have affected RDT result interpretation.
The principal reason for reporting an RDT test result false positive was assuming the presence of a test line. Interpretation errors were commonly (>50%) attributed to assuming the presence of a single positive test line on RDT cassette while in fact it was negative. It is not clear how laboratory personnel over diagnosed these results but in our view this could potentially be due to the need for laboratory personnel to satisfy clinicians who sometimes do not believe negative test results for patients presenting with an indistinguishable fever, as also previously discussed [38].
In this study nearly 7% of the interpretation errors were due to poor RDT preparation procedures. This was higher compared to the preparation errors of 3.5% that was reported in a study done in Kenya [24]. Over 95% of the RDT images that were poorly prepared had incomplete clearance of red blood in the RDT background which hindered the interpretation process, which is similar to recently reported results [39]. In this study, few preparation errors were investigated because other common errors such as the absence of a control line, irregular control line, failure to analyze the RDT within the allowed time, use of dirty and unsupported RDTs were controlled by the use of the automated DR system which rejected the test by guiding laboratory personnel to repeat the test. This resulted in minimized errors among RDT images that were uploaded in the system and reviewed by study monitors. The proportion of processing and interpretation errors observed in the present study are also in agreement with processing error rate of 7.61% (95% CI: 6.57%, 8.76%), an interpretation error rate of 4.0% obtained from meta-analysis of over 31,000 malaria RDTs using the same Fionet technology as previously reported[40]
A significant decrease of about 97% (p<0.001) in preparation errors among discordant results was attained after three years (from 5.7% in 2014 to 0.1% in 2016) as a result of remote testing oversight by study monitors using the Fionet technology. This demonstrates that remote monitoring contributed to the improvement in RDT preparation such that very few (0.1%) errors in RDT preparation were made by laboratory personnel from all seven health facilities in the third year following remote monitoring and implementation of corrective measures. Although the preparation problems decreased noticeably, remote oversight did not work well in improving the RDT interpretation errors as demonstrated by an increased error rate of 17% in interpretation in the same period. The possible reasons behind the failure to improve RDT interpretation could include frequent replacement of trained with untrained laboratory personnel in some health facilities. We have noted that RDT testing errors increased immediately after replacements took over which does suggest a link between not having proper formal training and failure to perform testing to standard which was also documented in other studies [41]. In health facilities where laboratory personnel were replaced, study monitors trained the new staff on-site during quarterly visits and this was associated with a decline in errors.
Remote monitoring at clinic also helped to achieve timely follow-up of patients who had false negative RDT results. A follow-up rate of 49% among 669 eligible patients demonstrates the potential of the Fionet technology to improve patient follow-up through remote oversight and improvement in diagnosis. The inability to follow-up with civilian patients who had false negative results was due to long distance from the clinic coupled with a lack of communication infrastructure to notify and locate patients in remote areas in the villages of residence.
Out of all patients who were followed-up, about 86% were treated with an appropriate antimalarial therapy. The majority (92%) of febrile patients were treated within three days from their first RDT test. This achievement demonstrates also the potential of the technology to improve management of febrile patients as a result of remote oversight of laboratory personnel testing. The number of follow-up patients treated in the second year (2015) was significantly higher (p<0.001) compared to those treated in the first (2014) and third (2016). Nevertheless, follow-up of patients after detecting diagnostic errors possibly contributed to reduction in development of severe malaria among patients who missed treatment due to poor initial reporting RDT results.
Conclusion
Fionet technology enabled remote monitoring and marked quality improvement of malaria RDT performed by laboratory personnel at 7 sites scattered across Tanzania, enhanced our ability to identify causes of RDT interpretation errors and facilitated use of effective corrective actions to improve RDT diagnosis and treatment of febrile patients in rural clinics.
The results from this study demonstrated the potential of Fionet or similar image based technology and supports its future use in external RDT quality control. It also shows potential use in remote monitoring of laboratory personnel performance preparing and interpreting RDT results while minimizing costs of conducting physical supervision to sites located in remote areas.
Supporting information
(DTA)
Acknowledgments
Authors are grateful to the leadership of participating institutions namely Tanzania Peoples Defense Forces (TPDF) in Tanzania, Walter Reed Army Institute of Research (WRAIR) in US, Fio Corporation in Canada, National institute for Medical Research (NIMR) in Tanzania, Commission for Science and Technology (COSTECH) in Tanzania, Henry Jackson Foundation Medical Research Institute (HJFMRI) in US and Kilimanjaro Christian Medical University College (KCMUCo) in Tanzania. Many thanks are extended to laboratory personnel, the user of Deki Readers and all study participants from seven health facilities. Finally, the authors acknowledge Ian Fine, Geeta Bhat, Nora Zwingerman and Santiago Ferro from Fio Corporation, Toronto, Canada for their technical support and review of the manuscript.
Data Availability
All relevant data are within the manuscript and its Supporting Information files.
Funding Statement
This study was supported through funding received from Walter Reed Army Institute of Research (WRAIR) for malaria surveillance and diagnostic quality improvement program in Tanzania. The material has been reviewed by the Walter Reed Army Institute of Research. There is no objection to its presentation and/or publication. The opinions or assertions contained herein are the private views of the authors, and are not to be construed as official, or as reflecting true views of the US Department of the Army or the Department of Defense. The investigators have adhered to the policies for protection of human subjects as prescribed in AR 70– 25. The corresponding Author [AK] who is a PhD student, received financial support from the government of Tanzania through Tanzania Commission for Science and Technology (COSTECH) and Fio Corporation for school fees and stipend at the college. One author [GA] was employed by a commercial company called FORGYN Health Systems Consultants LLc at the time of submission of this article. The company did not fund the project; it just provided support in the form.
References
- 1.World Health Organization. Guidelines for theTreatment of Malaria: Third Edition Guidel. Treat. Malar; 2015. [Google Scholar]
- 2.Sousa-Figueiredo JC, Gamboa D, Pedro JM, Fançony C, Langa AJ, Soares Magalhães RJ, et al. Epidemiology of Malaria, Schistosomiasis, Geohelminths, Anemia and Malnutrition in the Context of a Demographic Surveillance System in Northern Angola. Noor AM, editor. PLoS One [Internet]. 2012. [cited 2017 Apr 11];7:e33189 Available from: http://www.ncbi.nlm.nih.gov/pubmed/22493664 10.1371/journal.pone.0033189 [DOI] [PMC free article] [PubMed] [Google Scholar]
- 3.Kahama-Maro J, D’Acremont V, Mtasiwa D, Genton B, Lengeler C. Low quality of routine microscopy for malaria at different levels of the health system in Dar es Salaam. Malar J [Internet]. BioMed Central Ltd; 2011;10:332 Available from: http://www.pubmedcentral.nih.gov/articlerender.fcgi?artid=3217957&tool=pmcentrez&rendertype=abstract 10.1186/1475-2875-10-332 [DOI] [PMC free article] [PubMed] [Google Scholar]
- 4.Abba K, Deeks JJ, Olliaro P, Naing CM, Jackson SM, Takwoingi Y, et al. Rapid diagnostic tests for diagnosing uncomplicated P. falciparum malaria in endemic countries. Cochrane Database Syst Rev. 2011;CD008122 10.1002/14651858.CD008122.pub2 [DOI] [PMC free article] [PubMed] [Google Scholar]
- 5.World Health Organization. Universal access to malaria diagnostic testing: an Operational manual [Internet]. 2011. Available from: http://apps.who.int/iris/bitstream/10665/44657/1/9789241502092_eng.pdf
- 6.Fançony C, Sebastião Y V, Pires JE, Gamboa D, Nery S V. Performance of microscopy and RDTs in the context of a malaria prevalence survey in Angola: a comparison using PCR as the gold standard. Malar J [Internet]. 2013;12:284 Available from: http://www.pubmedcentral.nih.gov/articlerender.fcgi?artid=3751255&tool=pmcentrez&rendertype=abstract 10.1186/1475-2875-12-284 [DOI] [PMC free article] [PubMed] [Google Scholar]
- 7.Wongsrichanalai C, Barcus MJ, Muth S, Sutamihardja A, Wernsdorfer WH. A review of malaria diagnostic tools: Microscopy and rapid diagnostic test (RDT). Am J Trop Med Hyg. 2007;77:119–27. [PubMed] [Google Scholar]
- 8.Health(WHO) TQAP (QAP) and the W. How to use a Rapid Diagnostic Test(RDT): A guide for training at a village and clinic level. Bethesda, MD, and Geneva [Internet]. 2006. Available from: http://www.wpro.who.int/malaria/NR/rdonlyres/A5557149-BB4E-4A26-9CBA-996DA92FC8A4/0/RDTgeneric4bgeneric.pdf
- 9.Seidahmed1 OE, Mohamedein2 MN, Elsir3 A, Ali1 F, Ahmed4 EM. End-user errors in applying two malaria rapid diagnostic tests in a remote area of Sudan. [cited 2017 Apr 19]; Available from: http://khartoumspace.uofk.edu/bitstream/handle/123456789/20582/End-user errors in applying two malaria rapid diagnostic tests.pdf?sequence=1 [DOI] [PubMed]
- 10.Kozycki CT, Umulisa N, Rulisa S, Mwikarago EI, Musabyimana JP, Habimana JP, et al. False-negative malaria rapid diagnostic tests in Rwanda: impact of Plasmodium falciparum isolates lacking hrp2 and declining malaria transmission. Malar J [Internet]. BioMed Central; 2017;16:123 Available from: http://malariajournal.biomedcentral.com/articles/10.1186/s12936-017-1768-1 [DOI] [PMC free article] [PubMed] [Google Scholar]
- 11.Mohammed A, Ndaro A, Kalinga A, Manjurano A, Mosha JF, Mosha DF, et al. Trends in chloroquine resistance marker, Pfcrt-K76T mutation ten years after chloroquine withdrawal in Tanzania. Malar J [Internet]. Malaria Journal; 2013;12:415 Available from: http://malariajournal.biomedcentral.com/articles/10.1186/1475-2875-12-415 [DOI] [PMC free article] [PubMed] [Google Scholar]
- 12.Maltha J, Guiraud I, Lompo P, Kaboré B, Gillet P, Van Geet C, et al. Accuracy of PfHRP2 versus Pf-pLDH antigen detection by malaria rapid diagnostic tests in hospitalized children in a seasonal hyperendemic malaria transmission area in Burkina Faso. Malar J [Internet]. 2014;13:20 Available from: http://www.malariajournal.com/content/13/1/20 [DOI] [PMC free article] [PubMed] [Google Scholar]
- 13.World Health Organization. Parasitological confi rmation of malaria diagnosis: Report of WHO Technical consultation; 6–8, October, 2009 [Internet]. 2009. Available from: http://apps.who.int/iris/bitstream/10665/44323/1/9789241599412_eng.pdf
- 14.Aidoo M, Patel JC, Barnwell JW. Dried Plasmodium falciparum-infected samples as positive controls for malaria rapid diagnostic tests. Malar J [Internet]. BioMed Central; 2012. [cited 2017 Apr 18];11:239 Available from: http://www.ncbi.nlm.nih.gov/pubmed/22823999 10.1186/1475-2875-11-239 [DOI] [PMC free article] [PubMed] [Google Scholar]
- 15.Masanja IM, McMorrow ML, Maganga MB, Sumari D, Udhayakumar V, McElroy PD, et al. Quality assurance of malaria rapid diagnostic tests used for routine patient care in rural Tanzania: microscopy versus real-time polymerase chain reaction. Malar J. 2015;14. [DOI] [PMC free article] [PubMed] [Google Scholar]
- 16.FIND. Positive control wells for quality assurance of malaria RDTs at point of care. The foundation for Innovative New Diagnotics(FIND); Campus Biotech Chemin des Mines 9–1202 Geneva—Switzerland; 2014.
- 17.World Health Organization. Laboratory Quality Management System Handbook. ISBN 978 92 4 154827 4; WHO Press, 20 Avenue Appia, 1211 Geneva 27, Switzerland. Handbook. 2011;1.
- 18.McMorrow ML, Masanja MI, Abdulla SMK, Kahigwa E, Kachur SP. Challenges in routine implementation and quality control of rapid diagnostic tests for malaria—Rufiji District, Tanzania. Am J Trop Med {&} Hyg. 2008;79:385–90. [PMC free article] [PubMed] [Google Scholar]
- 19.Bell D, Bwanika JB, Cunningham J, Gatton M, González IJ, Hopkins H, et al. Prototype Positive Control Wells for Malaria Rapid Diagnostic Tests: Prospective Evaluation of Implementation Among Health Workers in Lao People’s Democratic Republic and Uganda. Am J Trop Med Hyg [Internet]. 2017;96:319–29. Available from: http://www.ajtmh.org/lookup/doi/10.4269/ajtmh.16-0498 [DOI] [PMC free article] [PubMed] [Google Scholar]
- 20.FIND. Positive Control Wells for malaris rapid diagnostic tests:Pilot introduction in Kenya and Tanzania. 2016.
- 21.Tamiru A, Boulanger L, Chang MA, Malone JL, Aidoo M. Field assessment of dried Plasmodium falciparum samples for malaria rapid diagnostic test quality control and proficiency testing in Ethiopia. Malar J. 2015;14:1–8. 10.1186/1475-2875-14-1 [DOI] [PMC free article] [PubMed] [Google Scholar]
- 22.Mukadi P, Gillet P, Lukuka A, Mbatshi J, Otshudiema J, Muyembe J-J, et al. External quality assessment of reading and interpretation of malaria rapid diagnostic tests among 1849 end-users in the Democratic Republic of the Congo through Short Message Service (SMS). PLoS One [Internet]. Public Library of Science; 2013. [cited 2017 Apr 18];8:e71442 Available from: http://www.ncbi.nlm.nih.gov/pubmed/23967211 10.1371/journal.pone.0071442 [DOI] [PMC free article] [PubMed] [Google Scholar]
- 23.Mukadi P, Gillet P, Barbé B, Luamba J, Lukuka A, Likwela J, et al. SMS photograph-based external quality assessment of reading and interpretation of malaria rapid diagnostic tests in the Democratic Republic of the Congo. Malar J. 2015;14. [DOI] [PMC free article] [PubMed] [Google Scholar]
- 24.Laktabai J, Platt A, Menya D, Turner EL, Aswa D, Kinoti S, et al. A mobile health technology platform for quality assurance and quality improvement of malaria diagnosis by community health workers. PLoS One [Internet]. 2018;13:1–14. Available from: 10.1371/journal.pone.0191968 [DOI] [PMC free article] [PubMed] [Google Scholar]
- 25.Adah P, Maduka O, Obasi O, Doherty O, Oguntoye S, Seadon K, et al. The role of the Deki ReaderTM in malaria diagnosis, treatment and reporting: findings from an Africare pilot project in Nigeria. Malar J [Internet]. BioMed Central; 2018;17:221 Available from: https://malariajournal.biomedcentral.com/articles/10.1186/s12936-018-2356-8 [DOI] [PMC free article] [PubMed] [Google Scholar]
- 26.Shekalaghe S, Cancino M, Mavere C, Juma O, Mohammed A, Abdulla S, et al. Clinical performance of an automated reader in interpreting malaria rapid diagnostic tests in Tanzania. Malar J [Internet]. 2013;12:141 Available from: http://www.ncbi.nlm.nih.gov/pubmed/23617722%5Cnhttp://www.biomedcentral.com/content/pdf/1475-2875-12-141.pdf 10.1186/1475-2875-12-141 [DOI] [PMC free article] [PubMed] [Google Scholar]
- 27.Herrera S, Vallejo AF, Quintero JP, Arévalo-Herrera M, Cancino M, Ferro S. Field evaluation of an automated RDT reader and data management device for Plasmodium falciparum/Plasmodium vivax malaria in endemic areas of Colombia. Malar J. 2014;13. [DOI] [PMC free article] [PubMed] [Google Scholar]
- 28.Oyet C, Roh ME, Kiwanuka GN, Orikiriza P, Wade M, Parikh S, et al. Evaluation of the Deki ReaderTM, an automated RDT reader and data management device, in a household survey setting in low malaria endemic southwestern Uganda. Malar J. BioMed Central; 2017;16:4–9. 10.1186/s12936-016-1652-4 [DOI] [PMC free article] [PubMed] [Google Scholar]
- 29.Kalinga AK, Mwanziva C, Chiduo S, Mswanya C, Ishengoma DI, Francis F, et al. Comparison of visual and automated Deki Reader interpretation of malaria rapid diagnostic tests in rural Tanzanian military health facilities. Malar J. 2018;17. [DOI] [PMC free article] [PubMed] [Google Scholar]
- 30.(NBS), National Bureau of Statistics D es S. Tanzania Malaria Indicator Survey (TMIS): Key Indicators 2017. 2017. [Google Scholar]
- 31.Tanzania Commission for AIDS (ZAC), Zanzibar AIDS Commission (NBS), National Bureau of Statistics (OCGS) O of the CGSII. Tanzania- 2011–12 HIV/AIDS and Malaria Indicator Survey 2011–12: Key Findings. 2013.
- 32.Ministry of Health, Community Development, Gender E and C (MoHCDGEC) [Tanzania, Mainland], Ministry of Health (MoH) [Zanzibar], National Bureau of Statistics (NBS) O of the C, Government Statistician (OCGS) and I. Tanzania demographic Health survey and malaria indicator survey(TDHS-MIS); 2015–2016. 2016.
- 33.Team QD. QGIS Geographic Information System. Version 3.2 (Bonn). Open Source Geospatial Foundation Project; http://qgis.osgeo.org [Internet]. http://qgis.osgeo.org. 2018. Available from: https://www.qgis.org/de/ [Google Scholar]
- 34.Berhane A, Russom M, Bahta I, Hagos F, Ghirmai M, Uqubay S. Rapid diagnostic tests failing to detect Plasmodium falciparum infections in Eritrea: an investigation of reported false negative RDT results. Malar J. 2017;16. [DOI] [PMC free article] [PubMed] [Google Scholar]
- 35.Mukanga D, Babirye R, Peterson S, Pariyo GW, Ojiambo G, Tibenderana JK, et al. Can lay community health workers be trained to use diagnostics to distinguish and treat malaria and pneumonia in children? Lessons from rural Uganda. Trop Med Int Heal. 2011;16:1234–42. [DOI] [PubMed] [Google Scholar]
- 36.Murray CK, Gasser RA, Magill AJ, Miller RS. Update on rapid diagnostic testing for malaria. Clin Microbiol Rev. 2008;21:97–110. 10.1128/CMR.00035-07 [DOI] [PMC free article] [PubMed] [Google Scholar]
- 37.Counihan H, Harvey SA, Sekeseke-Chinyama M, Hamainza B, Banda R, Malambo T, et al. Community health workers use malaria rapid diagnostic tests (RDTs) safely and accurately: Results of a longitudinal study in Zambia. Am J Trop Med Hyg. 2012;87:57–63. 10.4269/ajtmh.2012.11-0800 [DOI] [PMC free article] [PubMed] [Google Scholar]
- 38.Ochodo E, Garner P, Sinclair D. Achieving universal testing for malaria. BMJ [Internet]. 2016;352:1–6. Available from: http://dx.doi.org/doi:10.1136/bmj.i107 [DOI] [PMC free article] [PubMed] [Google Scholar]
- 39.WHO/FIND/CDC. Malaria Rapid Diagnostic Test Performance- Results of WHO product testing of malaria RDTs: Round 7(2015–2016). 2016.
- 40.Zwingerman Nora, macela Cacino, Ferro Santiago. In Field Assessment of Malaria Rapid Diagnostic Test Performance by Community Healthcare Workers. ASTMH; Abstr # 1799; Philadelphia. 2015;2015.
- 41.Boyce MR, Menya D, Turner EL, Laktabai J, Prudhomme-O’Meara W. Evaluation of malaria rapid diagnostic test (RDT) use by community health workers: A longitudinal study in western Kenya. Malar J [Internet]. BioMed Central; 2018;17:1–11. Available from: 10.1186/s12936-018-2358-6 [DOI] [PMC free article] [PubMed] [Google Scholar]
Associated Data
This section collects any data citations, data availability statements, or supplementary materials included in this article.
Supplementary Materials
(DTA)
Data Availability Statement
All relevant data are within the manuscript and its Supporting Information files.


