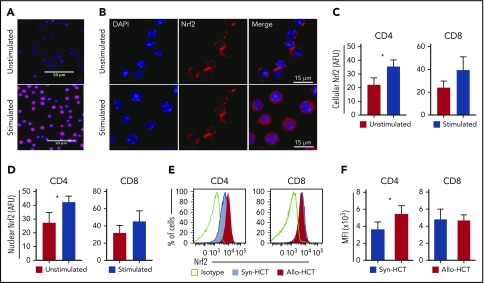
Figure 1.
T cell-activation promotes Nrf2 nuclear translocation and protein expression. (A-D) Magnetically sorted WT B6 CD4 or CD8 T cells were stimulated with anti-CD3 and anti-CD28 for 24 hours for immunofluorescence analysis (n = 3 independent experiments). (A-B) Representative immunofluorescence images showing Nrf2 immunostaining (red) and DAPI (blue). Mean total cellular (C) and nuclear (D) fluorescent intensity of Nrf2 immunostaining. More than 600 cells were analyzed for each condition. (E-F) WT B6 TCD BM and T cells were transplanted into lethally irradiated B6 (Syn-HCT) or BALB/c (Allo-HCT) recipients. Representative flow cytometric analysis (E) and mean fluorescence intensity (MFI) (F) of the intracellular levels of Nrf2 within donor T cells were performed using recipient spleens on day 14 after HCT. Data represent the mean + standard deviation from 1 of 2 independent experiments (n = 5-7 mice per group). *P < .05. AFU, arbitrary fluorescent unit.

