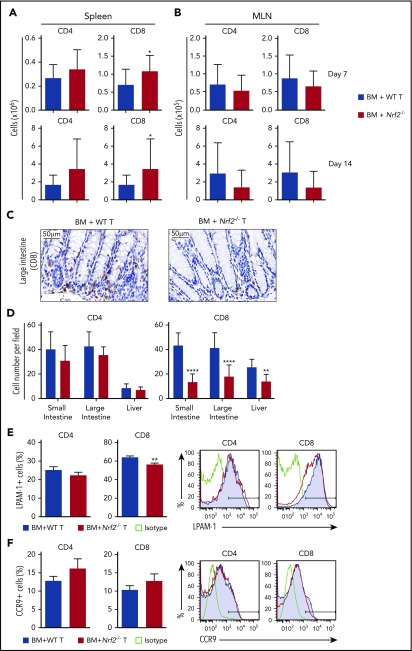
Figure 5.
Nrf2−/−donor T cells display decreased intestinal infiltration and LPAM-1 expression. (A-B) Lethally irradiated BALB/c recipients were transplanted with WT B6 TCD BM and 0.5 × 10⁶ B6 WT or Nrf2−/− T cells. Recipient organs were analyzed on days 7 and 14 after HCT. Spleens (n = 15 per group, 3 independent experiments) (A) and MLNs (n = 24 or 25 per group, 5 independent experiments) (B) were analyzed for donor CD4+ and CD8+ T cells using flow cytometry. (C-D) Lethally irradiated BALB/c recipients were transplanted with WT B6 TCD BM and 0.5 × 10⁶ B6 WT or Nrf2−/− T cells. Representative immunohistochemistry images (showing CD8+ cells) (C) and quantification of T cells in recipient liver, small and large intestines (D) on day 14 after HCT (n = 16 per group, 2 independent experiments). Splenocytes were analyzed for the percentage of LPAM-1 (E) and CCR9 (F) expression in donor T cells (n = 20 per group, 4 independent experiments). Data represent the mean + standard deviation combined from independent experiments. *P < .05, **P < .01, ****P < .0001.

