

Abstract
Aims: There is limited knowledge about the association of lipoprotein particles and markers of coronary atherosclerosis such as coronary artery calcification (CAC) in relatively young high-risk persons. This study examines the association of lipoprotein subfractions and CAC in high cardiometabolic risk individuals.
Methods: The study presents analysis from baseline data of a randomized trial targeted at high-risk workers. Employees of Baptist Health South Florida with metabolic syndrome or diabetes were recruited. At baseline, all 182 participants had lipoprotein subfraction analysis using the ion mobility technique and participants above 35 years (N = 170) had CAC test done. Principal components (PC) were computed for the combination of lipoprotein subclasses. Multiple bootstrapped regression analyses (BSA) were conducted to assess the relationship between lipoprotein subfractions and CAC.
Results: The study population (N = 170) was largely female (84%) with a mean age of 58 years. Three PCs accounted for 88% variation in the sample. PC2, with main contributions from VLDL particles in the positive direction and large LDL particles in the negative direction was associated with a 22% increase in CAC odds (P value < 0.05 in 100% of BSA). PC3, with main contributions from HDL lipoprotein particles in the positive direction and small/medium LDL and large IDL particles in the negative direction, was associated with a 9% reduction in CAC odds (P < 0.05 in 88% of BSA). PC1, which had approximately even contributions from HDL, LDL, IDL and VLDL lipoprotein subfractions in the positive direction, was not associated with CAC.
Conclusion: In a relatively young but high-risk population, a lipoprotein profile predominated by triglyceriderich lipoproteins was associated with increased risk of CAC, while one predominated by HDL lipoproteins offered modest protection. Lipoprotein sub-fraction analysis may help to further discriminate patients who require more intensive cardiovascular work-up and treatment.
Keywords: Lipoprotein Subfractions, Ion-Mobility, Coronary Atherosclerosis, Principal Component Analysis, CVD risk stratification
Introduction
Coronary artery disease remains a major cause of cardiovascular disease (CVD) morbidity and mortality. Due to the significant clinical, public health and economic burden of coronary disease, atherosclerotic CVD risk assessment is often conducted in asymptomatic adults visiting their primary care providers in order to direct preventive care. Plasma low density lipoprotein cholesterol (LDL-C), high density lipoprotein cholesterol (HDL-C) and triglycerides are traditionally used to assess dyslipidemic burden and guide CVD risk assessment and management. However, the use of traditional lipids in CVD risk assessment is flawed by its inability to identify young persons and women with high atherosclerotic burden and thus missing early treatment opportunities in these individuals1).
Non-invasive measures of coronary atherosclerosis such as coronary artery calcification (CAC) have prognostic significance, are useful in cardiovascular disease risk stratification and are included in the guidelines for CVD risk assessment among persons with intermediate global risk scores2). Coronary atherosclerotic burden as measured by CAC correlates well with CVD risk. In particular, persons with CAC scores (Agatston Units) of zero have been shown to have very low mortality risk3, 4).
Several lipoprotein subfractions have been demonstrated to be associated with atherosclerotic CVD events including mortality. However, the role of lipoprotein subfractions in CVD risk assessment is still not clearly defined particularly among relatively young (less than 60 years) high cardiometabolic risk individuals. Several studies have described a lipoprotein profile that is thought to account for the most atherosclerotic CVD risk5). Although this atherogenic lipoprotein profile has been demonstrated to be associated with CVD events, the relationship between lipoprotein subclasses and noninvasive measures of coronary artery atherosclerosis such as coronary artery calcium has only been examined by a handful of studies. In most of these studies, even though the relationship of individual lipoprotein subfractions are examined, their significant inter-correlation is often not accounted for and the combinations identifying atherosclerosis risk is rarely examined.
In this study, we assessed the relationship between individual lipoprotein subfractions, as measured by ion mobility analysis, and coronary artery calcification in a relatively young employee population with high cardiometabolic risk. First, we examined the association of individual lipoprotein subfractions with the presence of CAC. Next, we explored combinations of lipoproteins, as identified in a principal component analysis, and their associations with CAC.
Methods
The Baptist Employee Healthy Heart Study is a randomized trial comparing two internet based lifestyle interventions for weight reduction and promotion of cardiometabolic health. Participants were drawn from the employee population of Baptist Health South Florida (BHSF), a large not-for-profit health care organization in Miami, Florida. All study participants provided written informed consent. The study was approved by the BHSF institutional review board (IRB) (IRB 13-028). This cross-sectional study presents findings based on data collected at baseline.
Study Population
To be included in the study, participants had to be current BHSF employees with high cardiometabolic risk as defined as having metabolic syndrome or type II diabetes mellitus. As per the National Cholesterol Education Program (NCEP) guidelines, metabolic syndrome was defined as the presence of 3 or more of the following: waist circumference > 40 inches in men and > 35 inches in women; fasting triglyceride level ≥ 150 mg/dl or on treatment, HDL-C < 40 mg/dl in men or < 50 mg/dl in women or on treatment, systolic blood pressure > 130 mmHg or diastolic blood pressure > 85 mmHg or on treatment for hypertension and fasting blood glucose ≥ 100 mg/dl or on antidiabetic medication6).
We excluded persons who had a previous diagnosis of CVD or a history of a CVD event such as angina, myocardial infarction, prior coronary revascularization or stroke. We also excluded persons with heart failure, heart block, valvular disease, atrial fibrillation, and chronic obstructive pulmonary disease (COPD). Women of child-bearing potential who were pregnant or seeking to become pregnant were also excluded, as were women with a history of bilateral mastectomy. Subjects receiving active treatment for cancer or those who had undergone a computerized tomography scan of the chest within the last 1 year were also excluded.
Study Measurements
At baseline, all participants completed questionnaires on demographic and socioeconomic characteristics and lifestyle behaviors. The demographic information collected included age, sex, ethnicity, family income, level of education and family size. Dietary pattern was assessed using a modified version of a validated Mediterranean Diet questionnaire7). Physical activity was assessed using the Global Physical Activity Questionnaire8). Participants also responded to questions on their past medical, social and family history.
All participants had their weights measured on a calibrated weight scale, without shoes and with empty pockets. Height was measured with a standardized scale (Seca 213 Portable Stadiometer, Seca GmbH & Co. KG, Hamburg, Germany) also without shoes. Participant abdominal circumference was measured using a gulick measuring tape and according to the National Institutes of Health (NIH) protocol. The gulick tape was placed at a horizontal plane around the abdomen at the level of the iliac crest with tension applied and the measurement was taken at the end of expiration. Blood pressure was measured in a seating position 5 minutes after rest following the guidelines of the American Heart Association9).
Blood draw for laboratory samples for the lipoprotein analysis were conducted after an 8 hour fast. At the study site, a total of about 28 mls of blood were drawn in 5 tubes (2.7 mls in citrate plasma tube, 17 mls in 2 serum separator tubes and 8 mls in 2 ethylenediaminetetraacetate tubes). Samples for lipoprotein subfraction analysis were centrifuged at room temperature (15–25°C) for 15 minutes at 3,000 rpm and aliquots of 1.5 mls of serum were placed in standard transfer tubes. Aliquots were stored at −60°C to −90°C and shipped monthly to an American College of Pathology-certified laboratory (Quest Diagnostics Nichols Institute, San Juan Capistrano, CA) on dry ice. Lipoprotein subfraction analysis was conducted using the gas-phase differential electrical mobility (ion mobility) analysis which directly quantifies the full spectrum of lipoprotein particles. The ion mobility technique is described elsewhere10). This method has been validated and used in several large scale cohort studies11, 12). The total cholesterol, HDL-C and triglycerides were measured by spectrophotometry, while the LDL-C was calculated using the Friedewald formula13) unless triglyceride levels were greater than 400 mg/dl.
Participants who were above the age of 35 years also had CT scan for coronary artery calcium quantification. Coronary arteries were scanned by non-contrast multi-detector row CT (acquisition time: 100 ms, 3 mm slice thickness) during the end-diastole. CAC score was determined by the Agatston method14).
Statistical Analysis
Nonparametric Spearman rank correlation coefficients were quantified for combinations of lipoproteins and lipids (HDL-C, LDL-C and triglycerides). A principal component analysis was conducted for lipoprotein subfractions with and without the lipids for 170 individuals who had complete data on both lipoproteins and CAC. Principal component analysis is a statistical procedure that transforms possibly correlated variables such as lipoprotein subfractions into linear uncorrelated variables. This analyses effectively reduces the dimensions of the data while preserving most of the information within the data. Principal component analysis is a statistical procedure that transforms possibly correlated variables such as lipoprotein subfractions into linear uncorrelated variables. This analyses effectively reduces the dimensions of the data while preserving most of the information within the data. Principal component analysis generates eigenvectors (often called principal component vectors) and their corresponding eigenvalues (a measure of variance) that are ranked in descending order of the amount of data variation explained. From the principal component vectors the coefficients of the linear transformation (loading values) for each individual within a principal component was computed. Principal component scores for each individual were then calculated as the summation of the product of the coefficients and the particle concentration minus the lipid/lipoprotein subfraction mean for each lipid or subfraction15). Supplementary Figs. 1–3 shows the scree and variance plots, loading plots and the score plots. The scree plot is a graph of the eigenvalues for each principal component while the variance plot is a graph of the variance explained by each principal component. The loading plots show the contribution of each lipid /lipoprotein subfractions to the principal components while the score plot shows the contribution of each observation, represented by a score, to each principal component.
Supplementary Fig. 1.

Scree and Variance Plots of Principal Components
Supplementary Fig. 3.

Score plots for PC 1, PC 2 and PC 3
We then bootstrapped our sample size of 170 to 5000 with replacement. Using an adjusted multivariate logistic regression analysis, the three principal components that accounted for the most variance were then assessed for their relationship with CAC presence (CAC > 0). Similarly, the relationship of HDL-C, LDL-C, triglycerides and each lipoprotein subfraction was examined also adjusting for earlier outlined covariates. The regression analysis of bootstrapping samples was repeated 1000 times. The mean odds ratio (OR) and the mean 95% confidence interval (CI), as well as the frequency of a p value < 0.05 are reported. Covariates included in the regression analysis were age, sex, BMI, hypertension, diabetes, diet-score, cigarette smoking, non-HDL-C, physical activity. A statistical significance level of alpha = 0.05 was chosen. Bootstrapping is a statistical method in which the data is resampled with replacement repeatedly generating multiple bootstrap samples (in this case 5000)16, 17). Considering that the study sample size is small, a bootstrapped analysis is a reliable way to increase power16). Our method of conducting repeated regression analysis on bootstrapped samples allows for more accurate estimates of statistical significance and has been used in previous studies18). This method also provides for precise confidence intervals16).
All statistical analyses were conducted in STATA version 12 (StataCorp LP, College Station, TX)19) and SAS version 9.4 (SAS Institute, Cary, NC)20).
Results
A total of 182 participants were recruited at baseline and participated in this study. Of these, 12 participants, who were 35 years or younger and did not have a CAC scan done, were excluded. The study population consisted of 170 participants with a mean age of 58 years, mostly female (84%) and with a high frequency of hypertension (85%). Participants with CAC > 0 were older and had a higher frequency of males and cigarette smokers. Diabetes was also more common among persons with CAC > 0. More details about population characteristics can be found in Table 1 and in Supplementary Table 1. Description on the distribution of the lipid and lipoprotein particles are shown in the box plots in Supplementary Fig. 4.
Table 1. Demographic and clinical variables categorized by absence or presence of CAC.
| CAC (Agatston score) | Total | CAC = 0 (N = 88) | CAC > 0 (N = 82) | P value |
|---|---|---|---|---|
| [Median, IQR] | (N = 170) | [0, 0–0] | [55, 9–164] | |
| Mean age (years) | 52 (10) | 49 (10) | 55 (8) | < 0.001 |
| % Female | 74 | 82 | 66 | 0.018 |
| Race | ||||
| % Non-Hispanic White | 32.1 | 28.1 | 35.4 | 0.325 |
| % Hispanic (any color) | 46.3 | 47.2 | 48.1 | |
| % Black | 15.4 | 19.1 | 10.1 | |
| % Others | 6.2 | 5.6 | 6.3 | |
| %HTN | 84.7 | 81.8 | 87.8 | 0.279 |
| %DM | 30.6 | 22.7 | 39.0 | 0.021 |
| %smoke | 32.9 | 19.3 | 47.6 | < 0.001 |
| Mean (SD) BMI (kg/m2) | 34.4 (6.2) | 34.2 (5.4) | 34.5 (6.9) | 0.748 |
| Median (IQR) Mets min/wk | 640 (0–2280) | 600 (0–1800) | 730 (240–3200) | 0.389 |
| Median (IQR) diet score | 6 (4–8) | 6 (4–8) | 6 (5–8) | 0.9098 |
CAC Coronary Artery Calcium; SD Standard Deviation; IQR Interquartile Range
Supplementary Table 1. Demographic data across three CAC groups.
| Variable | CAC = 0 | CAC 1–99 | CAC 100+ | P trend |
|---|---|---|---|---|
| (N = 88) | (N = 50) | (N = 32) | ||
| Mean age (SD, years) | 49 (10) | 53 (9) | 58 (7) | < 0.001 |
| % Female | 82 | 64 | 69 | 0.067 |
| Race | ||||
| % Non-Hispanic White | 28.9 | 34.0 | 37.5 | 0.734 |
| % Hispanic (any color) | 44.6 | 48.9 | 46.9 | |
| % Black | 20.5 | 10.6 | 9.4 | |
| % Others | 5.6 | 8.2 | 6.3 | |
| %HTN | 81.8 | 84.0 | 93.9 | 0.272 |
| %DM | 22.7 | 36.0 | 43.8 | 0.053 |
| %Smoke | 6.8 | 19.0 | 50.0 | 0.826 |
| Mean (SD) BMI (kg/m2) | 34.2 (5.4) | 34.8 (7.1) | 34.2 (6.6) | 0.921 |
| Median (IQR) Mets min/wk | 600 (0–1800) | 840 (240–3840) | 610 (120–1740) | 0.686 |
| Median (IQR) diet score | 6 (4–7) | 7 (4–8) | 5 (5–8) | 0.774 |
Supplementary Fig. 4.
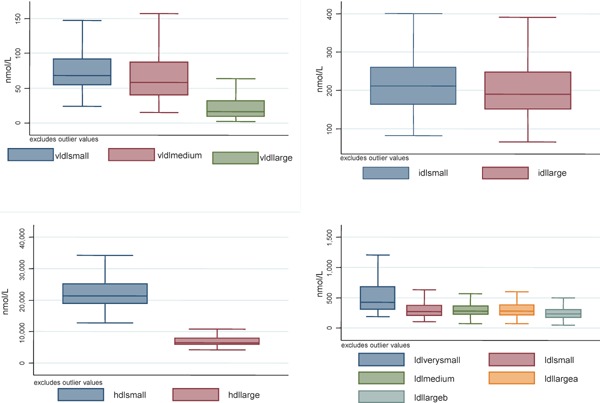
Box plots of lipoprotein subclasses
Table 2 shows the non-parametric spearman correlation coefficients (ρ) comparing lipids and lipoprotein subfractions to each other. The strongest correlations with triglycerides were the VLDL particles (ρ = 0.52, 0.84, 0.83 for the small, medium and large respectively). The very small and small LDL lipoproteins were also strongly correlated with triglycerides (ρ = 0.47, 0.44). Notably, the large LDL particles (subfractions a and b respectively) were inversely correlated with triglycerides (ρ = −0.38, −0.30) but were strongly correlated with HDL-C (ρ = 0.48, 0.36), and with both the small HDL (ρ = 0.53, 0.54) and large HDL (ρ = 0.32, 0.44) lipoprotein particles. The strongest correlations of the HDL-C were with the HDL-L (ρ = 0.52), both subfractions of LDL large (0.48, 0.36 for a and b respectively) and IDL-S (ρ = 0.47). In non-parametric correlation analysis (spearman's), triglycerides were weakly positively correlated with CAC, while HDL lipoprotein subfractions and the large LDL lipoprotein subfractions were negatively correlated with CAC, albeit weakly (Supplementary Table 2)
Table 2. Spearman correlation coefficients (ρ) for lipid and lipoprotein measures.
| HDL-C | LDL-C | Trig | HDL-S | HDL-L | LDL-VS | LDL-S | LDL-M | LDL-La | LDL-Lb | IDL-S | IDL-L | VLDL-S | VLDL-M | VLDL-L | |
|---|---|---|---|---|---|---|---|---|---|---|---|---|---|---|---|
| HDL-C | 1.0 | 0.18a | −0.29c | 0.30d | 0.52d | −0.24a | −0.20a | 0.10 | 0.48d | 0.36d | 0.47d | 0.07 | −0.02 | −0.29c | −0.30c |
| LDL-C | 1.0 | 0.05 | 0.25b | 0.16a | 0.19a | 0.38d | 0.60d | 0.54d | 0.56d | 0.61d | 0.62d | 0.55d | 0.22b | 0.09 | |
| Trig | 1.0 | 0.08 | −0.01 | 0.47d | 0.44d | −0.02 | −0.38d | −0.30c | −0.13 | 0.34d | 0.52d | 0.84d | 0.83d | ||
| HDL-S | 1.0 | 0.75d | 0.52d | 0.48d | 0.57d | 0.53d | 0.54d | 0.64d | 0.61d | 0.53d | 0.38c | 0.08 | |||
| HDL-L | 1.0 | 0.29c | 0.18a | 0.64d | 0.32d | 0.44d | 0.62d | 0.44d | 0.39d | 0.22 | 0.12 | ||||
| LDL-VS | 1.0 | 0.79d | 0.62d | −0.05 | 0.00 | 0.16a | 0.50d | 0.50d | 0.57d | 0.42d | |||||
| LDL-S | 1.0 | 0.69d | 0.07 | 0.23d | 0.29c | 0.62d | 0.55d | 0.53d | 0.37d | ||||||
| LDL-M | 1.0 | 0.67d | 0.82d | 0.64d | 0.60d | 0.44d | 0.23d | 0.08 | |||||||
| LDL-La | 1.0 | 0.95d | 0.85d | 0.39c | 0.29 | −0.09 | −0.17a | ||||||||
| LDL-Lb | 1.0 | 0.79d | 0.44d | 0.28c | −0.01 | −0.15 | |||||||||
| IDL-S | 1.0 | 0.70d | 0.55d | 0.17 | 0.00 | ||||||||||
| IDL-L | 1.0 | 0.90d | 0.62d | 0.41d | |||||||||||
| VLDL-S | 1.0 | 0.80d | 0.62d | ||||||||||||
| VLDL-M | 1.0 | 0.92d | |||||||||||||
| VLDL-L | 1.0 |
P < 0.05,
P < 0.01,
P < 0.001,
P < 0.0001
Supplementary Table 2. Correlation of CAC with Lipids and Lipoprotein subfractions.
| Lipid/Lipoprotein particle | Spearman's coefficient (rho) | P Value |
|---|---|---|
| HDL-c (mg/dL) | −0.1339 | 0.087 |
| LDL-c (mg/dL) | −0.1106 | 0.160 |
| Triglycerides (mg/dL) | 0.1828 | 0.0188 |
| HDL-S (nmol/L) | −0.1492 | 0.052 |
| HDL-L (nmol/L) | −0.1583 | 0.039 |
| LDL-VS (nmol/L) | 0.0993 | 0.214 |
| LDL-S (nmol/L) | 0.0520 | 0.5004 |
| LDL-M (nmol/L) | −0.0872 | 0.2584 |
| LDL-La (nmol/L) | −0.2010 | 0.0086 |
| LDL-Lb (nmol/L) | −0.1704 | 0.0263 |
| IDL-S (nmol/L) | −0.1685 | 0.0281 |
| IDL-L (nmol/L) | −0.0597 | 0.4396 |
| VLDL-S (nmol/L) | −0.0269 | 0.7282 |
| VLDL-M (nmol/L) | 0.0311 | 0.6876 |
| VLDL-L (nmol/L) | 0.0136 | 0.8606 |
Table 3 shows the median lipid and lipoprotein particle concentrations for those with CAC = 0 and CAC > 0. Higher concentrations of large LDL were seen among those with no CAC. Persons without CAC also had lower triglyceride and higher HDL particle concentrations, though statistical comparisons show that these differences were only marginally significant. In trend analyses comparing median lipoprotein subclasses across groups of CAC = 0, CAC = 1–99 and CAC = 100 or more (Supplementary Table 3), there was a trend to increasing median triglycerides and decreasing large LDL subfractions and decreasing HDL lipoprotein subfractions with increasing CAC.
Table 3. Comparisons of Lipid and Lipoprotein subclasses between Absence and Presence of CAC.
| Variable | CAC = 0 | CAC > 0 | P value* |
|---|---|---|---|
| (N = 88) | (N = 82) | ||
| LDL-C (mg/dl) | 128 (103–151) | 123 (96–143) | 0.096 |
| HDL-C (mg/dl) | 47 (41–57) | 45 (40–54) | 0.245 |
| Triglycerides (mg/dl) | 124 (95–168) | 149 (109–206) | 0.065 |
| HDL-S (nmol/L) | 415 (301–632) | 452 (343–686) | 0.352 |
| HDL-L (nmol/L) | 266 (191–392) | 286 (211–362) | 0.742 |
| LDL-VS (nmol/L) | 286 (232–383) | 271 (220–349) | 0.279 |
| LDL-S (nmol/L) | 297 (220–393) | 240 (183–348) | 0.022 |
| LDL-M (nmol/L) | 247 (182–317) | 204 (163–301) | 0.051 |
| LDL-La (nmol/L) | 224 (175–274) | 187 (149–256) | 0.026 |
| LDL-Lb (nmol/L) | 200 (151–255) | 179 (147–242) | 0.247 |
| IDL-S (nmol/L) | 6675 (5928–8301) | 6290 (5700–7600) | 0.090 |
| IDL-L (nmol/L) | 21655 (19962–25815) | 20609 (18762–24192) | 0.075 |
| VLDL-S (nmol/L) | 71 (56–94) | 68 (52–85) | 0.293 |
| VLDL-M (nmol/L) | 56 (43–94) | 63 (36–85) | 0.819 |
| VLDL-L (nmol/L) | 16 (9–33) | 17 (8–30) | 0.700 |
All values are medians (interquartile ranges) unless otherwise stated.
LDL-C Low density lipoprotein cholesterol; LDL Low density lipoprotein; HDL-C High-density lipoprotein cholesterol; HDL High-density lipoprotein cholesterol; IDL Intermediate-density lipoprotein, VLDL very-low-density lipoprotein;
P value for nonparametric (Wilcoxon rank-sum test) comparison of continuous variables between binary groups
Supplementary Table 3. Relationship CAC and Lipoproteins.
| Variable | CAC = 0 | CAC 1–99 | CAC 100+ | P trend |
|---|---|---|---|---|
| (N = 88) | (N = 50) | (N = 32) | ||
| LDL-c (mg/dL) | 128 (103–151) | 115 (97–140) | 123 (98–142) | 0.172 |
| HDL-c (mg/dL) | 47 (41–57) | 48 (41–54) | 42 (38–49) | 0.065 |
| Triglycerides (mg/dL) | 124 (95–168) | 140 (92–172) | 164 (118–237) | 0.016 |
| LDL-VS (nmol/L) | 415 (301–632) | 402 (341–592) | 506 (352–749) | 0.126 |
| LDL-S (nmol/L) | 266 (191–392) | 258 (203–322) | 311 (217–410) | 0.217 |
| LDL-M (nmol/L) | 286 (232–383) | 262 (220–356) | 278 (222–357) | 0.413 |
| LDL-La (nmol/L) | 270 (220–393) | 253 (183–353) | 231 (184–330) | 0.013 |
| LDL-Lb (nmol/L) | 247 (182–317) | 223 (163–301) | 197 (157–283) | 0.036 |
| IDL-S (nmol/L) | 224 (175–274) | 186 (144–259) | 192 (159–243) | 0.036 |
| IDL-L (nmol/L) | 200 (151–255) | 177 (141–214) | 190 (163–251) | 0.771 |
| HDL-L (nmol/L) | 6675 (5928–8301) | 6345 (5700–7880) | 6142 (5597–7340) | 0.047 |
| HDL-S (nmol/L) | 21655 (19962–25815) | 20832 (18570–24913) | 20449 (18266–23961) | 0.047 |
| VLDL-S (nmol/L) | 71 (56–94) | 61 (48–81) | 70 (59–86) | 0.825 |
| VLDL-M (nmol/L) | 56 (43–94) | 56 (32–76) | 68 (43–91) | 0.548 |
| VLDL-L (nmol/L) | 16 (9–33) | 15 (6–27) | 21 (11–35) | 0.685 |
Results of the principal component (PC) descriptions are shown in Table 4 and are graphically described in the Supplementary Figs. 1–3. As shown in the scree and variance plots (Supplementary Fig. 1) and in Table 4, the first three principal components accounted for more than 80% of the variance in the data. The contributions to PC1 were more evenly split across lipoprotein particle groups with slightly greater contributions from the small and medium LDL particles, the small and large IDL particles and the small VLDL particles. The major contributions of PC2 were VLDL particle in the positive direction and the large LDL particles in the negative direction, while PC3 represents HDL lipoprotein particles in the positive direction and small and medium LDL particles as well as large IDL particles in the negative direction. Addition of HDL-C, LDL-C and triglycerides altered the contribution of the large IDL to PC3 but did not significantly alter the other PC patterns. The loading plots (Supplementary Fig. 2) show the relative lipoprotein contributions and their directions as described above.
Table 4. Description of Principal Components.
| Measure | Principal Components with Lipoprotein only |
Principal Components with Lipoproteins and Lipids |
||||
|---|---|---|---|---|---|---|
| PC1 | PC2 | PC3 | PC1+ | PC2+ | PC3+ | |
| LDL-C (mg/dl) | − | − | − | +0.213 | −0.117 | −0.451 |
| HDL-C (mg/dl) | − | − | − | +0.039 | −0.337 | +0.468 |
| Triglycerides (mg/dl) | − | − | − | +0.115 | +0.448 | +0.187 |
| HDL-S (nmol/L) | +0.315 | −0.167 | +0.387 | +0.288 | −0.143 | +0.321 |
| HDL-L (nmol/L) | +0.269 | −0.152 | +0.602 | +0.244 | −0.207 | +0.497 |
| LDL-VS (nmol/L) | +0.276 | +0.273 | −0.064 | +0.265 | +0.225 | +0.093 |
| LDL-S (nmol/L) | +0.308 | +0.111 | −0.451 | +0.297 | +0.155 | −0.177 |
| LDL-M (nmol/L) | +0.312 | −0.174 | −0.436 | +0.309 | −0.074 | −0.266 |
| LDL-La (nmol/L) | +0.240 | −0.437 | +0.064 | +0.241 | −0.352 | −0.063 |
| LDL-Lb (nmol/L) | +0.266 | −0.390 | −0.185 | +0.270 | −0.278 | −0.199 |
| IDL-S (nmol/L) | +0.319 | −0.240 | +0.179 | +0.304 | −0.225 | −0.266 |
| IDL-L (nmol/L) | +0.345 | +0.122 | −0.436 | +0.336 | +0.063 | +0.005 |
| VLDL-S (nmol/L) | +0.325 | +0.233 | −0.003 | +0.321 | +0.154 | −0.081 |
| VLDL-M (nmol/L) | +0.271 | +0.397 | +0.045 | +0.264 | +0.323 | +0.009 |
| VLDL-L (nmol/L) | +0.175 | +0.468 | +0.203 | +0.179 | +0.384 | +0.153 |
| % Variance | 58.8 | 21.4 | 7.3 | 51.6 | 22.8 | 7.8 |
Supplementary Fig. 2.
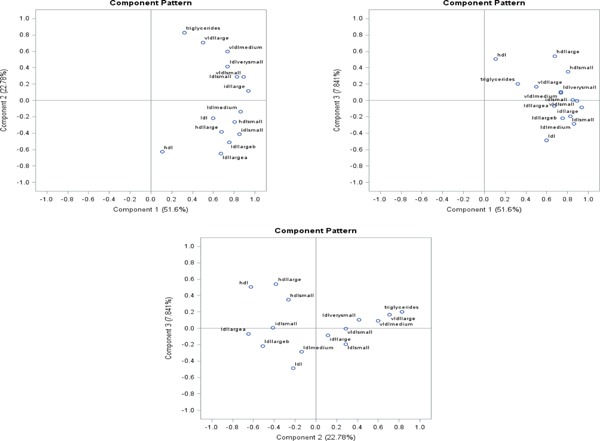
Loading plots for PC 1, PC 2 and PC 3
In multivariate boot-strapped analysis, controlling for earlier mentioned covariates, there was no association between PC1 and the presence of CAC. PC2 was associated with a 22% increase in the odds of CAC (OR 1.22, 95% CI: 1.17–1.27, p < 0.05 in 100% of boot-strapped analysis) while PC3 showed a modest but significant reduction in CAC odds (OR 0.91, 95% CI: 0.85–0.97, p < 0.05 in 88% of boot-strapped analysis). Analysis of the cholesterol and lipoprotein particles showed that the large LDL particles were protective of CAC, and the small and medium LDL were associated with greater odds for the presence of CAC. Notably, LDL-C did not show an association with CAC.
Discussion
In this study of 170 relatively young individuals with high cardiometabolic risk, two of the three principal component axes (accounting for about 88% of the variance) of lipoprotein distribution were associated with the presence of CAC, even after controlling for traditional cardiovascular risk factors. Although PC1 accounted for nearly 60% of the variance, PC1 did not exhibit much variation in lipoprotein subclasses and was not associated with CAC. Each SD increase in PC2, representing decreased medium and large LDL lipoprotein particles, increased VLDL and small LDL lipoprotein particles, and increased triglycerides, was associated with a 22% increase in the odds of CAC. On the other hand, a each SD increase in PC3, a combination of increasing small and large HDL particles and decreasing small and medium LDL particles, was associated with a 9% reduction in the odds of CAC. Musunuru and colleagues, using a principal component analyses method in the Malmö diet and Cancer-Cardiovascular Cohort (MDC-CC) demonstrated that a pattern with increased small and medium LDL particle concentrations, decreased large HDL particle concentrations and increased triglyceridemia (referred to as atherogenic dyslipidemia)12, 21). PC2's profile is similar to the atherogenic lipoprotein profile described by Musunuru et al., a profile demonstrated to be associated with increased atherosclerotic cardiovascular disease mortality risk22).
A previous study, using the concept of a principal component analysis, identified three separate axes of cardiovascular risk. In that study, the authors demonstrated that a principal component axis that comprised mainly of contributions from increasing VLDL and LDL particles, as well as another PC axis in which small and medium LDL particles combined with diminishing (negative direction) large HDL, was associated with increased risk of CV events12). In a separate study, a PC axis characterized by contributions from VLDL in the positive direction and large LDL particles in the negative direction was associated with incident CAC in persons with CKD23). Our study showed similar results with the aforementioned studies, with an axis of CAC risk defined by the combination of VLDL particles and diminishing large LDL particles (i.e. in the negative direction). We also demonstrated modest protection with a PC axis that combined increasing HDL particles with diminishing LDL particles. In a search of the published literature, we did not find any other studies that had examined lipoproteins and their association with CAC in terms of axis of risk in relatively young patients with high cardiometabolic risk but otherwise healthy.
Table 5. Boost Strapped Analysis for Odds ratio of CAC.
| Principal Components | Boot Strapped N | Mean Adjusted OR (95% CI) per SD increase | % with P < 0.05 |
|---|---|---|---|
| PC 1 | 5000 | 1.01 (0.98, 1.03) | 4 |
| PC 2 | 5000 | 1.22 (1.17, 1.27) | 100 |
| PC 3 | 5000 | 0.91 (0.85, 0.97) | 88.4 |
| HDL-C (mg/dl) | 5000 | 0.75 (0.70, 0.81) | 100 |
| LDL-C (mg/dl) | 5000 | 0.99 (0.98, 1.06) | 5.9 |
| Triglycerides (mg/dl) | 5000 | 1.27 (1.18, 1.36) | 100 |
| HDL-S (nmol/L) | 5000 | 0.92 (0.89, 0.99) | 65.9 |
| HDL-L (nmol/L) | 5000 | 0.89 (0.83, 0.95) | 95.5 |
| LDL-VS (nmol/L) | 5000 | 1.46 (1.35, 1.48) | 100 |
| LDL-S (nmol/L) | 5000 | 1.20 (1.11, 1.28) | 100 |
| LDL-M (nmol/L) | 5000 | 1.00 (0.93, 1.07) | 2 |
| LDL-La (nmol/L) | 5000 | 0.75 (0.70, 0.81) | 100 |
| LDL-Lb (nmol/L) | 5000 | 0.83 (0.77, 0.89) | 100 |
| IDL-S (nmol/L) | 5000 | 0.85 (0.79, 0.91) | 99.1 |
| IDL-L (nmol/L) | 5000 | 1.16 (1.08, 1.26) | 99.1 |
| VLDL-S (nmol/L) | 5000 | 1.21 (1.12, 1.31) | 100 |
| VLDL-M (nmol/L) | 5000 | 1.19 (1.10, 1.28) | 99.8 |
| VLDL-L (nmol/L) | 5000 | 1.00 (0.93, 1.07) | 3.6 |
Sample bootstrapped to size of 5000. Regression analysis conducted 1000 times. OR and CIs is calculated as the mean of OR and their upper and lower CI limits from 1000 bootstrapped analysis.
% with P < 0.05 is the frequency of OR that have P < 0.05 out of analysis conducted 1000 times.
Controlled for age, sex, blood pressure, presence of diabetes, cigarette smoking, diet and physical activity. All lipoproteins were included in regression models for the individual lipoproteins.
PC2 represents an axis of risk that is characterized by high triglyceride rich lipoproteins (TGRL) i.e. VLDL combined with low levels of large LDL particles. TGRLs are proinflammatory, leading to atherosclerosis by pathways that involve the upregulation of TNF-alpha, induction of vascular cell adhesion molecules (VCAM) and promotion of monocyte infiltration of the vessel wall24). TGRLs have been associated with risk of ASCVD, ASCVD-related mortality and all-cause mortality25). Elevated VLDL has also been associated with the presence of CAC in both diabetic and non-diabetic individuals26). In contrast, HDL lipoprotein exerts its anti-atherogenic effect through exertion multiple anti-oxidant mechanisms and promotion of efflux of excess cholesterol from foam cells in the arterial wall27). Thus, it is conceivable that a lipoprotein profile predominated by increased HDL particles appears protective of CAC.
Ion mobility analysis for the subfractionation of lipoproteins employs a gas-phase chromatography system that directly counts the lipoprotein particles10). Lipoprotein subfractionation using the ion mobility analysis has been used in other large studies11, 12) and holds the advantage of directly assessing particle counts without the use of an algorithm10). To our knowledge, this is the first study using ion-mobility analysis that identifies CAC risk by lipoprotein profile.
As noted in the results, the individual lipoprotein subfractions are correlated in varying degrees both within classes (e.g. HDL lipoprotein subfractions being correlated) and between classes (e.g. HDL lipoprotein subfractions with LDL subfractions, Table 3). Therefore, analysis of individual subfractions without context to the others poses a dilemma with interpretation of results (Table 2). To circumvent this, we conducted principal component analyses. Principal component analysis has the advantage of showing several patterns of lipoprotein distributions. Therefore, it provides information on the distribution of lipoproteins relative to each other making assessments of the entire distribution and not just individual lipoproteins feasible. PC analysis is widely used when there are multiply-correlated data as is seen in lipoprotein subfraction tests (Table 2). PC analysis in the assessment of lipoprotein distribution and their risk of CV outcomes is not unique to this study12, 23). For instance, Musunuru and colleagues employed a PC analysis in the assessment of lipoprotein profiles and their risk of cardiovascular and all-cause mortality12). However, this is the first study to use a PC analysis of lipoprotein subfractions to assess CAC risk in a relatively young high-risk population.
Our study has some notable limitations. The sample size of 170 is limited in power to determine small statistical differences particularly when several covariates are included in the regression model. To overcome this, we performed a boot-strapped analysis to create 5000 samples with replacement to eliminate the problems of sample size and conducted the boot-strapping regression analyses 1000 times to improve precision. Nonetheless, our findings can only be interpreted in the context of the population studied, thus limiting its generalizability. Our lack of temporal data precludes comments or conclusions on lipoproteins and causality or progress of CAC.
In conclusion, PC analysis of lipoprotein subfractions measured by ion-mobility testing identified at least 2 axes of CAC risk in this relatively young, high cardiometabolic risk population. A lipoprotein profile dominated by high TGRLs such VLDL and low in large LDL particles was associated with elevated CAC risk, while a profile that was high in HDL lipoproteins and low in small and medium lipoproteins conferred modest protection from CAC. In contrast, LDL-C alone was not associated with CAC. Thus, in a population regarded as high risk, a simple blood test such as lipoprotein sub-fraction analysis, may help to further discriminate patients who will require more intensive cardiovascular work-up and treatment.
Conflicts of Interest and Funding Declaration
Dr Nasir is on the advisory board for Quest Diagnostics and is a consultant for Regeneron. No other potential conflicts of interest relevant to this article were reported. This research was partially funded by Quest Diagnostics Incorporated, USA.
References
- 1). Nasir K, Michos ED, Blumenthal RS, Raggi P. Detection of High-Risk Young Adults and Women by Coronary Calcium and National Cholesterol Education Program Panel III Guidelines. J Am Coll Cardiol, 2005; 46: 1931-1936 [DOI] [PubMed] [Google Scholar]
- 2). Goff DC, Lloyd-Jones DM, Bennett G, Coady S, D'Agostino RB, Gibbons R, Greenland P, Lackland DT, Levy D, O'Donnell CJ, Robinson J, Schwartz JS, Shero ST, Smith SC, Sorlie P, Stone NJ, Wilson PWF. 2013 ACC/AHA Guideline on the Assessment of Cardiovascular Risk A Report of the American College of Cardiology/American Heart Association Task Force on Practice Guidelines. Circulation, 2013. November 12; 01.cir.0000437741.48606.98 [Google Scholar]
- 3). Blaha M, Budoff MJ, Shaw LJ, Khosa F, Rumberger JA, Berman D, Callister T, Raggi P, Blumenthal RS, Nasir K. Absence of Coronary Artery Calcification and All-Cause Mortality. JACC Cardiovasc Imaging, 2009; 2: 692-700 [DOI] [PubMed] [Google Scholar]
- 4). Valenti V, Ó Hartaigh B, Heo R, Cho I, Schulman-Marcus J, Gransar H, Truong QA, Shaw LJ, Knapper J, Kelkar AA, Sandesara P, Lin FY, Sciarretta S, Chang H-J, Callister TQ, Min JK. A 15-Year Warranty Period for Asymptomatic Individuals Without Coronary Artery Calcium: A Prospective Follow-Up of 9,715 Individuals. JACC Cardiovasc Imaging, 2015; 8: 900-909 [DOI] [PMC free article] [PubMed] [Google Scholar]
- 5). Carmena R, Duriez P, Fruchart J-C. Atherogenic Lipoprotein Particles in Atherosclerosis. Circulation, 2004; 109 (23 suppl 1): III-2-III-7 [DOI] [PubMed] [Google Scholar]
- 6). National Cholesterol Education Program (NCEP) Expert Panel on Detection, Evaluation, and Treatment of High Blood Cholesterol in Adults (Adult Treatment Panel III). Third Report of the National Cholesterol Education Program (NCEP) Expert Panel on Detection, Evaluation, and Treatment of High Blood Cholesterol in Adults (Adult Treatment Panel III) final report. Circulation, 2002; 106: 3143-3421 [PubMed] [Google Scholar]
- 7). Martínez-González MA, García-Arellano A, Toledo E, Salas-Salvadó J, Buil-Cosiales P, Corella D, Covas MI, Schröder H, Arós F, Gómez-Gracia E, Fiol M, Ruiz-Gutiérrez V, Lapetra J, Lamuela-Raventos RM, Serra-Majem L, Pintó X, Muñoz MA, Wärnberg J, Ros E, Estruch R, Investigators for the PS A 14-Item Mediterranean Diet Assessment Tool and Obesity Indexes among High-Risk Subjects: The PREDIMED Trial. PLOS ONE, 2012; 7: e43134. [DOI] [PMC free article] [PubMed] [Google Scholar]
- 8). Armstrong T, Bull F. Development of the World Health Organization Global Physical Activity Questionnaire (GPAQ). J Public Health, 2006; 14: 66-70 [Google Scholar]
- 9). Pickering TG, Hall JE, Appel LJ, Falkner BE, Graves J, Hill MN, Jones DW, Kurtz T, Sheps SG, Roccella EJ. Recommendations for Blood Pressure Measurement in Humans and Experimental Animals Part 1: Blood Pressure Measurement in Humans: A Statement for Professionals from the Subcommittee of Professional and Public Education of the American Heart Association Council on High Blood Pressure Research. Hypertension, 2005; 45: 142-161 [DOI] [PubMed] [Google Scholar]
- 10). Caulfield MP, Li S, Lee G, Blanche PJ, Salameh WA, Benner WH, Reitz RE, Krauss RM. Direct Determination of Lipoprotein Particle Sizes and Concentrations by Ion Mobility Analysis. Clin Chem, 2008; 54: 1307-1316 [DOI] [PubMed] [Google Scholar]
- 11). Mora S, Caulfield MP, Wohlgemuth J, Chen Z, Superko HR, Rowland CM, Glynn RJ, Ridker PM, Krauss RM. Atherogenic Lipoprotein Subfractions Determined by Ion Mobility and First Cardiovascular Events After Random Allocation to High-Intensity Statin or Placebo: The Justification for the Use of Statins in Prevention: An Intervention Trial Evaluating Rosuvastatin (JUPITER) Trial. Circulation, 2015; 132: 2220-2229 [DOI] [PMC free article] [PubMed] [Google Scholar]
- 12). Musunuru K, Orho-Melander M, Caulfield MP, Li S, Salameh WA, Reitz RE, Berglund G, Hedblad B, Engström G, Williams PT, Kathiresan S, Melander O, Krauss RM. Ion mobility analysis of lipoprotein subfractions identifies three independent axes of cardiovascular risk. Arterioscler Thromb Vasc Biol, 2009; 29: 1975-1980 [DOI] [PMC free article] [PubMed] [Google Scholar]
- 13). Friedewald WT, Levy RI, Fredrickson DS. Estimation of the concentration of low-density lipoprotein cholesterol in plasma, without use of the preparative ultracentrifuge. Clin Chem, 1972; 18: 499-502 [PubMed] [Google Scholar]
- 14). Agatston AS, Janowitz WR, Hildner FJ, Zusmer NR, Viamonte M, Detrano R. Quantification of coronary artery calcium using ultrafast computed tomography. J Am Coll Cardiol, 1990; 15: 827-832 [DOI] [PubMed] [Google Scholar]
- 15). Smith Lindsay I. A tutorial on Principal Components Analysis, 2002 [Google Scholar]
- 16). Resampling methods: concepts, applications, and justification. Yu, Chong Ho [Internet]. [cited 2016 Jun 17]. Available from: http://pareonline.net/getvn.asp?v=8&n=19
- 17). Efron B. Bootstrap Methods: Another Look at the Jackknife. Ann Stat, 1979; 7: 1-26 [Google Scholar]
- 18). Dai J, Su Y-X, Bartell S, Le N-A, Ling W-H, Liang Y-Q, Gao L, Wu H-Y, Veledar E, Vaccarino V. Beneficial effects of designed dietary fatty acid compositions on lipids in triacylglycerol-rich lipoproteins among Chinese patients with type 2 diabetes mellitus. Metabolism, 2009; 58: 510-518 [DOI] [PubMed] [Google Scholar]
- 19). Stata Statistical Software: Release 12. College Station, Texas: StataCorp LP; 2011 [Google Scholar]
- 20). SAS Statistical Software: Version 9.4. Cary, NC: SAS Institute; 2013 [Google Scholar]
- 21). Austin MA, King MC, Vranizan KM, Krauss RM. Atherogenic lipoprotein phenotype. A proposed genetic marker for coronary heart disease risk. Circulation, 1990; 82: 495-506 [DOI] [PubMed] [Google Scholar]
- 22). Musunuru K. Atherogenic Dyslipidemia: Cardiovascular Risk and Dietary Intervention. Lipids, 2010; 45: 907-914 [DOI] [PMC free article] [PubMed] [Google Scholar]
- 23). Lamprea-Montealegre JA, McClelland RL, Astor BC, Matsushita K, Shlipak M, Boer IH de, Szklo M. Chronic Kidney Disease, Plasma Lipoproteins, and Coronary Artery Calcium Incidence: The Multi-Ethnic Study of Atherosclerosis. Arterioscler Thromb Vasc Biol, 2013; 33: 652-658 [DOI] [PubMed] [Google Scholar]
- 24). Rosenson RS, Davidson MH, Hirsh BJ, Kathiresan S, Gaudet D. Genetics and Causality of Triglyceride-Rich Lipoproteins in Atherosclerotic Cardiovascular Disease. J Am Coll Cardiol, 2014; 64: 2525-2540 [DOI] [PubMed] [Google Scholar]
- 25). Nordestgaard BG. Triglyceride-Rich Lipoproteins and Atherosclerotic Cardiovascular Disease New Insights from Epidemiology, Genetics, and Biology. Circ Res, 2016; 118: 547-563 [DOI] [PubMed] [Google Scholar]
- 26). Colhoun HM, Otvos JD, Rubens MB, Taskinen MR, Underwood SR, Fuller JH. Lipoprotein Subclasses and Particle Sizes and Their Relationship with Coronary Artery Calcification in Men and Women with and Without Type 1 Diabetes. Diabetes, 2002; 51: 1949-1956 [DOI] [PubMed] [Google Scholar]
- 27). Natarajan P, Ray KK, Cannon CP. High-Density Lipoprotein and Coronary Heart DiseaseCurrent and Future Therapies. J Am Coll Cardiol, 2010; 55: 1283-1299 [DOI] [PubMed] [Google Scholar]