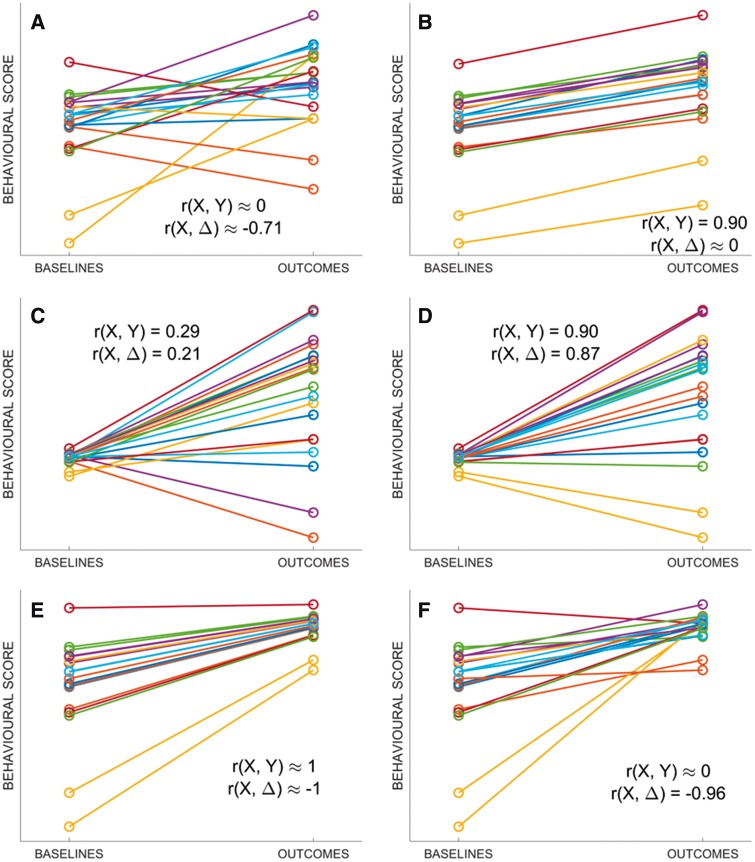
Figure 3.
Exemplar points on the surface in Fig. 2 . Simulated recovery data, corresponding to the points A–F marked on the surface in Fig. 1. (A) Baselines and outcomes are entirely independent [r(X,Y) = 0], yet r(X,Δ) is relatively strong; this is the canonical example of mathematical coupling, first introduced by Oldham (1962). (B) Recovery is constant with minimal noise, so baselines and outcomes are equally variable (σY/σX ≈ 1) and recovery is unrelated to baseline scores (r(X, Δ) ≈ 0). (C and D) Outcomes are more variable than baselines (σY/σX ≈ 5), and r(X,Δ) converges to r(X,Y). (E) Recovery is 70% of lost function, so outcomes are less variable than baselines (σY/σX ≈ 0.3); even with shuffled outcomes data (F) baselines and recovery still appear to be strongly correlated.

