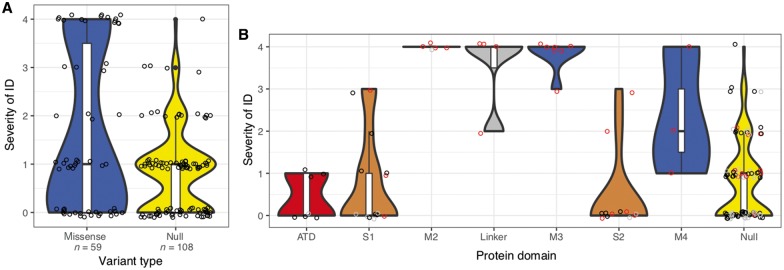
Figure 3.
Severity of ID/DD. Comparison of severity of ID/DD in carriers of variants in different protein domains. (A) Missense (blue) and null (truncating) variants (yellow). (B) Missense variants in different protein domains in the order of the linear amino acid sequence and truncating variants (far right). Here, variants that were inherited are coloured black, de novo variants are red and unknown variants are grey. Violins are plotted to have the same maximum width. Bottom, middle and top of boxplots within violins show the 1st, 2nd and 3rd quartiles of the data; whiskers maximally extend to 1.5× interquartile range.

