

Abstract
ThioTEPA, an alkylating agent with anti-tumor activity, has been used as an effective anticancer drug since the 1950s. However, a complete understanding of how its alkylating activity relates to clinical efficacy has not been achieved, the total urinary excretion of thioTEPA and its metabolites is not resolved, and the mechanism of formation of the potentially toxic metabolites S-carboxymethylcysteine (SCMC) and thiodiglycolic acid (TDGA) remains unclear. In this study, the metabolism of thioTEPA in a mouse model was comprehensively investigated using ultra-performance liquid chromatography coupled with electrospray ionization quadrupole time-of-flight mass spectrometry (UPLC-ESI-QTOFMS) based-metabolomics. The nine metabolites identified in mouse urine suggest that thioTEPA underwent ring-opening, N-dechloroethylation, and conjugation reactions in vivo. SCMC and TDGA, two downstream thioTEPA metabolites, were produced from thioTEPA from two novel metabolites 1,2,3-trichloroTEPA (VII) and dechloroethyltrichloroTEPA (VIII). SCMC and TDGA excretion were increased about 4-fold and 2-fold, respectively, in urine following the thioTEPA treatment. The main mouse metabolites of thioTEPA in vivo were TEPA (II), monochloroTEPA (III) and thioTEPA-mercapturate (IV). In addition, five thioTEPA metabolites were detected in serum and all shared similar disposition. Although thioTEPA has a unique chemical structure which is not maintained in the majority of its metabolites, metabolomic analysis of its biotransformation greatly contributed to the investigation of thioTEPA metabolism in vivo, and provides useful information to understand comprehensively the pharmacological activity and potential toxicity of thioTEPA in the clinic.
Keywords: ThioTEPA, Metabolomics, Ultraperformance liquid chromatography, Time-of-flight mass spectrometry, Tandem mass spectrometry
Graphical Abstract
1. Introduction
The alkylating agent, thioTEPA (N,N’,N”-triethylenethiophosphoramide), is used as an anti-cancer drug [1–2], and commonly employed for the treatment of breast, ovarian, and bladder cancer, and bone marrow ablation in combination regimens. ThioTEPA is believed to exert its pharmacological activity through the generation of DNA adducts [3–4]. It has been proposed that thioTEPA is a polyfunctional alkylating agent which can interact with DNA by two different pathways. One is the formation of interstand cross-links between thioTEPA and DNA molecules due to its alkylating activity [5–6]. Another suggestion is that thioTEPA is a prodrug for aziridine, which can result in the formation of guanine adducts and DNA chain scission [7].
To date, three metabolites TEPA, monochloroTEPA, and thioTEPA-mercapturate have been reported in vivo [8], and these also possess alkylating activity. ThioTEPA-mercapturate was generated from thioTEPA through the intermediate metabolites monoglutathionylthioTEPA and thioTEPA-cysteinate [8–9]. Previous studies have suggested that cytochrome P450s CYP3A4, 2B1, 2B6, and 2C11 were the primary metabolic enzymes involved in the conversion of thioTEPA to TEPA [10–12]. In addition, monochloroTEPA can be produced non-enzymatically from TEPA in vivo and in vitro, which is highly dependent on pH [13].
ThioTEPA pharmacokinetics remained largely unknown until the development of gas chromatography in the 1980s. Previous clinical studies suggested that thioTEPA can be quickly eliminated from serum (t1/2β = 43–174 min), but TEPA persisted longer in the serum with a half-life of 3–21h [14–15]. Human urinary excretion of unchanged thioTEPA, TEPA, monocholoroTEPA, and thioTEPA-mercapturate was 0.1–1.5%, 1.8–25.5%, 0.3–0.8% and 6.3–22.7% of the total administered thioTEPA, respectively [16]. In these studies, there were significant differences between the excreted total alkylating activity and the total quantitative excretion of thioTEPA and its metabolites [8, 17–18], suggesting the presence of unknown metabolites of thioTEPA.
In the clinic, encephalopathy has been observed following treatment with high doses of thioTEPA [19–21]. It has been reported that S-carboxymethylcysteine (SCMC) and thiodiglycolic acid (TDGA) might be the possible toxic metabolites involved in ifosfamide-induced encephalopathy [22–24], and, interestingly, SCMC and TDGA have also been detected in human urine after administration of thioTEPA and at low levels in the urine of drug-free normal human volunteers [25–26]. However, how SCMC and TDGA are formed from thioTEPA remains unclear.
Metabolomics, an approach for analysis of the metabolites present in fluids, tissues or cells, is evolving as a useful tool in drug research and development [27–29]. Various analytical techniques [such as ultra-performance chromatography-linked time-of-flight mass spectrometry (UPLC-TOFMS), gas chromatography mass spectrometry (GC-MS) and nuclear magnetic resonance (NMR)], and multivariate data analysis [such as principal components analysis (PCA), partial least squares-discriminant analysis (PLS-DA) and orthogonal projection to latent structures-discriminant analysis (OPLS-DA)] have been applied in metabolomic-based drug metabolism studies. In terms of understanding drug metabolism using UPLC-ESI-QTOFMS-based metabolomics, there have been many successful applications, such as determining the metabolic maps of acetaminophen [30], melatonin [31], arecoline [32], and, recently, ifosfamide and cyclophosphamide [33].
UPLC-ESI-QTOFMS-based metabolomics was applied to understand better the metabolism of thioTEPA in vivo. The present study sheds new light on the metabolic pathway of thioTEPA in vivo, especially in the production of two important endogenous metabolites, SCMC and TDGA. The current study contributes to our understanding of the mechanisms underlying safety and efficacy of thioTEPA in the clinic.
2. Materials and Methods
2.1. Chemicals and reagents
ThioTEPA, S-carboxymethylcysteine (SCMC), thiodiglycolic acid (TDGA), chloroacetaldehyde (CAA), 4-nitrobenzoic acid, debrisoquine, and NADPH were purchased from Sigma–Aldrich (St. Louis, MO). All solvents for UPLC-ESI-QTOFMS and triple quadrupole mass spectrometry and other chemicals were of the highest grade commercially available.
2.2. In vitro metabolism of thioTEPA in mouse liver microsomes
Livers from untreated 6 to 8 week-old age male C57BL/6 mice were homogenized, and microsomes were prepared as described previously [34]. Microsomal incubations were carried out in 50 mM Tris-HCl buffer solution, pH 7.4, containing 0.5 mg/ml microsomal protein, 2 mM MgCl2, 20 μM thioTEPA, and 2 mM freshly prepared NADPH in a final volume of 200 μl. After 30 min incubation at 37°C, the reaction was stopped using dry ice, 100 μl of the reaction mix was transferred to a new tube and acetonitrile (100 μl) directly added to precipitate protein. After centrifuging at 14000 × g for 20 min, an 5 μl aliquot of the supernatant was injected into the UPLC-ESI-QTOFMS.
2.3. In vivo metabolism of thioTEPA in mice
Male C57BL/6 mice 6–8 weeks age were used for urine and serum metabolite profiling. Mice were housed four to five animals per cage and maintained under a standard 12 h light, 12 h dark cycle with water and chow provided ad libitum. Handling was in accordance with an animal study protocol approved by the National Cancer Institute Animal Care and Use Committee. ThioTEPA dissolved in saline solution was administrated by intraperitoneal injection (i.p.) at the dose of 50 mg/kg (approximately 1mg of thioTEPA). Control mice were treated with saline alone. Urine samples were collected from mice housed in glass metabolic cages (Metabowls, Jencons Scientific USA, Bridgeville, PA). Blood was collected in BD microtainer® serum separator tubes (Franklin Lakes, NJ) by retroorbital bleeding after thioTEPA treatment. Serum was isolated following a centrifugation at 8000 × g for 15 min. Ten mice were used for the identification of thioTEPA metabolites in urine and serum after treated for 24 h, including 5 control and 5 thioTEPA treatment mice. The urine samples for the excretion experiment were collected at 1, 4, 10, and 24 h following treatment. The blood samples for the pharmacokinetic study were collected at 0.08, 0.25, 0.5, 1, 4, 10, and 24 h after thioTEPA treatment. Four mice were used in each time point.
In addition, CAA, SCMC, and TDGA dissolved in saline solution were administrated by intraperitoneal injection (i.p.) at the dose of 2, 100, and 100 mg/kg (approximately 0.04, 2, and 2 mg drug), respectively. Control mice were treated with saline alone. Each treatment group included 4 mice. 24 h urine samples were collected in glass metabolic cages after treatment. Serum samples were also harvested from each group after treated for 24 h. All the urine and serum samples were separately stored at −80 °C before analysis.
2.4. UPLC-ESI-QTOFMS identification of thioTEPA metabolites
Urine samples were prepared by mixing 20 μl urine with 180 μl 50 % aqueous acetonitrile. Serum samples were prepared by mixing 10 μl serum with 190 μl 66% aqueous acetonitrile. After a centrifugation at 14000 × g for 20 min, a 5 μl aliquot of the supernatants were injected into a Waters UPLC-ESI-QTOFMS system (Waters Corporation, Milford, MA). The chemical components in urine, serum, or from microsome incubations mix were separated using an Acquity C18 BEH UPLC column (Waters Corporation). The flow rate 0.5 ml/min was maintained in a 10 min run. Solvent A was composed of water and 0.1% formic acid and solvent B was composed of acetonitrile and 0.1% formic acid. The gradient was maintained at 100% A for 0.5 min, increased to 100% B over the next 7.5 min and returned to 100% A in last 2 min. Data were collected in both positive ion mode and negative ion mode on a Waters Q-TOF Premier, which was operated in full-scan mode at 50 to 850 m/z. Nitrogen was used as both cone gas (50 l/h) and desolvation gas (600 l/h). Source temperature and desolvation temperature were set at 120 °C and 350 °C, respectively. The capillary voltage and cone voltage were 3000 and 20 V, respectively. The structures of thioTEPA metabolites were elucidated by tandem MS fragmentography with collision energies ranging from 15 to 40 eV.
2.5. Data processing and multivariate data analysis (MDA)
Centroided and integrated mass spectrometric data were deconvoluted by MarkerLynx software (Waters Corporation). A multivariate data matrix containing sample identity, m/z, retention time, and abundance was generated through peak recognition and integration. MetaboLynx software (Waters Corporation) was also used to generate a table of ions that was derived from putative thioTEPA-derived metabolites, such as TEPA. The data matrix was analyzed by SIMCA-P+12.0 software (Umetrics, Kinnelon, NJ). OPLS was conducted to identify the metabolites by comparing thioTEPA-treated mice and control mice on the basis of the corresponding loading plots and contribution lists.
2.6. UPLC-ESI-QTOFMS quantitation of thioTEPA and its metabolites
QuanLynx software was applied to quantify the amounts of thioTEPA and its metabolites in the urine and serum from their peak areas. The calibration curve of thioTEPA ([M+H]+ = 190.057) was constructed from 0.19 μM to 100.0 μM using debrisoquine (1μM; [M+H]+ = 176.118) as the internal standard. The concentration of thioTEPA in urine and serum was calculated by the peak area ratio (analyte/debrisoquine). Because the standards were unavailable for thioTEPA metabolites, their relative intensity in urine and serum were estimated by comparing the peak areas from the total ion chromatogram.
2.7. Triple quadrupole mass spectrometry quantitation of SCMC and TDGA
Deproteinated urine samples from thioTEPA-treated mice were analyzed on an Applied Biosystems API 2000 ESI triple quadrupole mass spectrometer (Applied Biosystems, Foster City, CA) using a Luna C18 column (Phenomenex, Torrance, CA, 50 mm × 4.6 mm i.d.). The mobile phase was 95% aqueous acetonitrile containing 0.1% formic acid. The flow rate was set at 0.2 ml/min. The mass spectrometer was operated in ESI negative ion mode. Nitrogen was used as the turbo ionspray and nebulizing gas. A voltage of 5 kV was applied to the sprayer needle, and turbo ionspray temperature was maintained at 350 °C. The calibration curves of SCMC (178.0→77.9) and TDGA (149.0→92.7) were constructed from 0.19 μM to 50.0 μM. 4-Nitrobenzoic acid (165.9→109.6) was used as an internal standard. Absolute peak areas were used to calculate peak area ratios (analyte/4-nitrobenzoic acid).
2.8. Clinical serum chemistry
Serum amylase, glucose, alanine transaminase (ALT), alkaline phosphatase (ALP), and other physiological serum parameters were measured using the VetScan VS2 Comprehensive Diagnostic Profile (Abaxis, Inc., Union City, CA).
2.9. Statistic analysis
Half-life was calculated using WinNonlin computer program (SCI, Apex, NC). Experimental values are expressed as mean ± S.D. Statistical analysis was performed using independent Student’s t tests.
3. Results
3.1. Metabolites of thioTEPA formed by mouse liver microsomes.
Ng et al. [10], using gas chromatography, reported only one thioTEPA metabolite formed from phenobarbital-induced rat hepatic microsomal incubations. In the present study, thioTEPA was incubated with non-induced mouse liver microsomes for 30 min and the deproteinated incubation was analyzed using UPLC-ESI-QTOFMS. MetaboLynx software (Waters Corp.) was used to generate a table of ions composed of theoretical thioTEPA metabolites. Combined with the extracted MS spectrum from the total ion chromatogram of the control (without NADPH) and test (with NADPH) samples, TEPA ([M+H]+ = 174.079) was the sole metabolite from thioTEPA generated by the in vitro system.
3.2. Identification and structural elucidation of thioTEPA metabolites in urine
Although just one thioTEPA metabolite was identified in vitro, two metabolites monochloroTEPA and thioTEPA-mercapturate were described in human urine [8]. Previous results suggested that thioTEPA can be transformed to other metabolites through non-cytochrome P450 pathways. To achieve a comprehensive detection of urinary metabolites, metabolomic analysis was applied to screen for thioTEPA metabolites. As shown in the scores scatter plot (Fig. 1A), urine samples from the thioTEPA-treated group were significantly separated from the control group by the presence of thioTEPA and thioTEPA metabolites. The ions were identified as the putative thioTEPA metabolites based on the trend plots (Fig. 2A–F). The chemical compositions and structures were determined by accurate mass measurements and further elucidated by MS/MS fragmentography. The results revealed the presence of thioTEPA parent ion (I), TEPA (II), monochloroTEPA (III), thioTEPA-mercapturate (IV), the intermediate product thioTEPA-cysteinate (V), two new metabolites (VII-VIII), and two potential toxic metabolites SCMC (IX) and TDGA (X) in the thioTEPA-treated mouse urine sample (Table 1). The mass spectra are presented in Fig. 3A–F.
Fig. 1.

Identification of thioTEPA metabolites in urine and serum using UPLC-ESI-QTOFMS-based metabolomics. (A) Scores plot of an OPLS model and OPLS loadings S-plot of urinary ions from control and thioTEPA-treated mice. Each point represents an individual mouse urine sample (top) and a urinary ion (bottom). ThioTEPA and its metabolites are labeled in the S-plot (I, II, IIa, III, IV, IVa, IVb, V, VI, VII, and VIII). (B) Scores plot of an OPLS model and OPLS loadings S-plot of serum ions from control and thioTEPA-treated mice. Each point represents an individual mouse serum sample (top) and a serum ion (bottom). ThioTEPA and its metabolites are labeled in the S-plot (I, II, III, and IV). The t[1] and t[2] correspond to principal components 1 and 2, respectively. The p(corr)[1]P values represent the interclass difference and p[1]P values represent the relative abundance of the ions. TDGA and SCMC were best detected in negative ion mode (ESI-) and therefore they are not shown in the OPLS loadings S-plot of positive ions (ESI+).
Fig. 2.

Trend plots of ions from thioTEPA metabolites in the control and thioTEPA-treated mice urine after treatment for 24 h. (A) Metabolite II with m/z value of 174.0797+. (B) Metabolite IV with m/z value of 353.0854+. (C) Metabolite V with m/z value of 311.0776+. (D) Metabolite VI with m/z value of 246.0326+. (E) Metabolite VII with m/z value of 282.0105+. (F) Metabolite VIII with m/z value of 220.0175+. Note the absence of putative drug metabolites in the control group. Metabolite codes correspond to those in Fig. 1. Obs ID represents the mouse urine sample and XVar values represent the relative abundance of the ions.
Table 1.
Identified thioTEPA metabolites in mouse urine.
| Symbol | RT (min) | Observed m/z | Formula | Mass Error (ppm) | Identity | MS/MS Fragments |
|---|---|---|---|---|---|---|
| I | 3.60 | 190.0574 | C6H12N3PS [H+] | 3.2 | Thiotepa | 190; 147; 104 |
| II | 1.84 | 174.0797 | C6H12N3OP [H+] | 0.6 | TEPA | 174; 131; 90 |
| IIa | 1.84 | 131.0380 | C4H7N2OP [H+] | 4.6 | TEPA fragment | |
| III | 2.32 | 210.0587 | C6H13ClN3OP [H+] | 11.4 | MonochloroTEPA | 210;167;126;112; 90 |
| IV | 3.95 | 353.0854 | C11H21N4O3PS2 [H+] | −4.8 | ThioTEPA-mercapturate | 353; 310; 267; 223; 198; 156; 112 |
| IVa | 3.95 | 267.0031 | C7H11N2O3PS2 [H+] | 1.5 | ThioTEPA-mercapturate fragment | |
| IVb | 3.95 | 375.0692 | C11H20N4O3PS2 [Na+] | 0.5 | ThioTEPA-mercapturate sodium adduct | |
| V | 2.64 | 311.0776 | C9H19N4O2PS2 [H+] | 3.5 | ThioTEPA-cysteinate | 311; 268; 225; 181 |
| VI | 3.22 | 246.0326 | C6H14Cl2N3OP [H+] | −1.6 | 1,2,-DichloroTEPA | 246; 203; 167; 126; 80 |
| VII | 4.50 | 282.0105 | C6H15Cl3N3OP [H+] | 2.8 | 1,2,3-TrichloroTEPA | 282; 203; 126; 80 |
| VIII | 2.52 | 220.0175 | C4H12Cl2N3OP [H+] | 0.9 | DechloroethyltrichloroTEPA | 220; 203; 141; 126; 80 |
| IX | 0.35 | 178.0171 | C5H9NO4S [H−] | −1.7 | SCMC | 178; 78 |
| X | 0.96 | 148.9912 | C4H6O4S [H−] | 2.0 | TDGA | 149; 93 |
Fig. 3.

Tandem MS and chemical structures of thioTEPA metabolites. (A) TEPA (II). (B) MonochloroTEPA (III). (C) ThioTEPA-mercapturate (IV). (D) 1,2-DichloroTEPA (VI). (E) 1,2,3-TrichloroTEPA (VII). (F) DechloroethyltrichloroTEPA (VIII). Note the chlorine isotope ratios depending on the presence of one (3:1), two (9:6:1) or three (27:27:9:1) chlorine atoms.
Metabolite VI (1,2-DichloroTEPA) was calculated as C6H14Cl2N3OP based on the accurate mass measurement, m/z 246.0326+. Comparison of the chemical composition with TEPA (C6H12N3OP) and monochloroTEPA (C6H13ClN3OP) suggested that metabolite VI was a ring-opened product from TEPA. Three chlorine isotope peaks m/z 246.035+, 248.032+ and 250.031+ with the ion intensity ratio of 9:6:1 in its MS spectra confirmed that two aziridines had been opened to produce the corresponding chloroethylamine group. In its MS/MS fragmentation pattern (Fig. 3D), three ions m/z 202.996+, 167.016+, and 125.990+ were generated by the loss of one aziridine, one chloroethylamine, and one aziridine and one chloroethylamine, respectively. According to the above inference, metabolite VI was identified as 1,2-dichloroTEPA, which was been reported to be a TEPA degradation product in the presence of sodium chloride at pH < 7 [35].
The new metabolite VII (1,2,3-TrichloroTEPA) was calculated as C6H15Cl3N3OP based on the accurate mass measurement, m/z 282.0105+. Compared with the chemical composition of TEPA (C6H12N3OP) and monochloroTEPA (C6H13ClN3OP), it was concluded that metabolite VI was a ring-opened product from TEPA. As seen from the molecular ion peaks of VII (Fig. 3E), four chlorine isotope peaks m/z 282.009+, 284.008+, 286.005+, and 288.233+ were clearly visible in its molecular ion peak. After the parent ions eliminated one chloroethylamine group (loss of 79 Da), the [M-79]+ gave three chlorine isotope peaks m/z 202.991+, 204.989+, and 206.980+. The observations suggested that three aziridines in VII had been opened and transformed into the corresponding chloroethylamine group. In its MS/MS fragment (Fig. 3E), two ions m/z 202.991+ and 125.983+ were generated by the elimination of one chloroethylamine and two chloroethylamines, respectively. The ion m/z 80.027+ was identified as a single chloroethylamine group. According to the above inference, metabolite VII was identified as 1,2,3-trichloroTEPA.
The new metabolite VIII (DechloroethyltrichloroTEPA) was calculated as C4H12Cl2N3OP based on the accurate mass measurement, m/z 220.0175+. Compared with the chemical composition of 1,2,3-trichloroTEPA (C6H15Cl3N3OP), metabolite VIII was a N-dechloroethylation product from 1,2,3-trichloroTEPA by the loss of one chloroethyl group. This metabolic pathway was similar to the known reaction forming 2- or 3-dechloroethylifosfamide from ifosfamide [33]. Three chlorine isotope peaks m/z 220.019+, 222.015+ and 224.010+ with the ion intensity ratio of 9:6:1 in its MS spectra were consistent with this conclusion. In its MS/MS fragmentation spectra (Fig. 3F), three ions m/z 202.995+, 140.999+, and 125.972+ were generated by the loss of one amine group, one chloroethylamine, and one amine group and one chloroethylamine, respectively. The ion m/z 80.027+ was identified as a single chloroethylamine group. Therefore, metabolite VIII was identified as dechloroethyltrichloroTEPA.
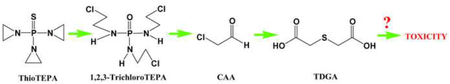
Metabolite IX (SCMC) and X (TDGA) were most likely derived from chloroacetaldehyde, which can be generated from the side chain of 1,2,3-trichloroTEPA [33]. SCMC and TDGA were detected in the negative mode. Their retention times and MS/MS fragmentation pattern were compared and confirmed with the authentic standards.
3.3. Identification of thioTEPA metabolites in serum
Although thioTEPA has been used clinically for decades, TEPA is the only identified metabolite in human and mouse serum. Here, metabolomic analysis was used to screen for and identify additional metabolites of thioTEPA in mouse serum samples. As shown in the scores scatter plot (Fig. 1B), serum samples from the thioTEPA-treated group were significantly separated from the control group. The thioTEPA parent ion (I), TEPA (II), monochloroTEPA (III), and thioTEPA-mercapturate (IV) were identified from the scores scatter plot (Fig. 1B). 1,2-DichloroTEPA (VI) and 1,2,3-trichloroTEPA (VII) were detected in the serum total ion chromatogram of thioTEPA-treated mice. All four metabolites except TEPA, are reported here for the first time (Table 2), and were identified by accurate mass measurement and MS/MS fragmentography.
Table 2.
Identified thioTEPA metabolites in mouse serum.
| Symbol | RT (min) | Observed m/z | Formula | Mass Error (ppm) | Identity |
|---|---|---|---|---|---|
| I | 2.15 | 190.0582 | C6H12N3PS [H+] | 7.3 | ThioTEPA |
| II | 1.51 | 174.0801 | C6H12N3OP [H+] | 2.8 | TEPA |
| III | 1.56 | 210.0571 | C6H13ClN3OP [H+] | 3.8 | MonochloroTEPA |
| IV | 2.19 | 353.0878 | C11H21N4O3PS2 [H+] | 1.9 | ThioTEPA-mercapturate |
| VI | 2.02 | 246.0334 | C6H14Cl2N3OP [H+] | 1.6 | 1,2,-DichloroTEPA |
| VII | 2.47 | 282.0101 | C6H15Cl3N3OP [H+] | 1.4 | 1,2,3-TrichloroTEPA |
3.4. Excretion of thioTEPA and its metabolites in urine
The absolute cumulative excretion of thioTEPA was quantitated against calibration curves constructed with authentic standard (y = 0.172x - 1.673, r > 0.999). As shown in Fig. 4A, the 24 h urinary excretion of unchanged thioTEPA was 0.27–0.51% of the total administered thioTEPA dose. Although standards of metabolites II-VIII were unavailable, their relative excretion in 24 h urine could be estimated based on their peak areas. In Fig. 4B and 4C, TEPA (II), monochloroTEPA (III), and thioTEPA-mercapturate (IV) were the major excreted metabolites in urine, while the excretion of the intermediate metabolite thioTEPA-cysteinate (V) was minor. The excretion of II, III and IV were about 10–15 fold in excess of parent compound urinary excretion, respectively. The majority of metabolites II-VIII, as well as of any unchanged thioTEPA, were excreted in the first 10 h following thioTEPA treatment.
Fig. 4.

Urinary excretion of thioTEPA and its metabolites from 0 to 24 h following the treatment of thioTEPA (n = 4). (A) Percent dose excretion of unchanged thioTEPA (I) at different time points. (B) Relative urinary excretion of thioTEPA metabolites II, III, and IV at different time points. (C) Relative urinary excretion of thioTEPA (I) and its metabolites V, VI, VII, and VIII at different time points.
The excretion of SCMC and TDGA in control and thioTEPA-treated mouse urine was quantitated against calibration curves constructed with authentic standards [y = 1.027x – 0.435, r > 0.999 (SCMC); y = 0.973x + 0.951, r > 0.999 (TDGA)] using triple quadrupole mass spectrometry. The 24 h urinary excretion of SCMC and TDGA in thioTEPA-treated mice was 0.0014 ± 0.00055 and 0.021 ± 0.0042 μmol, respectively. As seen from the Fig. 5A and 5B, SCMC and TDGA excretion were increased about 4-fold (P = 0.0067) and 2-fold (P = 0.013), respectively, in urine following thioTEPA treatment compared to control urine.
Fig. 5.

The amount for SCMC and TDGA in 24 h mice urine following the treatment of thioTEPA (50 mg/kg, approximately 1 mg of thioTEPA), CAA (2 mg/kg, approximately 0.04 mg of CAA), and SCMC (100 mg/kg, approximately 2 mg of SCMC). (A) The μmol/24 h of SCMC from control and thioTEPA-treated mice. (B) The μmol/24 h of TDGA from control and thioTEPA-treated mice. (C) The fold change of SCMC from control and CAA-treated mice. (D) The fold change of TDGA from control and CAA-treated mice. (E) The fold change of TDGA from control and SCMC-treated mice. Significant differences (P < 0.05) in control and thioTEPA-treated, CAA-treated, or SCMC-treated group.
The relative excretion of SCMC and TDGA in control, CAA-treated, and SCMC-treated mouse urine was estimated by comparing their peak areas. The value was normalized by the peak area of creatinine. As seen from Fig. 5C and 5D, compared with control mice, SCMC and TDGA excretion in urine were increased about 3-fold (P = 0.012) and 7-fold (P = 0.022), respectively, following CAA treatment. As seen in Fig. 5E, an increase in urinary excretion of TDGA was about 190-fold (P < 0.0001) following SCMC treatment compared with control group.
3.5. Pharmacokinetics of thioTEPA and its metabolites in serum
The pharmacokinetic profile of thioTEPA (I) in mouse serum was determined for up to 10 hours post-dose (Fig. 6A). The terminal elimination half life was 38.6 ± 1.7 min, suggesting that thioTEPA is quickly cleared from mouse serum, which is similar to its elimination in humans [14]. In addition, the relative peak area-time profiles of thioTEPA metabolites (II, III, IV, VI and VII) were delineated (Fig. 6B). These metabolites could first be detected at 15 min following parent drug administration, and achieved maximal concentrations (Cmax) at approximately 1 h post-dose. Most of the parent thioTEPA and its metabolites were eliminated from mouse serum within the observation period of 10 h, consistent with the observed urinary excretion profile.
Fig. 6.

The concentration-time profiles of thioTEPA and its metabolites in serum after intraperitoneal administration at 50 mg/kg of thioTEPA (approximately 1 mg of drug) in mice (n = 4). (A) Pharmacokinetic process of thioTEPA (I) in mouse (from 0.08 to 10 h). (B) Relative peak area-time profiles of thioTEPA metabolites II, III, IV, VI, and VII in mouse (from 0.08 to 10 h).
3.6. Serum chemistry
There was a significant difference in serum amylase and glucose levels following thioTEPA and TDGA treatment. As seen in Fig. 7A–D, serum amylase was increased in thioTEPA- and TDGA-treated mice compared with the control group, while serum glucose was decreased. The other serum parameters, such as ALT and ALP, showed no significant differences.
Fig. 7.

Serum chemistry of thioTEPA- and TDGA-treated mice. (A) Serum amylase in thioTEPA treatment and control mice. (B) Serum glucose in thioTEPA treatment and control mice. (C) Serum amylase in TDGA treatment and control mice. (D) Serum glucose in TDGA treatment and control mice. Significant differences (P < 0.05) in thioTEPA or TDGA treatment and control group.
4. Discussion
Metabolomics was applied to investigate the metabolism of thioTEPA in a mouse model in vivo and in vitro. In addition to the previously known metabolites TEPA (II), monochloroTEPA (III) and thioTEPA-mercapturate (IV), one conjugated metabolite (V) from thioTEPA and three ring-opened metabolites (VI, VII and VIII) were identified in the current study. Interestingly, the ring-opened metabolites from thioTEPA showed a similar chemical structure to the alkylating agents ifosfamide and cyclophosphamide, which are widely used in the chemotherapy of various cancers. These metabolites can eliminate the chloroethyl group by N-dechloroethylation, producing such metabolites as dechloroethyltrichloroTEPA (VIII). Although CAA was not detected in the present study employing UPLC-ESI-QTOFMS, its downstream stable metabolites SCMC and TDGA were found in urine, and were quantitatively related to thioTEPA exposure. The major metabolic pathway of thioTEPA in the mouse in vivo is presented in Fig. 8. In addition, the urinary excretion of SCMC and TDGA were increased following CAA treatment (Fig. 5C and 5D). A previous study reported that TDGA was the major transformation metabolite of SCMC in humans [36]. Here, the excretion of TDGA was greatly increased in mouse urine after treatment with SCMC (Fig. 5E). These results suggested that CAA was first produced from the thioTEPA ring-opened metabolite (VII) by N-dechloroethylation, then CAA was transformed into SCMC, finally TDGA was generated from SCMC.
Fig. 8.

Major in vivo ThioTEPA metabolic pathways. Boxed structures represent novel metabolites.
In the current study only one metabolite, TEPA, was detected after incubation with mouse liver microsomes, which was consistent with a previous result [10]. The nine metabolites of thioTEPA identified in mouse urine and serum suggest that thioTEPA can be transformed in vivo by non-cytochrome P450 pathways. Here, UPLC-ESI-QTOFMS-based metabolomics was a powerful tool for the identification of ring-opened metabolites (III, VI, VII, and VIII), especially for two novel metabolites 1,2,3-tricholoroTEPA and dechloroethyltrichloroTEPA (Fig. 1A and Fig. 3E–F). As seen in Fig. 2E–F and Fig. 4C, two novel metabolites, VII and VIII, show relatively low concentration in urine. This result emphasizes the value and sensitivity of UPLCESI-QTOFMS-based metabolomics for the identification of minor drug metabolites with potentially important function in vivo. Previous studies [13, 35, 37] indicate that thioTEPA and TEPA can be degraded and generate chloro adducts in the presence of sodium chloride. Indeed, mono-, di-, and tri-chloro adducts of TEPA were identified in mouse urine and serum, while the corresponding chloro adducts of thioTEPA were not detected, potentially reflecting differences in the stability and chemical reactivity of thioTEPA and TEPA in vivo. It was proposed that thioTEPA-mercapturate is generated from thioTEPA through the intermediate metabolites monoglutathionylthioTEPA and thioTEPA-cysteinate [8]. In this study, thioTEPA-cysteinate was detected in mouse urine thus confirming that thioTEPA-mercapturate was formed from thioTEPA by two intermediate metabolites in vivo.
Because thioTEPA bears three aziridines rings, the MS/MS fragmentation of thioTEPA and its alkylating metabolites share similar characteristics, which were helpful to elucidate their chemical structures by mass spectrometry. The elimination of aziridine and chloroethylamine moieties, corresponding to the loss of m/z 43 and 80, respectively, was found to be a common reaction scheme. As seen from the MS spectra of thioTEPA and its metabolites (Fig. 3A–F), the MS/MS fragmentation of these compounds can be explained with the elimination of aziridine, chloroethylamine, or both. Another interesting observation was that several metabolites containing the chloro adduct were generated. MS spectra of those metabolites show isotope peaks M+2, M+4 or M+6, reflecting their possession of the chlorine associated stable isotopes 35Cl and 37Cl.
ThioTEPA metabolites could first be detected in serum at 15 min post-dose in thioTEPA-treated mice, and serum concentrations were highest at 1 h. Seen in conjunction with the almost complete urinary excretion of the analytes over the 10 h observation period, the data suggest rapid renal clearance from the serum. ThioTEPA and all metabolites observed in this study reach the limit of detection in serum by 10 h post-dose, which may suggest similar serum clearance kinetics of metabolites and thioTEPA. The half-life of thioTEPA in the mouse was 38.6 ± 1.7 min, which is similar to a previous report [14]. This study also reported that TEPA can persist longer in the serum than thioTEPA, which was different from the present results (t1/2 similar to that of thioTEPA) [14]. This difference may be due to the physiological or non-cytochrome P450 mediated species differences between humans and mice.
Previous studies reported that SCMC can activate the α-amino-3-hydroxy-5-methyl-4-isoxazolepropionic acid/kainate receptor and induce cellular acidification, and that TDGA can cause mitochondrial dysfunction [23–24]. Based on the known effects, it was proposed that increased serum concentrations of SCMC and TDGA following ifosfamide therapy may be responsible for ifosfamide-induced encephalopathy. In the present study, an increase of SCMC and TDGA was observed in thioTEPA-treated mice, suggesting a pathway for the generation of SCMC and TDGA from thioTEPA (Fig. 8). Interestingly, the generation of SCMC and TDGA from thioTEPA appears similar to that known for ifosfamide, which also undergoes N-dechloroethylation reactions. Clinical studies reported that patients developed serious encephalopathy following the administration of high dose thioTEPA [38]. Serum chemistry revealed that thioTEPA treatment can cause an increase in serum amylase and a decrease of glucose (Fig. 7A–B). As is known, increased serum amylase is an indicator of pancreatitis. Several cases in the clinic reported that encephalopathy can be observed in patients with pancreatitis [39–40]. The decrease of serum glucose suggested there was accelerated glucose metabolism in vivo, which could result in the consumption of thiamine [41–42]. It has been reported that thiamine deficiency is also another major cause of encephalopathy [43–44]. Interestingly, supplementation of thiamine can improve ifosfamide-induced encephalopathy in the clinic [45]. Interestingly, TDGA treatment also caused an increase of amylase and decrease of glucose in serum (Fig. 7C–D), while SCMC treatment showed no significant differences for serum amylase and glucose in SCMC-treated and control mice (data no shown). It suggested the increased TDGA in thioTEPA treatment might be responsible for high-dose thioTEPA induced-encephalopathy. Therefore, further studies are needed to examine the toxicity mechanism of TDGA in relation to drug induced-encephalopathy.
As mentioned previously, thioTEPA is an alkylating agent and may form cross-links with DNA. It was reported that its metabolites TEPA, monochloroTEPA, and thioTEPA-mercapturate also possess alkylating activity [8]. 1,2-DichloroTEPA, 1,2,3-trichloroTEPA, and dechloroethyltrichloroTEPA were produced from thioTEPA by ring-opening of aziridine and the generation of the chloro adduct, suggesting that these metabolites might also have alkylating activity. ThioTEPA-mercapturate and thioTEPA-cysteinate, the conjugation metabolites of thioTEPA, might retain the alkylating activity of parent [8]. As seen from Fig. 4B and 4C, TEPA, monochloroTEPA, and thioTEPA-mercapturate were the major metabolites in vivo, while 1,2-dichloroTEPA, 1,2,3-trichloroTEPA, dechloroethyltrichloroTEPA, and thioTEPA-cysteinate were minor metabolites. It is estimated from these results that the total urinary combined excretion of TEPA, monochloroTEPA, and thioTEPA was about 40-fold greater than the excretion of thioTEPA (Fig. 4B and 4C), which is consistent with previous reports [16]. The combined total excreted amounts of thioTEPA, TEPA, monochloroTEPA, and thioTEPA-mercapturate accounts for 74% of the total alkylating activity [8]. The present study indicates that the sum of alkylating activity of thioTEPA and its metabolites may account for about 90% of the total administered alkylating activity. Therefore, theoretically, in addition to the metabolites identified in this study, additional metabolites may be formed in vivo. However, the discrepancy of 10% may at least in part reflect the loss of alkylating activity incurred if drug or metabolites interact with biomolecules such as DNA.
In summary, the metabolism of thioTEPA was comprehensively investigated in mice using a metabolomic approach. Nine metabolites in urine and five metabolites in serum, including two novel drug metabolites, were determined by this method. The generation of SCMC and TDGA from thioTEPA can be explained by the metabolic pathway proposed in this study. The in vivo transformation and serum/urine disposition of thioTEPA and its metabolites were systematically profiled in mice following a single i.p. application of thioTEPA at doses in line with previous work. Further studies are needed to investigate the toxicity mechanism of TDGA to aid in the clarification of high dose thioTEPA induced-encephalopathy.
Acknowledgment
This work was supported in part by the Intramural Research Program of the Center for Cancer Research, National Cancer Institute, National Institutes of Health.
Footnotes
Publisher's Disclaimer: This is a PDF file of an unedited manuscript that has been accepted for publication. As a service to our customers we are providing this early version of the manuscript. The manuscript will undergo copyediting, typesetting, and review of the resulting proof before it is published in its final citable form. Please note that during the production process errors may be discovered which could affect the content, and all legal disclaimers that apply to the journal pertain.
References
- [1].Watson GW, Turner RL. Breast cancer; a new approach to therapy. Br Med J 1959;1:1315–20. [DOI] [PMC free article] [PubMed] [Google Scholar]
- [2].Lyons AR, Edelstyn GA. Thiotepa in the treatment of advanced breast cancer. Br J Cancer 1965;19:490–5. [DOI] [PMC free article] [PubMed] [Google Scholar]
- [3].Andrievsky GV, Sukhodub LF, Pyatigorskaya TL, Boryak OA, Limanskaya O, Shelkovsky VS. Direct observation of the alkylation products of deoxyguanosine and DNA by fast atom bombardment mass spectrometry. Biol Mass Spectrom 1991;20:665–8. [DOI] [PubMed] [Google Scholar]
- [4].Musser SM, Pan SS, Callery PS. Liquid chromatography-thermospray mass spectrometry of DNA adducts formed with mitomycin C, porfiromycin and thiotepa. J Chromatogr 1989;474:197–207. [DOI] [PubMed] [Google Scholar]
- [5].Teicher BA, Holden SA, Cucchi CA, Cathcart KN, Korbut TT, Flatow JL, et al. Combination of N,N’,N”-triethylenethiophosphoramide and cyclophosphamide in vitro and in vivo. Cancer Res 1988;48:94–100. [PubMed] [Google Scholar]
- [6].Cohen NA, Egorin MJ, Snyder SW, Ashar B, Wietharn BE, Pan SS, et al. Interaction of N,N’,N”-triethylenethiophosphoramide and N,N’,N”-triethylenephosphoramide with cellular DNA. Cancer Res 1991;51:4360–6. [PubMed] [Google Scholar]
- [7].Musser SM, Pan SS, Egorin MJ, Kyle DJ, Callery PS. Alkylation of DNA with aziridine produced during the hydrolysis of N,N’,N”-triethylenethiophosphoramide. Chem Res Toxicol 1992;5:95–9. [DOI] [PubMed] [Google Scholar]
- [8].van Maanen MJ, Tijhof IM, Damen JM, Versluis C, van den Bosch JJ, Heck AJ, et al. A search for new metabolites of N,N’,N”-triethylenethiophosphoramide. Cancer Res 1999;59:4720–4. [PubMed] [Google Scholar]
- [9].Dirven HA, Dictus EL, Broeders NL, van Ommen B, van Bladeren PJ. The role of human glutathione S-transferase isoenzymes in the formation of glutathione conjugates of the alkylating cytostatic drug thiotepa. Cancer Res 1995;55:1701–6. [PubMed] [Google Scholar]
- [10].Ng SF, Waxman DJ. Biotransformation of N,N’,N”-triethylenethiophosphoramide: oxidative desulfuration to yield N,N’,N”-triethylenephosphoramide associated with suicide inactivation of a phenobarbital-inducible hepatic P-450 monooxygenase. Cancer Res 1990;50:464–71. [PubMed] [Google Scholar]
- [11].Ng SF, Waxman DJ. N,N’,N”-triethylenethiophosphoramide (thio-TEPA) oxygenation by constitutive hepatic P450 enzymes and modulation of drug metabolism and clearance in vivo by P450-inducing agents. Cancer Res 1991;51:2340–5. [PubMed] [Google Scholar]
- [12].Jacobson PA, Green K, Birnbaum A, Remmel RP. Cytochrome P450 isozymes 3A4 and 2B6 are involved in the in vitro human metabolism of thiotepa to TEPA. Cancer Chemother Pharmacol 2002;49:461–7. [DOI] [PubMed] [Google Scholar]
- [13].Cohen BE, Egorin MJ, Nayar MS, Gutierrez PL. Effects of pH and temperature on the stability and decomposition of N,N’N”-triethylenethiophosphoramide in urine and buffer. Cancer Res 1984;44:4312–6. [PubMed] [Google Scholar]
- [14].O’Dwyer PJ, LaCreta F, Engstrom PF, Peter R, Tartaglia L, Cole D, et al. Phase I/pharmacokinetic reevaluation of thioTEPA. Cancer Res 1991;51:3171–6. [PubMed] [Google Scholar]
- [15].Maanen MJ, Smeets CJ, Beijnen JH. Chemistry, pharmacology and pharmacokinetics of N,N’,N” -triethylenethiophosphoramide (ThioTEPA). Cancer Treat Rev 2000;26:257–68. [DOI] [PubMed] [Google Scholar]
- [16].van Maanen MJ, Huitema AD, Rodenhuis S, Beijnen JH. Urinary excretion of thioTEPA and its metabolites in patients treated with high-dose cyclophosphamide, thioTEPA and carboplatin. Anticancer Drugs 2001;12:519–24. [DOI] [PubMed] [Google Scholar]
- [17].Cohen BE, Egorin MJ, Kohlhepp EA, Aisner J, Gutierrez PL. Human plasma pharmacokinetics and urinary excretion of thiotepa and its metabolites. Cancer Treat Rep 1986;70:859–64. [PubMed] [Google Scholar]
- [18].Hagen B, Neverdal G, Walstad RA, Nilsen OG. Long-term pharmacokinetics of thio-TEPA, TEPA and total alkylating activity following i.v. bolus administration of thio-TEPA in ovarian cancer patients. Cancer Chemother Pharmacol 1990;25:257–62. [DOI] [PubMed] [Google Scholar]
- [19].Papadopoulos KP, Garvin JH, Fetell M, Vahdat LT, Garrett TJ, Savage DG, et al. High-dose thiotepa and etoposide-based regimens with autologous hematopoietic support for high-risk or recurrent CNS tumors in children and adults. Bone Marrow Transplant 1998;22:661–7. [DOI] [PubMed] [Google Scholar]
- [20].Vahdat L, Raptis G, Fennelly D, Hamilton N, Reich L, Tiersten A, et al. Rapidly cycled courses of high-dose alkylating agents supported by filgrastim and peripheral blood progenitor cells in patients with metastatic breast cancer. Clin Cancer Res 1995;1:1267–73. [PubMed] [Google Scholar]
- [21].Wolff SN, Herzig RH, Fay JW, LeMaistre CF, Brown RA, Frei-Lahr D, et al. High-dose N,N’,N”-triethylenethiophosphoramide (thiotepa) with autologous bone marrow transplantation: phase I studies. Semin Oncol 1990;17:2–6. [PubMed] [Google Scholar]
- [22].Visarius TM, Bahler H, Küpfer A, Cerny T, Lauterburg BH. Thiodiglycolic acid is excreted by humans receiving ifosfamide and inhibits mitochondrial function in rats. Drug Metab Dispos 1998;26:193–6. [PubMed] [Google Scholar]
- [23].Chatton JY, Idle JR, Vågbø CB, Magistretti PJ. Insights into the mechanisms of ifosfamide encephalopathy: drug metabolites have agonistic effects on alpha-amino-3-hydroxy-5-methyl-4-isoxazolepropionic acid (AMPA)/kainate receptors and induce cellular acidification in mouse cortical neurons. J Pharmacol Exp Ther 2001;299:1161–8. [PubMed] [Google Scholar]
- [24].Lerch S, Küpfer A, Idle JR, Lauterburg BH. Cerebral formation in situ of S-carboxymethylcysteine after ifosfamide administration to mice: a further clue to the mechanism of ifosfamide encephalopathy. Toxicol Lett 2006;161:188–94. [DOI] [PubMed] [Google Scholar]
- [25].Höfer CC. The metabolism and potential toxicity mechanisms of thiotepa. PhD Thesis University of Newcastle upon Tyne, Newcastle, UK 1995.
- [26].Vågbø CB, Hadidi H, Idle JR. Thiodiglycolic acid - a novel endogenous urinary metabolite in humans. Abstract, 34th Norwegian Biochemical Society Contact Meeting, Lillehammer 1998:23. [Google Scholar]
- [27].Nicholson JK, Wilson ID. Opinion: understanding ‘global’ systems biology: metabonomics and the continuum of metabolism. Nat Rev Drug Discov 2003;2:668–76. [DOI] [PubMed] [Google Scholar]
- [28].Idle JR, Gonzalez FJ. Metabolomics. Cell Metab 2007;6:348–51. [DOI] [PMC free article] [PubMed] [Google Scholar]
- [29].Patterson AD, Gonzalez FJ, Idle JR. Xenobiotic metabolism: a view through the metabolometer. Chem Res Toxicol 2010;23:851–60. [DOI] [PMC free article] [PubMed] [Google Scholar]
- [30].Chen C, Krausz KW, Idle JR, Gonzalez FJ. Identification of novel toxicity-associated metabolites by metabolomics and mass isotopomer analysis of acetaminophen metabolism in wild-type and Cyp2e1-null mice. J Biol Chem 2008;283:4543–59. [DOI] [PMC free article] [PubMed] [Google Scholar]
- [31].Ma X, Chen C, Krausz KW, Idle JR, Gonzalez FJ. A metabolomic perspective of melatonin metabolism in the mouse. Endocrinology 2008;149:1869–79. [DOI] [PMC free article] [PubMed] [Google Scholar]
- [32].Giri S, Idle JR, Chen C, Zabriskie TM, Krausz KW, Gonzalez FJ. A metabolomic approach to the metabolism of the areca nut alkaloids arecoline and arecaidine in the mouse. Chem Res Toxicol 2006;19:818–27. [DOI] [PMC free article] [PubMed] [Google Scholar]
- [33].Li F, Patterson AD, Höfer CC, Krausz KW, Gonzalez FJ, Idle JR. Comparative metabolism of cyclophosphamide and ifosfamide in the mouse using UPLC-ESIQTOFMS-based metabolomics. Biochem Pharmacol 2010;80:1063–74. [DOI] [PMC free article] [PubMed] [Google Scholar]
- [34].Yu AM, Idle JR, Byrd LG, Krausz KW, Küpfer A, Gonzalez FJ. Regeneration of serotonin from 5-methoxytryptamine by polymorphic human CYP2D6. Pharmacogenetics 2003;13:173–81. [DOI] [PubMed] [Google Scholar]
- [35].van Maanen RJ, Tijhof IM, Damen JM, Zwikker JW, Beijnen JH. The degradation of N,N’,N”-triethylenephosphoramide in aqueous solutions: a qualitative and kinetic study. Int J Pharm 2000;196:85–94. [DOI] [PubMed] [Google Scholar]
- [36].Hofmann U, Eichelbaum M, Seefried S, Meese CO. Identification of thiodiglycolic acid, thiodiglycolic acid sulfoxide, and (3-carboxymethylthio)lactic acid as major human biotransformation products of S-carboxymethyl-L-cysteine. Drug Metab Dispos 1991;19:222–6. [PubMed] [Google Scholar]
- [37].van Maanen MJ, Brandt AC, Damen JM, Beijnen JH. Degradation study of thiotepa in aqueous solutions. Int J Pharm 1999;179:55–64. [DOI] [PubMed] [Google Scholar]
- [38].van den Berkmortel F, Gidding C, De Kanter M, Punt CJ. Severe encephalopathy after high-dose chemotherapy with autologous stem cell support for brain tumours. Anticancer Res 2006;26:729–33. [PubMed] [Google Scholar]
- [39].Sun GH, Yang YS, Liu QS, Cheng LF, Huang XS. Pancreatic encephalopathy and Wernicke encephalopathy in association with acute pancreatitis: a clinical study. World J Gastroenterol 2006;12:4224–7. [DOI] [PMC free article] [PubMed] [Google Scholar]
- [40].Zangheri E, Pigna A, Amanti E, D’Alessandro R, Bova F, Melotti RM, et al. Wernicke’s encephalopathy and pancreatic encephalopathy after necrotic-hemorrhagic pancreatitis. A case report. Minerva Anestesiol 2009;75:401–4. [PubMed] [Google Scholar]
- [41].Beltramo E, Berrone E, Tarallo S, Porta M. Effects of thiamine and benfotiamine on intracellular glucose metabolism and relevance in the prevention of diabetic complications. Acta Diabetol 2008;45:131–41. [DOI] [PubMed] [Google Scholar]
- [42].Jankowska-Kulawy A, Bielarczyk H, Pawelczyk T, Wroblewska M, Szutowicz A. Acetyl-CoA deficit in brain mitochondria in experimental thiamine deficiency encephalopathy. Neurochem Int 2010;57:851–6. [DOI] [PubMed] [Google Scholar]
- [43].McCandless DW, Schenker S, Cook M. Encephalopathy of thiamine deficieny: studies of intracerebral mechanisms. J Clin Invest 1968;47:2268–80. [DOI] [PMC free article] [PubMed] [Google Scholar]
- [44].Ookawara S, Suzuki M, Saitou M. [Acute encephalopathy due to thiamine deficiency with hyperammonemia in a chronic hemodialysis patient: a case report]. Nippon Jinzo Gakkai Shi 2003;45:393–7. [PubMed] [Google Scholar]
- [45].Hamadani M, Awan F. Role of thiamine in managing ifosfamide-induced encephalopathy. J Oncol Pharm Pract 2006;12:237–9. [DOI] [PubMed] [Google Scholar]