Abstract
Objective:
To assess whether alcohol consumption decreases during an intensive lifestyle intervention (ILI) and whether alcohol consumption is associated with weight loss among participants with overweight/obesity and type 2 diabetes.
Methods:
Participants (n=4,901) were from the Action for Health in Diabetes (Look AHEAD) study, an RCT that compared an ILI to a diabetes support and education (DSE) control. Mixed effects models were used to estimate the effect of the ILI on alcohol consumption, and the influence of alcohol consumption on weight loss at year 4.
Results:
ILI and DSE participants did not differ in changes in alcohol consumption. Alcohol intake was not associated with weight loss at year 1 of the ILI. ILI participants who abstained from alcohol lost 5.1±0.3% of initial weight at year 4, compared to a significantly (p=0.04) smaller 2.4±1.3% for consistent-heavy drinkers. ILI participants who abstained from alcohol consumption over the 4 years lost 1.6±0.5% more weight relative to individuals who drank alcohol at any time during the intervention (p=0.003). DSE participants did not differ in weight loss by alcohol consumption.
Conclusions:
Heavy alcohol drinkers are at risk for suboptimal long-term weight loss. Decreasing alcohol consumption may improve weight management among individuals with diabetes.
Keywords: Alcohol, obesity, weight loss, type 2 diabetes, treatment
Introduction
Alcoholic beverages are a top contributors of calories in Americans’ diets.1 The percent of people who consume alcohol has increased since the early 2000s.2,3 Over 70% of Americans report consuming alcohol at least once a year.2,3 The per capita intake from alcoholic beverages is 109 kcals/day.4 A meta-analysis of prospective observational studies demonstrated that relative to individuals who drank minimal alcohol, light-to-moderate alcohol consumption was associated with a lower risk of type 2 diabetes.5
However, alcohol is energy dense, containing 7.1 kcals/gram and may be an important factor related to weight. Alcohol is inefficient in facilitating satiety, and calories from alcohol usually add, rather than substitute, for energy ingested through other dietary sources.6,7 Consumption of alcohol is linked to disinhibited eating8 and increased food intake,9,10 possibly through neural mechanisms related to energy regulation.8,11 Some studies have supported a relationship between increased alcohol consumption and higher body weight,12–16 while others have suggested an inverse relation17 or no association.7,18–20 Possible reasons for these discrepancies include the use of self-reported height and weight, variable (and often short) follow-up, and inconsistent control for confounders such as smoking status.
Though the association between alcohol consumption and body weight is unclear, decreasing or eliminating calories from alcohol is typically recommended during weight loss. Despite the potential benefits of reducing alcohol consumption on weight management, few studies have examined whether participants report changes in alcohol intake during weight loss treatment21–23 and whether alcohol influences weight loss. One study demonstrated no change in alcohol intake during a lifestyle intervention23 while another showed decreased intake at the end of treatment.22 Alcohol intake was not related to weight change, but was associated with change in end-of-treatment energy intake.22 Research is needed to assess changes in alcohol consumption during weight loss, and the effect of alcohol on weight management.
The present study used data from the Action for Health in Diabetes (Look AHEAD) study to address these questions. Look AHEAD is a 16-center randomized clinical trial that compared the effects of an intensive lifestyle intervention (ILI) to a diabetes support and education (DSE) control group on the incidence of major cardiovascular events.24 The aims of this study were to: 1) assess the effect of the ILI on alcohol consumption over 4 years; and 2) examine whether 4-year weight loss outcomes were related to alcohol consumption over this time. We hypothesized that the ILI, as compared to the DSE, would have greater declines in alcohol consumption from baseline to year 4. We also hypothesized that in the ILI, individuals who reported greater alcohol consumption would lose less weight than those with lower alcohol consumption over the 4 years.
Methods
Participants
As reported previously, 5,145 participants were recruited from across the U.S.25 Individuals had type 2 diabetes, were 45–76 years of age, and had a body mass index (BMI) ≥25 kg/m2 (or ≥27 kg/m2 if on insulin). The current study used the Look AHEAD public access data set, a subset of 4,901 participants from the cohort; participants from the Native American sites were not included due to consent limitations.
Interventions
Details about the study interventions have been published previously.26 In brief, participants were randomly assigned to ILI or DSE.26,27 The ILI consisted of individual and group sessions focused on improving diet and physical activity. Participants were prescribed a calorie goal of 1200–1800 kcal/day (based on weight) and a physical activity goal of ≥175 minutes/week of moderate-intensity activity. The ILI group was told about the number of calories in alcohol, advised to decrease their alcohol consumption as a means of reducing caloric intake, and told that dietary guidelines recommended no more than two drinks per day for men and no more than one drink per day for women. Participants in DSE were invited to three group sessions each year focused on diet, physical activity, or social support.
Assessments
Assessments were completed by certified staff members masked to intervention assignment.
Demographic and clinical characteristics.
Self-report forms were used to collect demographic and health data. Weight and height were measured in duplicate following standardized procedures.25 Glycated hemoglobin level was measured annually.
Alcohol.
Alcohol consumption was assessed yearly using a self-report questionnaire that asked similar questions as those recommended by the National Institute on Alcohol Abuse and Alcoholism’s (NIAAA).28 Participants were asked “Did you drink any alcoholic beverages in the past year?” and follow-up questions to assess the number of drinks of wine, beer, and liquor typically consumed each week. One drink was considered a 5-ounce glass of wine, 12-ounce glass, can or bottle of beer, or 1.5 ounces of liquor. Responses were totaled to generate a score for number of drinks per week.
Dietary intake.
Dietary intake was measured on 50% of participants at each clinical site using a self-administered 134-line item food frequency questionnaire that assessed typical consumption during the past 6 months. Calories from alcohol were computed based on daily grams of alcohol consumed per day multiplied by 7.1 kcals/gram.
Physical activity.
Physical activity was assessed using the Paffenbarger Activity Questionnaire (PAQ),29 which provides an estimate of weekly energy expenditure from moderate intensity physical activity. Participants at eight centers completed the questionnaire at baseline, and years 1 and 4.
Depressive symptoms and quality of life.
The Beck Depression Inventory (BDI-1A) was used to assess depressive symptoms over the previous 2 weeks.30 The 36-item Short-Form Health Survey was used to assess physical and mental health-related quality of life.31
Definition of Alcohol Groups
Baseline.
NIAAA’s drinking categories guided classification of baseline alcohol intake, based on the average quantity of alcohol consumed per week.32 Categories were: 1) non-drinkers (no drinking at baseline); 2) light drinking (<7 drinks/week for men and <4 drinks/week for women); 3) moderate drinking (7–14 drinks/week for men and 4–7 drinks/week for women); and 4) heavy drinking (>14 drinks/week for men and >7 drinks/week for women).
Year 1.
To describe longitudinal drinking patterns at 1 year, we created categories based on the baseline and year-1 reports of drinking in the past year (yes/no) and the average quantity of alcohol consumed per week. The groups were: 1) those who were abstinent at both times; 2) participants who drank at baseline only; 3) those who endorsed drinking at year 1 only; 4) individuals who drank at both baseline and year 1 averaging to a light amount (<7 drinks/week for men and <4 drinks/week for women); 5) those who drank at both times averaging to a moderate amount (7–14 drinks/week for men and 4–7 drinks/week for women); and 6) participants who drank at both times averaging to a heavy amount (>14 drinks/week for men and >7 drinks/week for women).
Year 4.
At year 4, groups were formed in a similar manner as in year 1. The groups were: 1) those who were abstinent at every survey (abstainers); 2) those who reported drinking at some years between baseline to 4 years (inconsistent drinkers); 3) those who drank at every year they were surveyed, averaging to a light amount (consistent-light); 4) those who reported drinking at every year surveyed, averaging to a moderate amount (consistent-moderate); and 5) those who drank at every year surveyed, averaging to a heavy amount (consistent-heavy). To be included, participants had to complete the alcohol survey at three or more timepoints.
Statistical Analyses
Baseline characteristics were compared by baseline alcohol group using ANOVAs and chi-squared tests. We estimated the effect of the ILI (vs DSE) on total alcohol consumption using linear mixed models, with the change from baseline to year 4 in drinks consumed per week as the main outcome. Models were estimated including all participants and repeated including only participants who endorsed drinking alcohol at baseline. We conducted post-hoc analyses examining changes from baseline to year 1, changes in wine, beer, and liquor consumption, and changes based on baseline alcohol consumption and year-4 alcohol consumption groups. We tested an interaction term for gender and change in alcohol consumption and repeated analyses stratified by gender.
The co-primary outcome compared 4-year percentage change in baseline weight based on the trajectory of alcohol consumption across 4 years. Models were analyzed stratified by treatment using a piecewise, linear mixed-effects model with a breakpoint at year 1. Models were adjusted for baseline demographic and clinical differences among alcohol consumption groups. Similar analyses were conducted to examine changes during the first year, when the intervention was most intensive and weight losses were the largest, using the year-1 alcohol groups.
Participants were compared based on alcohol trajectory and categorical weight losses at year 4 (e.g., ≥10% loss) using chi-squared tests. Exploratory analyses were conducted to estimate changes in self-reported dietary intake and physical activity based on 4-year alcohol trajectory. Analyses were performed using SPSS v.25 with a type I error rate of 0.05.
Results
Baseline Differences Based on Baseline Alcohol Consumption
At baseline, 38.1% of the cohort reported not drinking alcohol in the past year, 53.8% reported light drinking, 6.3% reported moderate drinking, and 1.7% reported heavy drinking. Characteristics of participants by baseline alcohol consumption are presented in Table 1.
Table 1.
Demographic and clinical characteristics by baseline alcohol use
| None | Light | Moderate | Heavy | P-value | ||
|---|---|---|---|---|---|---|
| Participants | 1867 (38.1) | 2637 (53.8) | 309 (6.3) | 82 (1.7) | ||
| Total/week | 0a | 1.09 (1.6)b | 8.1 (3.0)c | 16.2 (8.8)d | <0.001 | |
| Beers/week | 0a | 0.3 (0.9)b | 2.7 (3.5)c | 4.6 (9.3)d | <0.001 | |
| Wine/week | 0a | 0.5 (0.9)b | 3.3 (3.4)c | 6.7 (5.7)d | <0.001 | |
| Liquor/week | 0a | 0.2 (0.7)b | 2.1 (3.0)c | 4.9 (5.4)d | <0.001 | |
| Age, y | 59.3 (6.8)a | 58.6 (6.7)b,c | 59.6 (6.9)a,b | 60.5 (7.4)a,b | <0.001 | |
| Sex | ||||||
| Male | 571 (30.6)a | 1221 (46.3)b | 198 (64.1 )c | 39 (47.6)b | <0.001 | |
| Female | 1296 (69.4)a | 1416 (53.7)b | 111 (35.9)c | 43 (52.4)b | ||
| Race/ethnicity | ||||||
| White | 1067 (57.2)a | 1887 (71.6)b | 229 (74.1)b | 61 (74.4)b | <0.001 | |
| Hispanic | 368 (19.7)a | 273 (10.4)b | 30 (9.7)b | 5 (6.1)b | ||
| African American/Black | 364 (19.5)a | 385 (14.6)b | 39 (12.6)b | 13 (15.9)a,b | ||
| Other/Mixed | 68 (3.6)a | 92 (3.5)a | 11 (3.6)a | 3 (3.7)a | ||
| Education | ||||||
| <13 y | 512 (27.4)a | 358 (13.6)b | 40 (12.9)b | 14 (17.1 )b | <0.001 | |
| 13–16 y | 728 (39.0)a | 967 (36.7)a | 78 (25.2)b | 25 (30.5)a,b | ||
| >16 y | 588 (31.5)a | 1256 (47.6)b | 185 (59.9)c | 41 (50.0)b,c | ||
| Married | 1201 (64.4) | 1747 (66.2) | 222 (71.8) | 54 (65.9) | 0.07 | |
| Smoking status | ||||||
| Never | 1067 (57.2)a | 1231 (46.7)b | 100 (32.4)c | 25 (30.5)c | <0.001 | |
| Past | 730 (39.1)a | 1288 (48.8)b | 189 (61.2)c | 48 (58.5)b,c | ||
| Present | 68 (3.6)a | 112 (4.2)a’b | 20 (6.5)b’c | 8 (9.8)c | ||
| Body mass index | 36.1 (5.9)a | 36.1 (5.9)a | 34.8 (5.7)b | 33.2 (4.0)b | <0.001 | |
| Glycated hemoglobin level, % | 7.3 (1.1)a | 7.3 (1.2)a | 7.0 (1.0)b | 7.3 (1.2)a,b | <0.001 | |
| Daily caloric intake, kcal1 | 1907.3 | 2017.4 | 2119.2 | 2396.9 | <0.001 | |
| (933.8)a | (825.1)b | (842.1)b,c | (1040.4)c | |||
| Daily caloric intake from alcohol1,2 | 0 (0)a | 12.7 (25.0)b | 74.8 (70.2)c | 142.7 (136.4)d | <0.001 | |
| Daily fat intake, %a | 39.8 (7.2) | 40.2 (6.8) | 39.5 (7.0) | 39.0 (6.9) | 0.34 | |
| Daily protein intake, %a | 17.3 (3.0)a | 17.2 (2.8)a | 16.8 (2.6)a,b | 15.7 (3.0)b | 0.001 | |
| Daily intake carbohydrates, %a | 44.5 (7.9)a | 43.4 (7.4)b | 41.8 (7.2)b | 41.0 (9.2)b | <0.001 | |
| Insulin use, yes | 341 (18.9)a | 359 (14.1)b,c | 30 (10.1)c | 16 (21.3)a,b | <0.001 | |
| Physical activity (kcals/week)3 | 786.0 | 850.7 | 1298.6 | 923.7 | <0.001 | |
| (1188.0)a | (1021.6)a | (1645.1)b | (1127.4)a,b | |||
| Duration of diabetes, y | 7.2 (6.7)a | 6.5 (6.3)b | 5.8 (5.3)b | 6.7 (6.8)a,b | <0.001 | |
| History of cardiovascular disease | 263 (14.1) | 367 (13.9) | 51 (16.5) | 7 (8.5) | 0.30 | |
| Depressive symptoms | 5.4 (5.0)a | 5.4 (4.8)a | 4.6 (4.3)b | 5.6 (4.8)a,b | 0.02 | |
| SF-36, Physical component score | 47.3 (8.2)a | 48.3 (7.7)b | 49.7 (7.3)c | 47.7 (8.5)a,b,c | <0.001 | |
| SF-36, Mental component score | 54.5 (8.1)a | 53.9 (8.0)a | 54.9 (6.5)a | 53.9 (8.2)a | 0.02 | |
Mean (SD) or n(%).Value with different superscript letters across columns are significantly different from one another at p<0.05. These post-hoc comparisons were only performed when the group comparison p-value was <0.05.
Completed by 50% of participants (n=2612). Includes calories from alcohol.
Calculated using grams of alcohol multiplied by 7.1 kcals/gram.
Completed by participants at 8 clinical centers (n= 2395).
Alcohol Consumption by Treatment Group
At year 4, weight data were obtained on 90.1% of the sample, and both weight and alcohol data were available for 88.6% of participants. Individuals who were moderate drinkers at baseline were more likely to complete the full 4-year assessment (weight and questionnaire data) than were those in the other alcohol categories (92.9% vs 87.5% for never drinkers, 88.8% for light drinkers, 90.2% for heavy drinkers; p=0.04).
The ILI and DSE groups did not differ by baseline alcohol consumption categorization (p=0.61). ILI and DSE participants did not differ significantly in changes from baseline to year 1 or from baseline to year 4 in total alcohol consumption or wine, beer, and liquor consumed (ps>0.05; Table 2). ILI and DSE groups did not differ in alcohol consumption (ps>0.05) when restricted to participants who drank alcohol at baseline or when stratified by baseline alcohol group (ps>0.05; Table S1) or by year-4 alcohol consumption group (ps>0.05; Table S1). Gender did not significantly interact with treatment group and change in consumption of total alcohol (p=0.60), wine (p=0.27; Table S2), beer (p=0.45), or liquor (p=0.54) at year 4. Statistical conclusions were the same at year 1.
Table 2.
Mean of baseline values and changes in weekly alcohol consumption from baseline to year 1 and baseline to year 4 for participants who were assigned to intensive lifestyle intervention program (ILI; n=2,448) or diabetes support and education (DSE; n=2,453)
| All Participants | Participants who Drank Alcohol at Baseline | |||||
|---|---|---|---|---|---|---|
| Variable | ILI (n = 2,448) | DSE (n = 2,453) | p-value | ILI (n = 1,531) | DSE (n = 1,500) | p-value |
| Total alcohol | ||||||
| Baseline | 1.3±0.04 | 1.4±0.04 | 0.37 | 2.1±0.1 | 2.2±0.1 | 0.13 |
| Change to year 1 | −0.1±0.1 | +0.03±0.1 | 0.35 | −0.2±0.1 | −0.01±0.14 | 0.33 |
| Change to year 4 | +0.2±0.1 | +0.1±0.1 | 0.59 | +0.2±0.2 | +0.1±0.2 | 0.60 |
| Wine | ||||||
| Baseline | 1.0±0.03 | 1.0±0.04 | 0.28 | 1.0±0.04 | 1.1±0.04 | 0.29 |
| Change to year 1 | +0.2±0.1 | +0.2±0.1 | 0.84 | +0.2±0.1 | +0.2±0.1 | 0.93 |
| Change to year 4 | +0.3±0.1 | +0.1±0.1 | 0.25 | +0.4±0.1 | +0.2±0.1 | 0.20 |
| Beer | ||||||
| Baseline | 0.7±0.03 | 0.7±0.03 | 0.81 | 0.7±0.03 | 0.7±0.03 | 0.86 |
| Change to year 1 | −0.1±0.1 | +0.01±0.1 | 0.16 | −0.1±0.1 | +0.1±0.1 | 0.18 |
| Change to year 4 | −0.01±0.1 | −0.1±0.1 | 0.65 | +0.1±0.1 | −0.01±0.1 | 0.62 |
| Liquor | ||||||
| Baseline | 0.6±0.03 | 0.6±0.03 | 0.26 | 0.6±0.03 | 0.6±0.03 | 0.25 |
| Change to year 1 | +0.03±0.1 | +0.1±0.1 | 0.54 | +0.1±0.1 | +0.1±0.1 | 0.54 |
| Change to year 4 | +0.1±0.1 | +0.02±0.1 | 0.56 | +0.2±0.1 | +0.1±0.1 | 0.60 |
Note. Values shown are the mean ± SE for number of drinks per week.
Groups at year 1.
In the ILI and DSE groups, a similar percentage of participants were classified as abstinent from alcohol at baseline and year 1 (39.5% vs 40.5%, respectively); baseline only (12.0% vs 11.0%); and year 1 only (5.1% vs 4.3%). The groups did not differ significantly (p=0.67) in the percent of people who drank at both times who were classified as light drinkers (34.6% vs 34.5%); moderate drinkers (6.8% vs 7.4%); and heavy drinkers (2.0% vs 2.3%).
Groups at year 4.
From baseline to 4 years, ILI participants reported drinking alcohol at a mean±SD of 2.7±2.1 annual assessments, which did not differ (p=0.64) from the 2.7±2.2 timepoints reported by DSE participants. Randomization arm did not have a main effect on alcohol trajectory (p=0.16). A similar percentage of participants reported abstaining from alcohol at all annual assessments in the ILI (29.4%) and DSE groups (31.4%). ILI and DSE participants did not differ in the percentage of participants who endorsed inconsistent drinking (35.7% vs 32.1%, respectively), or those who reported consistently drinking at a light (28.4% vs 29.4%), moderate (4.6% vs 5.2%), or heavy amount (1.9% vs 2.0%).
ILI
Weight.
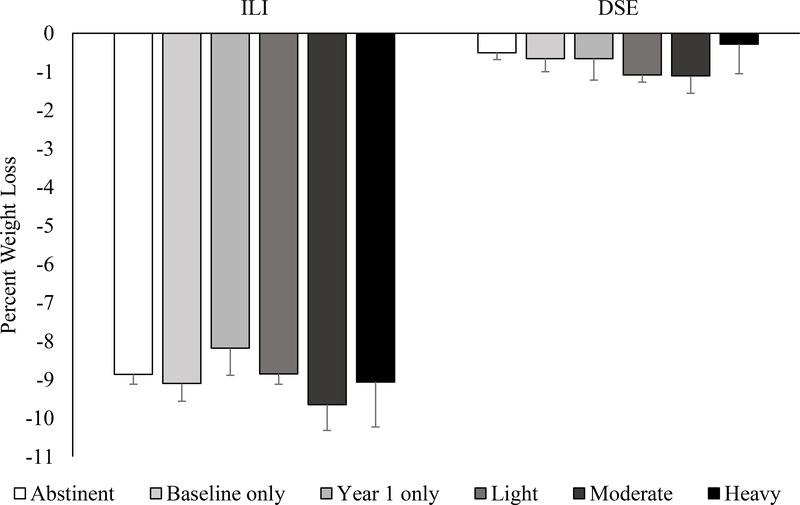
In the ILI group, alcohol consumption trajectory did not have a main effect on weight loss at year 1 (ps>0.05; Figure 1). ILI participants who abstained from alcohol lost a mean±SE of 8.9±0.3% of initial weight at year 1, which did not differ significantly (p=0.99) from the 9.1±1.2% lost by participants who drank a heavy amount. Participants who drank only at baseline lost 9.1±0.5% and those who drank only at year 1 lost 8.2±0.7%. Relative to participants who were abstinent from alcohol, participants who drank at baseline and year 1 lost a similar amount regardless if they drank a light (8.9±0.3%, p=0.29), moderate (9.7±0.7%, p=0.40), or heavy amount (p=0.99).
Figure 1.
Percent weight change at year 1 by alcohol group (abstinent; baseline only; year 1 only; individuals who drank at both baseline and year 1 averaging to a light amount (<7 drinks/week for men and <4 drinks/week for women); those who drank at both times averaging to a moderate amount (7–14 drinks/week for men and 4–7 drinks/week for women); and participants who drank at both times averaging to a heavy amount (>14 drinks/week for men and >7 drinks/week for women)). DSE=diabetes support and education. ILI=intensive lifestyle intervention.
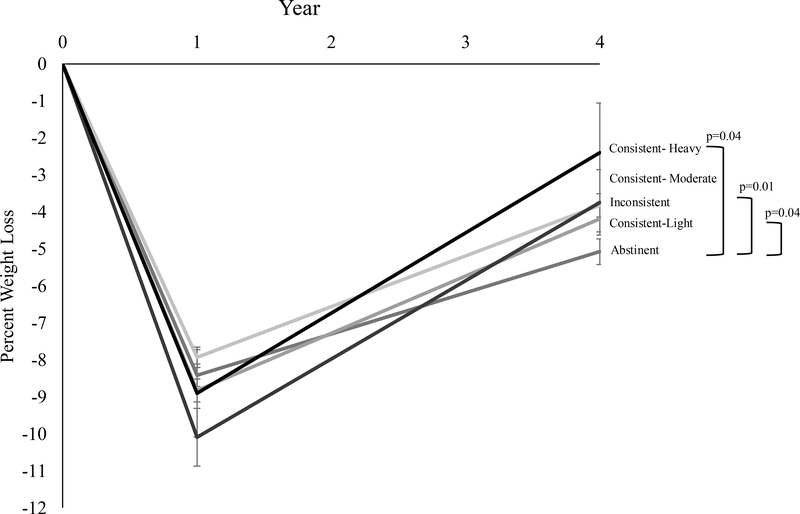
At year 4, ILI participants who abstained from alcohol consumption over the 4 years lost 1.6±0.5% more weight compared to individuals who drank alcohol at any time over the 4 years (p=0.003). ILI participants who abstained from alcohol (over the 4 years) lost 5.1±0.3% of initial weight at year 4, compared to significantly (p=0.04) smaller loss of 2.4±1.3% for participants who weres consistent-heavy drinkers (Figure 2). The weight losses of participants who were abstinent from alcohol were significantly larger than the 3.8±0.3% losses of participants who drank inconsistently (p=0.01) and 4.2±0.4% losses of those who were consistent-light drinkers (p=0.047). Participants who were consistent-moderate drinkers lost 3.7±0.9%. Weight loss for consistent-heavy drinkers was not significantly different compared to those who were inconsistent (p=0.28), consistent-light (p=0.19), or consistent-moderate drinkers (p=0.40).
Figure 2.
Percent reduction in initial weight at year 4 in the intensive lifestyle intervention group by alcohol consumption trajectory over the 4 years. Values shown are mean (± standard error), and weight losses were estimated by using linear mixed‐effects models controlling for baseline age, race/ethnicity, gender, education, smoking status, BMI, insulin use, diabetes duration, depressive symptoms, and physical and mental health-related quality of life.
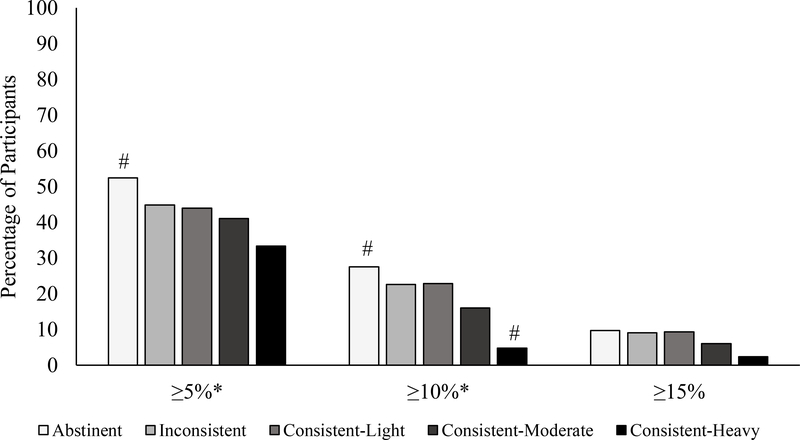
At year 4, meeting a categorical weight loss of ≥10% differed by alcohol trajectory group (p=0.002; Figure 3a). The percent of participants who achieved ≥10% weight loss was significantly higher than expected in the abstainer group (27.5%). In the consistent heavy drinker group only two participants achieved a ≥10% weight loss (4.8%). The percent of participants who achieved this weight loss was 22.6% of inconsistent drinkers, 22.9% of consistent-light drinkers, and 16.0% of consistent-moderate drinkers. Categorical weight losses differed by alcohol consumption trajectory for the achievement of a ≥5% (p=0.01) loss of initial weight. The alcohol abstainer group had 52.4% of participants who met a 5% weight loss, compared to 44% of inconsistent drinkers, 44% of consistent-light, 41% of consistent-moderate drinkers, and 33.3% of consistent-heavy drinkers.
Figure 3.
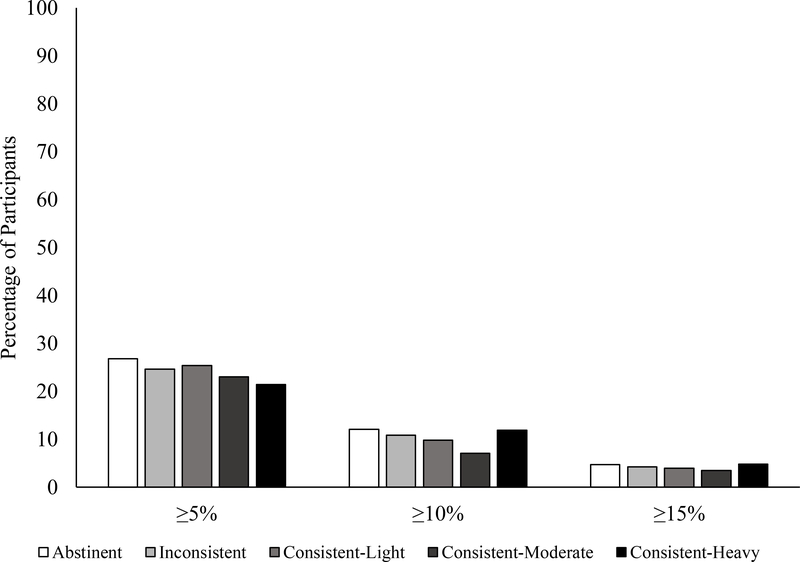
Percentage of participants in the (a) intensive lifestyle intervention and (b) diabetes support and education groups who at year 4 met different categorical weight losses based on alcohol consumption trajectories. *p<0.05. #adjusted residual is ≤1.96 or ≥1.96.
Diet.
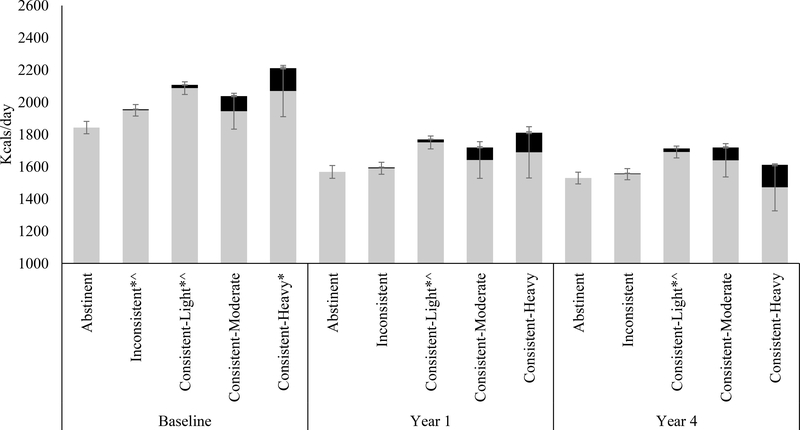
In exploratory analyses with the subgroup of participants with data from the food frequency questionnaire, each alcohol trajectory group had significant within-group declines in dietary calories from baseline to year 1 and baseline to year 4 (ps<0.05; Figure 5a). Change in dietary intake did not differ by alcohol trajectory group (ps>0.05). At year 4, relative to those who were abstinent from alcohol, inconsistent drinkers reported an additional mean±SE of 28.8±50.4 kcals/day (p=0.57), consistent-light drinkers 182.8±51.9 kcals/day (p<0.001), consistent-moderate drinkers 188.9±110.0 kcals/day (p=0.09), and consistent-heavy drinkers 81.4±150.6 kcals/day (p=0.59). At year 4, the average reported kcals/day of alcohol ingested by inconsistent drinkers was 4.7±1.4, consistent-light drinkers was 21.5±1.4, consistent-moderate drinkers was 79.4±4.0, and consistent-heavy drinkers was 139.5±5.7.
Figure 5.
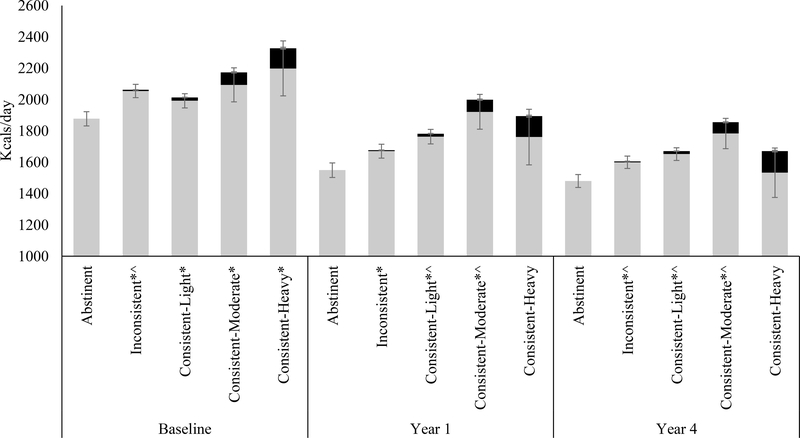
Mean self-reported daily caloric intake at baseline, and years 1 and 4 based on 4-year alcohol trajectory in the (a) intensive lifestyle intervention and (b) diabetes support and education groups. Error bars represent the standard error. Grey bars represent non-alcoholic dietary intake. Black bars represent calories from alcohol. *p<0.05 for difference relative to abstinent group in total dietary intake value at baseline, year 1, or year 4. ^p<0.05 for differences relative to abstinent group in non-alcohol dietary intake. The amount of change in total dietary intake from baseline to year 1 and baseline to year 4 did not differ significantly by alcohol trajectory group (ps>0.05). ILI: Each alcohol trajectory group had significant within-group declines in dietary intake from baseline to year 1 and baseline to year 4 (ps<0.05). DSE: Each group had significant declines dietary intake from baseline to year 1 with the exception of the consistent-moderate group which was not significant for either.
Physical activity.
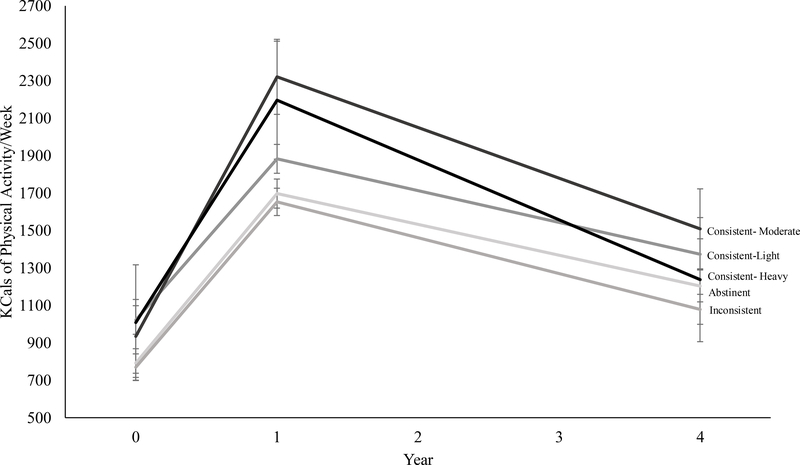
In the subgroup of participants who completed the PAQ, changes in physical activity from baseline to year 1 were significant for each group (ps<0.05; Figure 6a). Baseline to year 4 improvements in physical activity were significant for all groups except consistent-heavy drinkers (p=0.54). Changes in baseline to year 4 physical activity did not differ significantly (ps>0.05) between those who abstained from alcohol and all other groups. At year 4, the amount of physical activity reported by each of the alcohol trajectory groups did not differ (ps>0.05).
Figure 6.
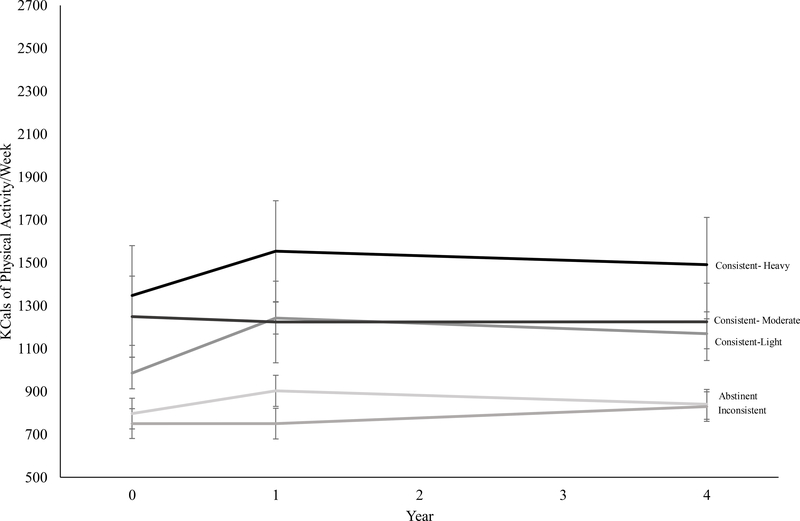
Mean self-reported kcals of physical activity per week at baseline, and years 1 and 4 based on 4-year alcohol trajectory in the (a) intensive lifestyle intervention and (b) diabetes support and education groups. ILI: Each alcohol trajectory group had significant within-group improvement in physical activity from baseline to year 1. Baseline to year 4 changes in physical activity were significant within-group for all except consistent-heavy drinkers (p=0.54). Changes in baseline to year 4 physical activity did not differ significantly (ps>0.05) between those who abstained from alcohol and all other groups. DSE: Consistent-light drinkers had a significant improvement in physical activity from baseline to year 1 (p=0.001) and baseline to year 4 (p=0.02). Compared to abstainers, the other groups did not differ significantly in change in physical activity (ps>0.05).
DSE
Weight.
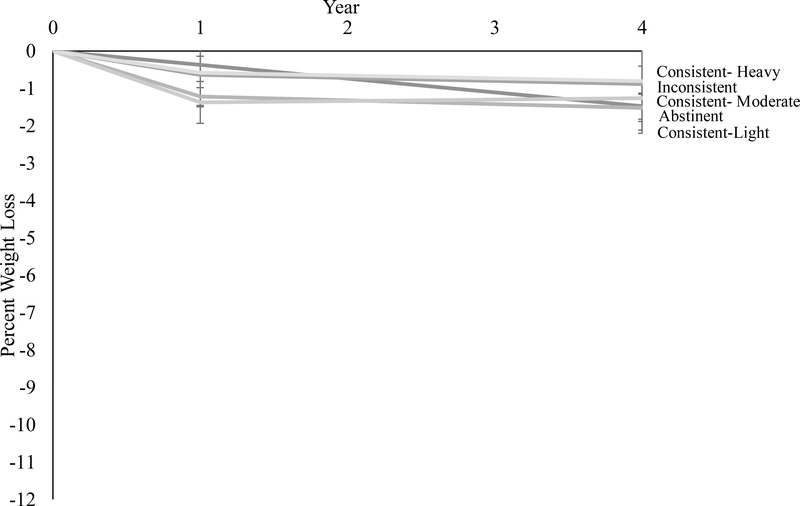
In the DSE group, participants who were abstinent from alcohol over the first year had similar weight changes as those who drank alcohol during the first year (p=0.19). Abstinent individuals in the DSE group lost 0.5±0.2% of initial body weight while participants who drank at baseline only lost 0.7±0.3% (p=0.60) and those who drank at year 1 only lost 0.7±0.6% (p=0.75; Figure 1). Compared to abstinent drinkers, light drinkers lost 1.1±0.2% (p=0.002), moderate drinkers lost 1.1±0.4% (p=0.05), and heavy drinkers lost 0.3±0.8% (p=0.75).
At year 4, participants in the DSE group who did not report drinking at any time lost 1.5±0.3% of initial weight, which was similar to the amount lost by individuals who drank at any time (p=0.48). Percent weight loss for participants who were abstinent was not significantly different from individuals in DSE who reported inconsistent (−0.9±0.3%; p=0.19), light (−1.5±0.4%; p=0.96), moderate (−1.3±0.9%; p=0.81), or heavy drinking (−0.8±1.4%; p=0.62; Figure 4). At year 4, the groups did not differ (p=0.47) in the percentage of participants who met a ≥10% weight loss. The percentages of participants who met this goal were: 12.1% of abstainers; 10.8% of inconsistent drinkers; 9.8% of consistent-light drinkers; 7.1% of consistent-moderate drinkers; and 11.9% of consistent-heavy drinkers (Figure 3b). Categorical percent weight losses did not differ by alcohol trajectory at ≥5% (p=0.82).
Figure 4.
Percent reduction in initial weight in the diabetes support and education group by alcohol consumption trajectory. Values shown are mean (± standard error), and weight losses were estimated using linear mixed‐effects models controlling for baseline age, race/ethnicity, gender, education, smoking status, BMI, insulin use, diabetes duration, depressive symptoms, and physical and mental health-related quality of life.
Diet.
At year 4, relative to DSE participants who were abstinent from alcohol, inconsistent drinkers consumed 125.4±57.4 kcals more per day (p=0.03; Figure 5b); consistent-light drinkers 190.0±58.2 kcals more per day (p=0.001); consistent-moderate drinkers 373.4±105.8 kcals more per day (p<0.001); and consistent-heavy drinkers 190.4±163.5 more kcals per day (p=0.25). Individuals who were inconsistent drinkers reported an average of 5.7±1.3 kcals/day from alcohol, consistent-light drinkers 18.8±1.3 kcals/day; consistent-moderate 71.4±3.1 kcals/day, and consistent-heavy 137.8±5.0 kcals/day.
Physical activity.
Consistent-light drinkers had significant changes in physical activity from baseline to year 1 and baseline to year 4 (p=0.001, 0.02; Figure 6b). Change in physical activity from baseline to year 1 and baseline to year 4 did not differ significantly by alcohol trajectory group (ps>0.05).
Discussion
Among adults with overweight/obesity and type 2 diabetes, changes in alcohol consumption from baseline to year 1 and baseline to year 4 did not differ between participants enrolled in the ILI versus DSE. Alcohol consumption was not related to year-1 weight loss among those randomized to the ILI. However, alcohol consumption was associated with weight loss achieved at year 4, suggesting that alcohol may have different physiological or behavioral implications for short versus long-term weight loss. ILI participants who abstained from alcohol, over the 4 years, lost 5.1% of initial weight at year 4, compared to significantly smaller loss of 2.4% for participants who were consistent-heavy drinkers. Compared to individuals who abstained from alcohol over the 4 years, consistent-heavy drinkers were less likely to have clinically significant weight losses of ≥5% and ≥10% at year 4. There is consistent evidence that chronic, heavy drinking is associated with negative health outcomes including liver cirrhosis, chronic pancreatitis, cancer, and cardiovascular disease.33,34 This study indicates that heavy drinking attenuates long-term weight loss among adults with type 2 diabetes.
Weight loss between participants who did and did not abstain from alcohol were similar during the first year of the program. However, at year 4, participants in the lifestyle intervention who abstained from alcohol lost 1.6% more weight relative to individuals who drank alcohol at any time over the 4 years. Our exploratory analyses of the subgroups of participants who completed the food frequency and physical activity questionnaires demonstrated that changes in dietary intake and physical activity were not significantly different among alcohol trajectory groups. However, at year 4, calories from alcohol partially, but not completely, explained differences in caloric intake between abstainers and inconsistent drinkers, consistent-light and consistent-moderate drinkers. Thus, alcohol added calories to daily energy intake, and participants may have been less adherent to calorie goals, leading to less weight loss. For ILI participants who were consistent-heavy drinkers, the additional calories reported from alcohol accounted for all of the extra dietary calories relative to participants who were abstinent from alcohol. We believe that participants who drank alcohol may have compensated for calories from alcohol during the short-term (i.e., by decreasing their calorie intake from food) but had more difficulties over the long-term when weight typically plateaus and biological and behavioral factors may make it more difficult to maintain weight loss.35 The results also support previous research that individuals often do not decrease subsequent intake to account for the calories consumed from alcohol.10,36,37 Alcohol consumption before or with a meal can stimulate food intake,7,10 which may have resulted in overeating. Participants with consistent-heavy alcohol consumption had significant improvements in physical activity at year 1 but not at year 4, which may have contributed to the worse long-term weight control.38 Further research is needed that examines the effects of reducing or eliminating alcohol consumption on long-term weight management. Research is warranted that examines mediators underlying the effects of alcohol on weight loss efforts, such as impulsivity, food choices, and physical activity.
These results indicate that abstaining from alcohol offers some modest benefits for long-term weight control. However, the clinical significance of this difference is uncertain, and results should be taken into context of the potential (though controversial) benefits of light-to-moderate alcohol consumption. There is a “J” or “U” shaped relationship between alcohol consumption and some health outcomes. For example, light-to-moderate alcohol intake is associated with a lower risk of cardiovascular disease relative to people who are never drinkers or those who are heavy drinkers.39,40 For other conditions, such as breast cancer, there is no known safe level of alcohol consumption.41 The U.S. Dietary Guidelines for Americans indicate that if alcohol is consumed, it should be consumed in moderation (i.e., one drink per day for women and up to two drinks per day for men).32 Studies are needed to assess whether the benefits of light-to-moderate alcohol consumption on cardiovascular disease may outweigh the risks of worse weight loss.
Alcohol consumption was not associated with weight in the DSE group, suggesting that the effects of alcohol on weight may be more evident during ILI (and weight loss) versus control conditions (when weight is relatively stable). These differences may be explained by diet, physical activity, or other factors that differed between the ILI and DSE groups. Research is needed to assess differences in the effect of alcohol on weight loss versus weight gain prevention.
Contrary to previous reports of declines in alcohol consumption during behavioral obesity treatment,22 we found that individuals in the ILI did not decrease their alcohol intake more than those in the DSE. Participants in the ILI were advised to decrease alcohol consumption, but not instructed to completely eliminate alcohol, which may account for the null findings. There may have been floor effects that reduced our ability to detect differences between groups. At baseline, 61.8% of participants reported consuming alcohol in the past year, which is slightly less than the 70% of Americans from the general population.2,3 The overall quantity of alcohol consumed was low, consistent with previous findings that heavier drinking is less common among older adults compared to younger adults, and those with diabetes relative to the general population.42 Further replication in younger samples and in people without diabetes is warranted.
Strengths of this study include the large sample size, longer-term follow-up, and excellent retention rate. We adjusted for a number of confounders, though unmeasured and residual confounders could have influenced findings such as drinking history, ill health, diseases or their treatment that may have prevented alcohol use, or psychosocial factors. We did not adjust for dietary intake or physical activity in models since only 27.3% of participants completed both measures. This study has several other limitations. Alcohol consumption, dietary intake, and physical activity were self-reported, which may have led to underreporting of calories consumed and overreporting of physical activity. The time-frame used for alcohol was 1 year which helped capture infrequent drinkers and seasonal variations in alcohol habits, but may have resulted in recall bias.43 Data on daily alcohol consumption were not available, thus a weekly amount was used. Participants had type 2 diabetes, and the overall depression severity was low, which limits generalizability of findings. The number of participants with heavy alcohol consumption was low, resulting in large confidence intervals within this group. While gender was included as a covariate, further studies are needed to examine the interactions among gender, alcohol consumption, and weight loss.
In conclusion, our findings suggest that while alcohol consumption is not associated with short-term weight loss during a lifestyle intervention, it is associated with worse long-term weight loss in participants with overweight/obesity and type 2 diabetes. Participants who drank alcohol at any time over the 4 years lost less weight relative to participants who did not drink at any time. Participants who were consistent, heavy alcohol drinkers were at greatest risk for suboptimal long-term weight losses. Patients with type 2 diabetes who are trying to lose weight should be encouraged to reduce alcohol consumption. Though weight loss was greater among those who abstained from alcohol, further research is needed to assess the potential beneficial (e.g., cardiovascular disease, mortality) and detrimental effects of light-to-moderate alcohol consumption on individuals trying to lose weight. Ultimately, randomized controlled trials are necessary to test whether eliminating alcohol consumption improves weight loss and other cardiovascular outcomes during lifestyle interventions.
Supplementary Material
Study Importance
What is already known about this subject?
Few studies have assessed changes in alcohol consumption during lifestyle interventions.
It is unclear whether alcohol consumption is associated with weight loss.
What does this study add?
Participants with overweight/obesity and type 2 diabetes in an intensive lifestyle intervention (ILI) and diabetes support and education (DSE) control did not differ in changes from baseline to year 4 in total alcohol consumption.
ILI participants who abstained from alcohol lost 5.1% of initial weight at year 4, compared to a significantly smaller 2.4% for participants who were consistent-heavy drinkers.
ILI participants who abstained from alcohol consumption over the 4 years lost 1.6% more weight relative to individuals who drank alcohol at any time over the 4 years.
Acknowledgments
Funding: AMC was supported by the National Institute of Nursing Research of the National Institutes of Health under Award Number K23NR017209. This study is supported by the Department of Health and Human Services through the following cooperative agreements from the National Institutes of Health: DK57136, DK57149, DK56990, DK57177, DK57171, DK57151, DK57182, DK57131, DK57002, DK57078, DK57154, DK57178, DK57219, DK57008, DK57135, and DK56992. The following federal agencies have contributed support: National Institute of Diabetes and Digestive and Kidney Diseases; National Heart, Lung, and Blood Institute; National Institute of Nursing Research; National Center on Minority Health and Health Disparities; Office of Research on Women’s Health; the Centers for Disease Control and Prevention; and the Department of Veterans Affairs. This research was supported in part by the Intramural Research Program of the National Institute of Diabetes and Digestive and Kidney Diseases. The Indian Health Service (I.H.S.) provided personnel, medical oversight, and use of facilities. The opinions expressed in this paper are those of the authors and do not necessarily reflect the views of the I.H.S. or other funding sources. Additional support was received from The Johns Hopkins Medical Institutions Bayview General Clinical Research Center (M01RR02719); the Massachusetts General Hospital Mallinckrodt General Clinical Research Center and the Massachusetts Institute of Technology General Clinical Research Center (M01RR01066); the University of Colorado Health Sciences Center General Clinical Research Center (M01RR00051) and Clinical Nutrition Research Unit (P30 DK48520); the University of Tennessee at Memphis General Clinical Research Center (M01RR0021140); the University of Pittsburgh General Clinical Research Center (GCRC) (M01RR000056), the Clinical Translational Research Center (CTRC) funded by the Clinical & Translational Science Award (UL1 RR 024153) and NIH grant (DK 046204); and the Frederic C. Bartter General Clinical Research Center (M01RR01346) The following organizations have committed to make major contributions to Look AHEAD: FedEx Corporation; Health Management Resources; LifeScan, Inc., a Johnson & Johnson Company; OPTIFAST® of Nestle HealthCare Nutrition, Inc.; Hoffmann-La Roche Inc.; Abbott Nutrition; and Slim-Fast Brand of Unilever North America.
Footnotes
Disclosures: AMC reports grant funding, outside the current work, from Shire Pharmaceuticals. TAW discloses serving on advisory boards for Novo Nordisk and Weight Watchers, as well as receiving grant support, on behalf of the University of Pennsylvania, from Eisai Co and Novo Nordisk. JST discloses serving as a consultant for Novo Nordisk. RIB discloses serving as a consultant to Eisai Co. RIB also is receiving research support from Eisai Inc., on behalf of The Children’s Hospital of Philadelphia.
References
- 1.Huth PJ, Fulgoni VL, Keast DR, Park K, Auestad N. Major food sources of calories, added sugars, and saturated fat and their contribution to essential nutrient intakes in the US diet: data from the National Health and Nutrition Examination Survey (2003–2006). Nutr J. 2013;12(1):116. [DOI] [PMC free article] [PubMed] [Google Scholar]
- 2.Center for Behavioral Health Statistics and Quality. Behavioral health trends in the United States: results from the 2014 National Survey on Drug Use and Health. Rockville, MD, USA: 2015. HHS Publication No. SMA 15–4927, NSDUH Series H-50. [Google Scholar]
- 3.Grant BF, Chou SP, Saha TD, et al. Prevalence of 12-month alcohol use, high-risk drinking, and DSM-IV alcohol use disorder in the United States, 2001–2002 to 2012–2013: results from the National Epidemiologic Survey on Alcohol and Related Conditions. JAMA Psychiatry. 2017;74(9):911–923. [DOI] [PMC free article] [PubMed] [Google Scholar]
- 4.Butler L, Poti JM, Popkin BM. Trends in energy intake from alcoholic beverages among US adults by sociodemographic characteristics, 1989–2012. J Acad Nutr Diet. 2016;116(7):1087–1100. [DOI] [PMC free article] [PubMed] [Google Scholar]
- 5.Li X-H, Yu F-f, Zhou Y-H, He J. Association between alcohol consumption and the risk of incident type 2 diabetes: a systematic review and dose-response meta-analysis. The American Journal of Clinical Nutrition. 2016;103(3):818–829. [DOI] [PubMed] [Google Scholar]
- 6.Caton S, Ball M, Ahern A, Hetherington M. Dose-dependent effects of alcohol on appetite and food intake. Physiol Behav. 2004;81(1):51–58. [DOI] [PubMed] [Google Scholar]
- 7.Yeomans MR. Alcohol, appetite and energy balance: is alcohol intake a risk factor for obesity? Physiol Behav. 2010;100(1):82–89. [DOI] [PubMed] [Google Scholar]
- 8.Caton SJ, Nolan LJ, Hetherington MM. Alcohol, appetite and loss of restraint. Current Obesity Reports. 2015;4(1):99–105. [DOI] [PubMed] [Google Scholar]
- 9.Breslow RA, Chen CM, Graubard BI, Jacobovits T, Kant AK. Diets of drinkers on drinking and nondrinking days: NHANES 2003–2008. The American Journal of Clinical Nutrition. 2013;97(5):1068–1075. [DOI] [PMC free article] [PubMed] [Google Scholar]
- 10.Buemann B, Toubro S, Astrup A. The effect of wine or beer versus a carbonated soft drink, served at a meal, on ad libitum energy intake. Int J Obes. 2002;26(10):1367–1372. [DOI] [PubMed] [Google Scholar]
- 11.Eiler WJ, Džemidžić M, Case KR, et al. The apéritif effect: Alcohol’s effects on the brain’s response to food aromas in women. Obesity. 2015;23(7):1386–1393. [DOI] [PMC free article] [PubMed] [Google Scholar]
- 12.Breslow RA, Smothers BA. Drinking patterns and body mass index in never smokers: National Health Interview Survey, 1997–2001. Am J Epidemiol. 2005;161(4):368–376. [DOI] [PubMed] [Google Scholar]
- 13.Wannamethee S, Shaper A, Whincup P. Alcohol and adiposity: effects of quantity and type of drink and time relation with meals. Int J Obes. 2005;29(12):1436–1444. [DOI] [PubMed] [Google Scholar]
- 14.Wannamethee SG, Field AE, Colditz GA, Rimm EB. Alcohol intake and 8‐year weight gain in women: a prospective study. Obesity. 2004;12(9):1386–1396. [DOI] [PubMed] [Google Scholar]
- 15.Wannamethee SG, Shaper AG. Alcohol, body weight, and weight gain in middle-aged men. The American Journal of Clinical Nutrition. 2003;77(5):1312–1317. [DOI] [PubMed] [Google Scholar]
- 16.Downer MK, Bertoia ML, Mukamal KJ, Rimm EB, Stampfer MJ. Change in alcohol intake in relation to weight change in a cohort of US men with 24 years of follow‐up. Obesity. 2017;25(11):1988–1996. [DOI] [PMC free article] [PubMed] [Google Scholar]
- 17.Liu S, Serdula MK, Williamson DF, Mokdad AH, Byers T. A prospective study of alcohol intake and change in body weight among US adults. Am J Epidemiol. 1994;140(10):912–920. [DOI] [PubMed] [Google Scholar]
- 18.Sayon-Orea C, Martinez-Gonzalez MA, Bes-Rastrollo M. Alcohol consumption and body weight: a systematic review. Nutr Rev. 2011;69(8):419–431. [DOI] [PubMed] [Google Scholar]
- 19.Sherwood NE, Jeffery R, French S, Hannan P, Murray D. Predictors of weight gain in the Pound of Prevention study. Int J Obes. 2000;24(4):395–403. [DOI] [PubMed] [Google Scholar]
- 20.Traversy G, Chaput J-P. Alcohol consumption and obesity: an update. Current Obesity Reports. 2015;4(1):122–130. [DOI] [PMC free article] [PubMed] [Google Scholar]
- 21.Egger G, Bolton A, O’Neill M, Freeman D. Effectiveness of an abdominal obesity reduction programme in men: the GutBuster” waist loss’ programme. Int J Obes Relat Metab Disord. 1996;20(3):227–231. [PubMed] [Google Scholar]
- 22.Kase CA, Piers AD, Schaumberg K, Forman EM, Butryn ML. The relationship of alcohol use to weight loss in the context of behavioral weight loss treatment. Appetite. 2016;99:105–111. [DOI] [PMC free article] [PubMed] [Google Scholar]
- 23.Collins CE, Morgan PJ, Warren JM, Lubans DR, Callister R. Men participating in a weight-loss intervention are able to implement key dietary messages, but not those relating to vegetables or alcohol: the Self-Help, Exercise and Diet using Internet Technology (SHED-IT) study. Public Health Nutr. 2011;14(1):168–175. [DOI] [PubMed] [Google Scholar]
- 24.Look AHEAD Research Group. Cardiovascular effects of intensive lifestyle intervention in type 2 diabetes. N Engl J Med. 2013;2013(369):145–154. [DOI] [PMC free article] [PubMed] [Google Scholar]
- 25.Look AHEAD Research Group. Look AHEAD (Action for Health in Diabetes): design and methods for a clinical trial of weight loss for the prevention of cardiovascular disease in type 2 diabetes. Control Clin Trials. 2003;24(5):610–628. [DOI] [PubMed] [Google Scholar]
- 26.Look AHEAD Research Group. The Look AHEAD study: a description of the lifestyle intervention and the evidence supporting it. Obesity 2006;14(5):737–752. [DOI] [PMC free article] [PubMed] [Google Scholar]
- 27.Look AHEAD Research Group. The development and description of the comparison group in the Look AHEAD trial. Clinical Trials. 2011;8(3):320–329. [DOI] [PMC free article] [PubMed] [Google Scholar]
- 28.National Institute on Alcohol Abuse and Alcoholism. Recommended Alcohol Questions. 2003; https://www.niaaa.nih.gov/research/guidelines-and-resources/recommended-alcohol-questions. Accessed June 20, 2018.
- 29.Paffenbarger RS Jr, Wing AL, Hyde RT. Physical activity as an index of heart attack risk in college alumni. Am J Epidemiol. 1978;108(3):161–175. [DOI] [PubMed] [Google Scholar]
- 30.Beck AT, Steer R, Brown G. Beck Depression Inventory Manual San Antonio, TX: The Psychological Corporation; Harcourt Brace Jovanovich Beck, AT, Ward, CH, Mendelson M, Mock J, & Erbaugh J(1961) An inventory for measuring depression Archives of General Psychiatry. 1987;4:561–571. [Google Scholar]
- 31.Ware JE, Keller SD, Kosinski M. SF-36: Physical and mental health summary scales: A user’s manual. Health Assessment Lab; 1994. [Google Scholar]
- 32.US Department of Health and Human Services. Dietary Guidelines for Americans 2015–2020. Skyhorse Publishing Inc.; 2017. [Google Scholar]
- 33.Rehm J, Roerecke M. Cardiovascular effects of alcohol consumption. Trends Cardiovasc Med. 2017;27(8):534–538. [DOI] [PubMed] [Google Scholar]
- 34.Corrao G, Bagnardi V, Zambon A, La Vecchia C. A meta-analysis of alcohol consumption and the risk of 15 diseases. Prev Med. 2004;38(5):613–619. [DOI] [PubMed] [Google Scholar]
- 35.Ochner CN, Barrios DM, Lee CD, Pi-Sunyer FX. Biological mechanisms that promote weight regain following weight loss in obese humans. Physiol Behav. 2013;120:106–113. [DOI] [PMC free article] [PubMed] [Google Scholar]
- 36.Westerterp-Plantenga MS, Verwegen CR. The appetizing effect of an apéritif in overweight and normal-weight humans–. The American Journal of Clinical Nutrition. 1999;69(2):205–212. [DOI] [PubMed] [Google Scholar]
- 37.Hetherington MM, Cameron F, Wallis DJ, Pirie LM. Stimulation of appetite by alcohol. Physiol Behav. 2001;74(3):283–289. [DOI] [PubMed] [Google Scholar]
- 38.Thomas JG, Bond DS, Phelan S, Hill JO, Wing RR. Weight-loss maintenance for 10 years in the National Weight Control Registry. Am J Prev Med. 2014;46(1):17–23. [DOI] [PubMed] [Google Scholar]
- 39.Ronksley PE, Brien SE, Turner BJ, Mukamal KJ, Ghali WA. Association of alcohol consumption with selected cardiovascular disease outcomes: a systematic review and meta-analysis. BMJ. 2011;342:d671. [DOI] [PMC free article] [PubMed] [Google Scholar]
- 40.Goel S, Sharma A, Garg A. Effect of alcohol consumption on cardiovascular health. Curr Cardiol Rep. 2018;20(4):19. [DOI] [PubMed] [Google Scholar]
- 41.Singletary KW, Gapstur SM. Alcohol and breast cancer: review of epidemiologic and experimental evidence and potential mechanisms. JAMA. 2001;286(17):2143–2151. [DOI] [PubMed] [Google Scholar]
- 42.Polsky S, Akturk HK. Alcohol consumption, diabetes risk, and cardiovascular disease within diabetes. Curr Diab Rep. 2017;17(12):136. [DOI] [PubMed] [Google Scholar]
- 43.Greenfield TK, Kerr WC. Alcohol measurement methodology in epidemiology: recent advances and opportunities. Addiction. 2008;103(7):1082–1099. [DOI] [PMC free article] [PubMed] [Google Scholar]
Associated Data
This section collects any data citations, data availability statements, or supplementary materials included in this article.


