

Abstract
Background:
Medication treatment (MT) with methadone and buprenorphine are effective treatments for opioid use disorders, but little information is available regarding the extent to which buprenorphine’s approval resulted in more individuals receiving MT nor to what extent receipt of such treatment was equitable across communities.
Methods:
To examine changes in MT utilization and the association between MT utilization and county-level indicators of poverty, race/ethnicity and urbanicity, we used Medicaid claims of non-dually eligible Medicaid-enrollees ages 18–64 from 14 states for 2002 to 2009. We generated county level aggregate counts of MT (methadone, buprenorphine, and any MT) by year (N=7,760 county-years). We estimated count data models to identify associations between MT and county characteristics, including levels of poverty and racial/ethnic concentration.
Results:
The number of Medicaid-enrollees receiving MT increased 62% from 2002 to 2009. The number of enrollees receiving methadone increased 20% with the remaining increase resulting from buprenorphine. Urban county residents were significantly more likely to receive MT in both 2002 and 2009 than rural county residents. However, buprenorphine substantially increased MT in rural counties from 2002 to 2009. Receipt of MT increased at a much higher rate for residents of counties with lower poverty rates and lower concentrations of black and Hispanic individuals than for residents of counties without those characteristics.
Conclusions:
The increase in Medicaid-enrollees receiving MT in the years following buprenorphine’s approval is encouraging. However, it is concerning that MT trends varied so dramatically by characteristics of the county population and that increases in utilization were substantially lower in counties with populations that historically have been disadvantaged with respect to health care access and quality. Concerted efforts are needed to ensure that MT benefits are equitably distributed across society and reach disadvantaged individuals who may be at higher risk of experiencing opioid use disorders.
Keywords: opioid use disorder, Medicaid, buprenorphine, substance abuse treatment, disparities
Opioid overdose-related deaths have nearly quadrupled in the last 15 years, 1 and recent analyses suggesting there could be more than 500,000 opioid deaths over the next decade.2 Opioid use disorders (OUDs) affect an estimated 9 of every 1000 Americans3 and cost the U.S. over $78 billion in 2013.4 Medication treatment (MT) with methadone or buprenorphine can effectively treat OUDs5,6 and increasing the use of such medications is a cornerstone of the U.S. Health and Human Service Opioid Initiative.7 Historically MT was essentially methadone dispensed in licensed opioid treatment programs, and the majority of individuals with OUDs did not receive methadone,8,9 in part because facility waiting lists were long, programs were located primarily in urban communities, and most individuals were required to attend the clinic daily, a potential barrier for individuals with full-time jobs or caring for young children.10–15
Buprenorphine’s approval in 2002 allowed qualified physicians (hereafter referred to as waivered physicians) to prescribe buprenorphine to treat individuals with OUDs by being waivered from the special registration requirements of the Controlled Substances Act. These changes substantially enhanced options for MT, and in subsequent years, the number and geographic distribution of waivered physicians grew substantially,16 more substance abuse treatment facilities used buprenorphine,17 and more buprenorphine was dispensed.18
However, studies of the years immediately following buprenorphine’s approval raised concerns about equitable access to treatment. Caucasian patients and the privately insured were more likely to receive buprenorphine than non-caucasian patients or the publicly insured;19,20 individuals living in communities with higher percentages of blacks, Hispanics, and individuals living below the poverty line were less likely to receive buprenorphine.21 However, there is little information about whether disparities in buprenorphine use immediately following its approval persisted, or the extent to which buprenorphine’s approval resulted in more individuals overall receiving MT.
This study’s goal was to better understand the extent to which buprenrophine’s approval increased the number of Medicaid-enrollees who received MT in the years following FDA approval. Levels and trends in MT use at the population level, both overall and by key county characteristics, are described. We used a population-based approach, focusing on county-level aggregate MT, methadone, and buprenorphine use from 14 states. Becasuse there are no accurate county-level data regarding the number of individuals with OUD, we controlled for the number of individuals within a county. Medicaid claims were used for the study, as Medicaid disproportionately covers individuals at higher risk for OUD and opioid-related mortality, 22–26 and is the source of reimbursement for more than one-third of OUD treatment episodes.22 Medicaid claims from 2002 to 2009 were used to identify receipt of any MT, buprenorphine, or methadone and to examine how MT trends varied with county characteristics previously associated with buprenorphine treatment disparities, such as the concentrations of individuals living below the poverty level and racial/ethnic minorities. Our goals were to examine changes in MT utilization over time, and the association between MT utilization and county-level indicators of poverty, race/ethnicity and urbanicity.
Methods
Overview
Because the goal was to conduct a census of Medicaid-sponsored MT overall and by key county characteristics, Medicaid claims were used to identify treatment counts in each county annually. Counties were classified based on the concentration of race/ethnicity and the concentration of poverty. We designed models to generate predicted total MT counts under alternative assumptions about racial/ethnic and poverty concentration, facilitating the highlighting of how concentrations of poverty or race/ethnicity influenced MT trends.
Population
Medicaid claims from 2002–2009 – the most recent years available prior to federal redaction of substance use disorder treatment related claims27 – from 14 states (CA, CT, FL, GA, IL, LA, MA, MD, NY, PA, RI, TX, VT, and WI) representing 53% of the U.S. population and 47% of 2009 Medicaid-enrollees, were used.28 The states were selected to represent diversity in regions, populations, and Medicaid policies regarding the use of buprenorphine and methadone to treat Medicaid-enrollees with OUDs. We examined MT use among 18–64 year old Medicaid-enrollees, excluding individuals who were dually eligible (Medicare and Medicaid coverage) and individuals not Medicaid-enrolled during at least 9 months of the year. The RAND IRB determined the research to be exempt.
Variables
Individuals were categorized as having been treated with methadone if they had any claim during a year for methadone dispensed at an opioid treatment program, identified with service codes indicating methadone administration or service by a licensed program. They were categorized as having been treated with buprenorphine if during a year they had filled a prescription for a buprenorphine formulation not approved by the FDA solely for pain management, as identified by NDC code on a pharmacy claim. Individuals treated with either methadone or buprenorphine during a year were categorized as having received MT during that year. A small number of individuals (3% or less in all years) used both buprenorphine and methadone in a year and were classified as methadone users, allowing better illustration of buprenorphine’s role in expanding use of MT. These individual level measures were aggregated to the county level, by year, and used as dependent variables in the multivariable models.
Data on county characteristics, including population counts, socio-economic status, urban-rural status, and racial/ethnic composition of counties, were obtained from the Area Health Resource File.29 Counties were classified as having low poverty rates if the percent of the population below the federal poverty line (FPL) was below the median of the counties in the 14 states in our study (% in poverty<13.5%); all other counties were classified as having not low poverty rates. Counties were classified as having a low percentage of blacks if the percent of the black population was below the median in the sample of counties in the 14 states in this study (% black < 5.6%); all other counties were considered to have a not low percentage of blacks. Similarly, counties were categorized as having a low percentage of Hispanics if the percent of the Hispanic population was below the median in the 14 states in this study (% Hispanic < 4.2%); otherwise the county was categorized as having a not low percentage of Hispanics. 2003 Rural Urban Continuum codes were used to identify urban (metropolitan) and rural (non-metropolitan) counties.
Analyses
First, county-level annual aggregate counts of Medicaid-enrollees who had received methadone, buprenorphine, or any MT were generated. We generated aggregate counts of MT use, by county (N=970 in the 14 states) and year (N = 8) for a total of 7,760 county-year observations, and the unit of analysis for the multivariable models was the county-year. To describe treatment trends by county characteristics using a consistent metric, we specified standard count data models (negative binomial) using county treatment counts, by year, as the dependent variable and controlling for county characteristics and time. The models generate incident rate ratios (IRR) for each year, for each county type, and for each treatment type (methadone, buprenorphine, any MT) as a function of total county population (the exposure variable), calendar year, poverty concentration, urban-rural status, and concentration of either black race or Hispanic ethnicity (modeled separately) were formulated. These IRRs allowed comparison of the treatment rates of county types versus the referent county type (low percentage of blacks and low poverty rates, low percentage of Hispanics and low poverty rates, respectively) in both 2002 and 2009 as well as comparison of treatment rates for each county-type for subsequent years to the referent year, 2002. The use of total county population as the exposure variable allowed characterization of differences in the total Medicaid-sponsored treatment per capita across county types and generation of predicted treatment counts at population levels.
To better understand how race/ethnicity and poverty interacted to influence receipt of MT, models with interactions of race were specified (alternatively ethnicity) by poverty, controlling for urban-rural status and population. To allow for separate trends in treatment within each of the four county-types (low versus not low black (alternatively Hispanic) by low versus not low poverty), the race-poverty indicators (county-types) by calendar year were interacted, controlling for urban-rural status and including county population as the exposure variable. Because counts of MT use might be correlated within county over time, we calculated Huber-White empirical sandwich estimates of the standard errors, clustered by county.30
Using 2002 population counts and urban/rural classifications and using the race-by-poverty model estimates, standardized predictions (also called recycled predictions) were generated by assigning each county alternately to one of the four county-types. To generate predictions, each county was first assigned to be low concentration black and low concentration poverty and generated the total annual predicted treatment. Next, each county was assigned to be low concentration black and not low concentration poverty and the predicted treatment was generated, and so on until predictions had been generated for each of the county-types by race/ethnicity and poverty for both black and Hispanic. These standardized predictions allowed illustration by year of the multivariable model’s findings of total MT under alternative assumptions and demonstrated what predicted MT use would be if all counties had a specific set of characteristics.
Results
From 2002 through 2009, the 14 states in this study experienced about a 6% overall increase in population as well as modest increases in the percentage of the population that was black (13.6% to 13.8%), Hispanic (19.2% to 21.8%) and living in poverty (12.5% to 13.9%). The number of Medicaid beneficiaries ages 19 to 64 increased from 10.7 million in 2002 to 13.8 million individuals in 2009,31 approximately a 29% increase.
From 2002 through 2009, growth in the number of Medicaid-enrollees receiving MT outpaced overall Medicaid growth. The number of Medicaid-enrollees receiving methadone increased 20% (42,235 to 50,587), accounting for only a portion of the 62% increase (42,263 to 68,278) in Medicaid-enrollees receiving MT. The rest of the increase in Medicaid-enrollees receiving MT resulted from the number of enrollees receiving buprenorphine increasing from 75 in 2002 to 19,691 in 2009. In 2009, almost 29% of all Medicaid-enrollees receiving MT received buprenorphine.
The growth in MT use varied substantially by the characteristics of a county’s population. In 2002, when methadone accounted for essentially all MT, urban counties had dramatically higher rates of therapy than rural counties (IRR=9.54, p<0.001) (Table 1), but there were no significant differences across counties by concentration of black race or poverty. In contrast, counties with not low concentrations of Hispanics in 2002 had higher rates of MT regardless of the concentration of poverty (IRR=2.72 for low poverty, p<0.01; and IRR=3.47 for not low poverty, p<0.01) than counties with a low concentration of Hispanics and poverty.
Table 1:
Multivariable negative binomial regression results, by Black and Hispanic poverty concentration
| Opioid Agonist Therapy | Opioid Agonist Therapy | Methadone | Buprenorphine | |||||
|---|---|---|---|---|---|---|---|---|
| 2002 | 2009 | 2009 | 2009 | |||||
| IRR | P | IRR | P | IRR | P | IRR | P | |
| Black/Poverty | ||||||||
| Low/Low | Ref | Ref | Ref | Ref | ||||
| Low/High | 1.376 | 0.257 | 0.521 | 0.003 | 0.464 | 0.005 | 0.475 | 0.001 |
| High/Low | 0.698 | 0.169 | 0.368 | 0.0001 | 0.334 | 0.001 | 0.359 | <0.001 |
| High/High | 0.849 | 0.493 | 0.311 | <0.001 | 0.427 | 0.001 | 0.228 | <0.001 |
| Urban | 9.545 | <0.001 | 1.944 | 0.0001 | 4.282 | <0.001 | 1.076 | 0.659 |
| Hispanic/Poverty | ||||||||
| Low/Low | Ref | Ref | Ref | Ref | ||||
| Low/High | 0.136 | <0.001 | 0.383 | <0.001 | 0.321 | <0.001 | 0.379 | <0.001 |
| High/Low | 2.718 | <0.001 | 0.330 | <0.001 | 0.649 | 0.1419 | 0.223 | <0.001 |
| High/High | 3.468 | <0.001 | 0.306 | <0.001 | 0.625 | 0.0713 | 0.163 | <0.001 |
| Urban | 4.075 | <0.001 | 1.824 | 0.0002 | 3.039 | <0.001 | 0.978 | 0.889 |
Treatment patterns changed substantially by 2009. Compared to individuals residing in all other types of counties, residents of counties with a low percentage of blacks and a low poverty rate were significantly more likely to receive MT (low percentage of blacks and not low poverty rate IRR=0.52, p<0.001; not low percentage of blacks and low poverty rate IRR=0.37, p<0.001; not low percentage of blacks and not low poverty rate IRR=0.31, p<0.001) (Table 1). Individuals living in urban counties remained significantly more likely to receive treatment than rural county residents (IRR=1.94, p<0.01), but the difference was much smaller than in 2002. In 2009, individuals who lived in counties with a low percentage of Hispanics and a low poverty rate were significantly more likely to receive MT than individuals residing in all other types of counties (low percentage of Hispanics and a not low poverty rate IRR=0.38, p<0.001; not low percentage of Hispanics and not low poverty rate IRR=0.33, p<0.001; not low percentage of Hispanics and a not low poverty rate IRR=0.31, p<0.001).
This change in treatment pattern reflected the fact that in 2009, individuals residing in counties with a low poverty rate and a low percentage of either blacks or Hispanics were significantly more likely to receive buprenorphine than individuals residing in all other types of counties. A similar pattern with respect to county type was also seen for methadone in 2009, with the exception of counties with a not low percentage of Hispanics, in which residents had rates of methadone use comparable to that seen in counties with a low percentage of Hispanics and a low poverty rate. The urban/rural difference in use of methadone also persisted in 2009, but there were no significant urban/rural differences in use of buprenorphine at any time from 2002 to 2009.
Trends over time
Figure 1 highlights the growth of MT in counties with a low poverty rate and low concentration of blacks (Figure 1 Panel A) and Hispanics (Figure 1 Panel B) relative to all other types of counties. Growth in MT in counties with a not low concentration of blacks, regardless of poverty, lagged behind that of counties with low concentration of blacks and low poverty. Similarly, growth in MT in counties with a not low concentration of Hispanics, regardless of poverty, lagged behind that of counties with low concentration of Hispanics and low concentration of poverty.
Figure 1.
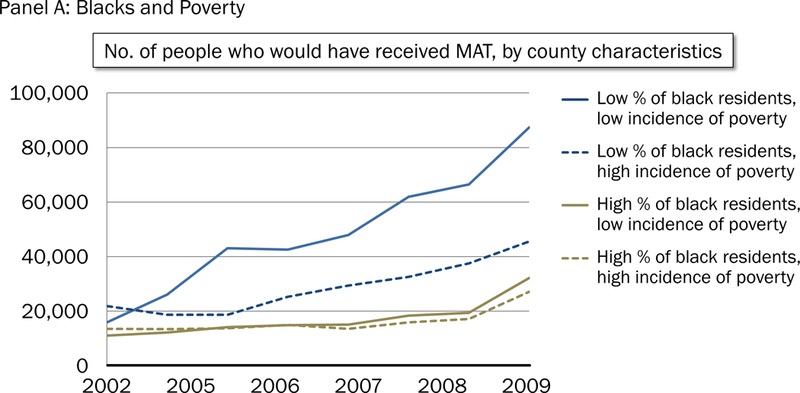
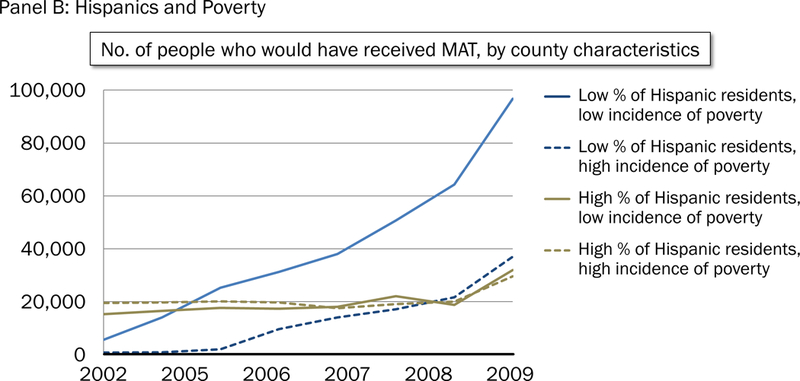
Predicted receipt of opioid agonist treatment from 2002 to 2009, by country characteristic. Panel A: Blacks and poverty. Panel B: Hispanics and poverty.
Discussion
Approval of buprenorphine for treating OUDs was viewed by many as an opportunity to meaningfully expand MT access,9,32 particularly to those who would not or could not attend methadone clinics for geographical, ideological, or practical considerations.10,33,34 There was a substantial increase in the number of Medicaid-enrollees receiving MT for OUD in the years after buprenorphine’s approval, consistent with single state studies.35 However, the rate at which MT increases across counties varied by county race/ethnicity and income, and we found that individuals residing in counties with a low poverty rate and a low percentage of either blacks or Hispanics were significantly more likely to receive buprenorphine than individuals residing in all other types of counties.
The findings that MT access varies substantially by county characteristics is consistent with early concerns that buprenorphine treatment might not be shared equally across communities.19–21 In contrast to many other areas of healthcare,36–41 historically there have been fewer sociodemographic disparities in access to substance use disorder treatment.42–44 In 2002, after controlling for urbanicity, use of MT did not vary with a county’s poverty rate or concentration of blacks and Hispanics. However, recent studies showing that counties with a high percentage of black or uninsured residents have less local access to substance abuse treatment have raised concerns that equitable access for treatment may not have persisted.45,46
These findings reinforce concerns about ensuring equitable access for historically disadvantaged populations to effective treatments for OUDs. Furthermore, recent studies find that counties with a higher concentration of black residents were more likely to lose public substance use disorder treatment facilities in the last decade.45 This reduction in facilities may partially explain the finding of disparities in methadone utilization in 2009 across counties with different poverty rates and concentrations of blacks and Hispanics; such disparities were not observed in 2002. However, in contrast to the pattern for methadone, use of buprenorphine among Medicaid-enrollees was comparable in rural and urban counties in the years after buprenorphine’s approval. The increase in waivered physicians16 and receipt of buprenorphine in rural counties has not yet eliminated differences in MT between urban and rural communities, but the magnitude of the difference has decreased dramatically.
An estimated 9 of every 1000 Americans suffers from opioid use disorder annually,3 and the substantial increase in the number of Medicaid-enrollees receiving MT is consistent with federal, state, and stakeholder efforts to increase use of buprenorphine.47–49 However even with these efforts, in 2009 fewer than 0.5 of every 1000 individuals were receiving Medicaid-sponsored MT. Given that approximately 17% of Americans are currently covered by Medicaid,31 these findings highlight the importance of extending MT access among Medicaid-enrollees.
In more recent years, states and the federal government have initiated efforts that could increase MT access. These include increasing the number of patients waivered providers can treat, expanding the types of providers who can be waivered to prescribe buprenorphine,50,51 updating state Medicaid formularies to include buprenorphine,49 implementing the Federal Mental Health Parity Addiction Equity Act, and including substance abuse as an “essential benefit” required of health insurance plans offered on exchanges as part of the Affordable Care Act. Future research is needed to understand whether these efforts have been successful52 and whether the benefits of such policies are distributed equally among the population.
This study has limitations. MT of Medicaid-enrollees in 14 states from 2002 through 2009 was examined, and it is not known to what extent the findings would generalize to uninsured or commercially insured populations or Medicaid-enrollees in other states. We also do not know if our findings would generalize to more recent years but note that recent changes in federal regulations regarding availability of substance use disorder information in claims data can facilitate analyses of more recent data. We were unable to observe MT in Medicaid-enrollees for whom a claim is not submitted, such as dually eligible individuals, those who pay cash for MT, and enrollees who receive MT under block grants or who are not consistently Medicaid-enrolled. Consistent with other studies, 53 individuals receiving MT were liberally identified, and we were unable to determine from claims to what extent buprenorphine may be used for detoxification or off-label treatment of pain. Clinical information or information on why individuals received buprenorphine vs. methadone was not available, and while the findings indicate buprenorphine expanded MT utilization, it should be interpreted purely as a treatment share. We do not know what would have occurred in buprenorphine’s absence, such as how many additional individuals might have received methadone, but note that the substantial increase in MT from 2002 to 2009 would have required a tremendous expansion in the number and capacity of methadone clinics.
Finally, we chose to take a population-based approach, using total county population to control for the number of individuals at-risk within a county. Accurate county-level counts of individuals with OUDs are unavailable preventing us from controlling for sociodemographic changes in opioid use,54 and more enrollees are likely to be diagnosed with OUDs in counties with more treatment availability. Therefore, we chose not to use counts of Medicaid-enrollees or enrollees with OUDs or to attempt to control for the number of individuals with these disorders. The results instead allow differences in the total number of Medicaid-sponsored MT cases per capita over time and across county-types to be highlighted and to illustrate trends in the use of treatments (by type) overall and across county-types. However, the findings should not be interpreted as reflecting changes over time in the likelihood that an individual with an OUD received MT. The approach provides a key starting point by decomposing trends in total MT into methadone versus buprenorphine and examining those trends across counties. Further work is needed, however, to better understand to what extent the differences in trends by county-type reflect MT availability and to what extent they reflect other important trends, such as the prevalence and severity, and shifting demographics of individuals with OUDs, Medicaid enrollment eligibility, or enforcement of substance abuse and mental health parity.
Despite these limitations, this study enhances understanding of how buprenrophine has affected MT among Medicaid-enrollees. Within seven years of approval, buprenrophine was already accounting for slightly less than one-third of Medicaid-enrollees receiving therapy for OUD and had contributed to a substantial increase in the number of enrollees receiving MT. However, it is concerning that the trends in MT varied dramatically by county population characteristics, and increases in utilization were substantially lower in counties with populations that historically have been disadvantaged with respect to healthcare access and quality. At a time of intensive policymaker and regulatory efforts to increase MT availability, our findings highlight the importance of ensuring that benefits of such policies are equitably distributed across society and reach disadvantaged individuals who may be at higher risk of suffering from these disorders.
Acknowledgments
The authors are indebted to Mary Vaiana and Janet Cummings for review and feedback on prior versions of the manuscript, and to Hilary Peterson for assistance in manuscript preparation.
Funding
The National Institute on Drug Abuse of the National Institutes of Health (NIH) (award R01DA032881–01A1) supported this study. The funding organization had no role in the design and conduct of the study; collection, management, analysis, and interpretation of the data; preparation, review, or approval of the manuscript; and decision to submit the manuscript for publication.
References
- 1.Rudd RA, Seth P, David F, Scholl L. Increases in Drug and Opioid-Involved Overdose Deaths - United States, 2010–2015. MMWR Morb Mortal Wkly Rep December 30 2016;65(5051):1445–1452. [DOI] [PubMed] [Google Scholar]
- 2.Blau M STAT Forecase: Opioids could kill nearly 500,000 Americans in the next decade. STAT News 2017. https://www.statnews.com/2017/06/27/opioid-deaths-forecast/. Accessed August 17, 2017.
- 3.Jones CM, Campopiano M, Baldwin G, McCance-Katz E. National and state treatment need and capacity for opioid agonist medication-assisted treatment. Am J Public Health 2015;105(8):e55–63. [DOI] [PMC free article] [PubMed] [Google Scholar]
- 4.Florence CS, Zhou C, Luo F, Xu L. The Economic Burden of Prescription Opioid Overdose, Abuse, and Dependence in the United States, 2013. Med Care 2016;54(10):901–906. [DOI] [PMC free article] [PubMed] [Google Scholar]
- 5.Mattick RP, Breen C, Kimber J, Davoli M. Methadone maintenance therapy versus no opioid replacement therapy for opioid dependence. Cochrane Database Syst Rev 2009(3):CD002209. [DOI] [PMC free article] [PubMed] [Google Scholar]
- 6.Mattick RP, Kimber J, Breen C, Davoli M. Buprenorphine maintenance versus placebo or methadone maintenance for opioid dependence. Cochrane Database Syst Rev 2008:CD002207. [DOI] [PubMed]
- 7.Assistant Secretary of Policy Evaluation. Issue Brief: Opioid abuse in the US and HHS actions to address opioid-drug related overses and deaths 2015; https://aspe.hhs.gov/sites/default/files/pdf/107956/ib_OpioidInitiative.pdf. Accessed September 1, 2016.
- 8.American Methadone Treatment Association. Methadone Maintenance Program and Patient Census in the US New York: American Methadone Treatment Association;1998. [Google Scholar]
- 9.O’Brien CP. A 50-year-old woman addicted to heroin: Review of treatment of heroin addiction. JAMA 2008;300(3):314–321. [DOI] [PMC free article] [PubMed] [Google Scholar]
- 10.Clark RE, Samnaliev M, Baxter JD, Leung GY. The evidence doesn’t justify steps by state Medicaid programs to restrict opioid addiction treatment with buprenorphine. Health Aff (Millwood) August 2011;30(8):1425–1433. [DOI] [PubMed] [Google Scholar]
- 11.Center for Substance Abuse Treatment, Substance Abuse and Mental Health Services Administration, U.S. Department of Health and Human Services. The Determinations Report: A Report on the Physician Waiver Program Established by the Drug Addiction Treatment Act of 2000 (“DATA”) Rockville, MD;2006. [Google Scholar]
- 12.Gryczynski J, Schwartz RP, Salkever DS, Mitchell SG, Jaffe JH. Patterns in admission delays to outpatient methadone treatment in the United States. J Subst Abuse Treat 2011;41(4):431–439. [DOI] [PMC free article] [PubMed] [Google Scholar]
- 13.Sigmon SC. Access to treatment for opioid dependence in rural America: challenges and future directions. JAMA Psych 2014;71(4):359–360. [DOI] [PubMed] [Google Scholar]
- 14.Rosenblum A, Cleland CM, Fong C, Kayman DJ, Tempalski B, Parrino M. Distance traveled and cross-state commuting to opioid treatment programs in the United States. J Environ Public Health 2011;2011:948789. [DOI] [PMC free article] [PubMed] [Google Scholar]
- 15.Andrews CM, Shin HC, Marsh JC, Cao D. Client and program characteristics associated with wait time to substance abuse treatment entry. Am J Drug Alcohol Abuse January 2013;39(1):61–68. [DOI] [PubMed] [Google Scholar]
- 16.Dick AW, Pacula RL, Gordon AJ, et al. Growth in buprenorphine waivers for physicians increased potential access to opioid agonist treatment, 2002–11. Health Aff 2015;34(6):1028–1034. [DOI] [PMC free article] [PubMed] [Google Scholar]
- 17.Substance Abuse and Mental Health Services Administration. The N-SSATS Report: Trends in the Use of Methadone and Buprenorphine at Substance Abuse Treatment Facilities: 2003 to 2011 2013; http://archive.samhsa.gov/data/2k13/NSSATS107/sr107-NSSATS-BuprenorphineTrends.htm. Accessed March 8, 2016. [PubMed]
- 18.Stein BD, Pacula RL, Gordon AJ, et al. Where is buprenorphine dispensed to treat opioid use disorders? The role of private offices, opioid treatment programs, and substance abuse treatment facilities in urban and rural counties. Milbank Q September 2015;93(3):561–583. [DOI] [PMC free article] [PubMed] [Google Scholar]
- 19.Andrews CM, D’Aunno TA, Pollack HA, Friedmann PD. Adoption of evidence-based clinical innovations: The case of buprenorphine use by opioid treatment programs. Med Care Res Rev February 2014;71(1):43–60. [DOI] [PMC free article] [PubMed] [Google Scholar]
- 20.Stanton A, McLeod C, Luckey B, Kissin W, Sonnefeld L. SAMHSA/CSAT evaluation of the buprenorphine waiver program: expanding treatment of opioid dependence: initial physician and patient experiences with the adoption of buprenorphine . Substance Abuse and Mental Health Services Administration; 2006. [Google Scholar]
- 21.Hansen HB, Siegel CE, Case BG, Bertollo DN, DiRocco D, Galanter M. Variation in use of buprenorphine and methadone treatment by racial, ethnic, and income characteristics of residential social areas in New York City. J Behav Health Serv Res 2013;40(3):367–377. [DOI] [PMC free article] [PubMed] [Google Scholar]
- 22.Becker WC, Fiellin DA, Merrill JO, et al. Opioid use disorder in the United States: Insurance status and treatment access. Drug and Alcohol Dependence 2008;94(1–3):207–213. [DOI] [PubMed] [Google Scholar]
- 23.Adelmann PK. Mental and substance use disorders among Medicaid recipients: Prevalence estimates from two national surveys. Adm Policy Ment Health November 2003;31(2):111–129. [DOI] [PubMed] [Google Scholar]
- 24.Sharp MJ, Melnik TA, Centers for Disease Control and Prevention. Poisoning deaths involving opioid analgesics - New York State, 2003–2012. MMWR Morb Mortal Wkly Rep 2015;64(14):377–380. [PMC free article] [PubMed] [Google Scholar]
- 25.Fernandes JC, Campana D, Harwell TS, Helgerson SD. High mortality rate of unintentional poisoning due to prescription opioids in adults enrolled in Medicaid compared to those not enrolled in Medicaid in Montana. Drug Alcohol Depend 2015;153:346–349. [DOI] [PubMed] [Google Scholar]
- 26.Coolen P, Best S, Lima A, Sabel JC, Paulozzi L. Overdose deaths involving prescription opioids among Medicaid enrollees - Washington, 2004–2007. MMWR Morb Mortal Wkly Rep 2009;58(42):1171–1175. [PubMed] [Google Scholar]
- 27.Frakt AB, Bagley N. Protection or harm? Suppressing substance-use data. N Engl J Med 2015;372(20):1879–1881. [DOI] [PubMed] [Google Scholar]
- 28.United States Census Bureau. Vintage 2009: State Tables https://www.census.gov/popest/data/historical/2000s/vintage_2009/state.html. Accessed January 26, 2015.
- 29.U.S. Department of Health and Human Services. Area Health Resource File (AHRF) 2012–2013 Release May 2013; http://arf.hrsa.gov/download.htm. Accessed May 7, 2014.
- 30.Huber P Robust estimation of a location parameter. Ann Math Stat 1964;35:73–101. [Google Scholar]
- 31.Smith J, Medalia C. U.S. Census Bureau, Current Population Reports, P60–250. Health Insurance Coverage in the United States: 2013 Washington, DC: U.S. Government Printing Office; 2014. [Google Scholar]
- 32.Ducharme L, Abraham A. State policy influence on the early diffusion of buprenorphine in community treatment programs. Subst Abuse Treat Prev Policy 2008;3(1):17–27. [DOI] [PMC free article] [PubMed] [Google Scholar]
- 33.Fiellin DA, O’Connor PG. Clinical practice. Office-based treatment of opioid-dependent patients. N Engl J Med 2002;347(11):817–823. [DOI] [PubMed] [Google Scholar]
- 34.Oliva EM, Maisel NC, Gordon AJ, Harris AH. Barriers to use of pharmacotherapy for addiction disorders and how to overcome them. Current Psychiatry Reports October 2011;13(5):374–381. [DOI] [PMC free article] [PubMed] [Google Scholar]
- 35.Gordon AJ, Lo-Ciganic W- H, Cochran G, et al. Patterns and quality of buprenorphine opioid agonist treatment in a large Medicaid program. J Addict Med 2015;9(6):470–477. [DOI] [PubMed] [Google Scholar]
- 36.Cook BL, McGuire T, Miranda J. Measuring trends in mental health care disparities, 2000 – 2004. Psychiatr Serv 2007;58(12):1533–1540. [DOI] [PubMed] [Google Scholar]
- 37.Institute of Medicine. Unequal Treatment: Confronting Racial and Ethnic Disparities in Health Care Washington, DC: Institute of Medicine;2002. [Google Scholar]
- 38.Mayberry RM, Mili F, Ofili E. Racial and ethnic differences in access to medical care. Med Care Res Rev 2000;57 Suppl 1:108–145. [DOI] [PubMed] [Google Scholar]
- 39.Le Cook B, McGuire TG, Zuvekas SH. Measuring trends in racial/ ethnic health care disparities. Med Care Res Rev February 2009;66(1):23–48. [DOI] [PMC free article] [PubMed] [Google Scholar]
- 40.Kessler RC, Demler O, Frank RG, et al. Prevalence and treatment of mental disorders, 1990 to 2003. N Engl J Med 2005;352(24):2515–2523. [DOI] [PMC free article] [PubMed] [Google Scholar]
- 41.Alegria M, Chatterji P, Wells K, et al. Disparity in depression treatment among racial and ethnic minority populations in the United States. Psychiatr Serv November 2008;59(11):1264–1272. [DOI] [PMC free article] [PubMed] [Google Scholar]
- 42.Cook BL, Alegria M. Racial-ethnic disparities in substance abuse treatment: The role of criminal history and socioeconomic status. Psychiatr Serv 2011;62(11):1273–1281. [DOI] [PMC free article] [PubMed] [Google Scholar]
- 43.Hatzenbuehler ML, Keyes KM, Narrow WE, Grant BF, Hasin DS. Racial/ethnic disparities in service utilization for individuals with co-occurring mental health and substance use disorders in the general population: Results from the national epidemiologic survey on alcohol and related conditions. J Clin Psychiatry 2008;69(7):1112–1121. [DOI] [PMC free article] [PubMed] [Google Scholar]
- 44.Wu LT, Ringwalt CL, Williams CE. Use of substance abuse treatment services by persons with mental health and substance use problems. Psychiatr Serv 2003;54(3):363–369. [DOI] [PubMed] [Google Scholar]
- 45.Cummings JR, Wen H, Ko M. Decline In public substance use disorder treatment centers most serious in counties with high shares of black residents. Health Aff (Millwood) 2016;35(6):1036–1044. [DOI] [PMC free article] [PubMed] [Google Scholar]
- 46.Cummings JR, Wen H, Ko M, Druss BG. Race/ethnicity and geographic access to Medicaid substance use disorder treatment facilities in the United States. JAMA Psych 2014;71(2):190–196. [DOI] [PMC free article] [PubMed] [Google Scholar]
- 47.Office of National Drug Control Policy Reauthorization Act of 2006 (ONDCPRA), (2006).
- 48.Egan JE, Casadonte P, Gartenmann T, et al. The Physician Clinical Support System-Buprenorphine (PCSS-B): a novel project to expand/improve buprenorphine treatment. J Gen Intern Med 2010;25(9):936–941. [DOI] [PMC free article] [PubMed] [Google Scholar]
- 49.Burns RM, Pacula RL, Bauhoff S, et al. Policies related to opioid agonist therapy for opioid use disorders: The evolution of state policies from 2004 to 2013. Subst Abus 2016;37(1):63–69. [DOI] [PMC free article] [PubMed] [Google Scholar]
- 50.Department of Health and Human Services. Medication Assisted Treatment for Opioid Use Disorders; 81 FR 44711; Document number 2016<tr>-</tr>16120. In: Secondary Department of Health and Human Services, ed. Subsidiary Department of Health and Human Services, trans. Secondary Medication Assisted Treatment for Opioid Use Disorders; 81 FR 44711; Document number 2016–16120: https://federalregister.gov/a/2016-16120; 2016:44711–44739.
- 51.Tierney M, Finnell DS, Naegle MA, LaBelle C, Gordon AJ. Advanced practice nurses: Increasing access to opioid treatment by expanding the pool of qualified buprenorphine prescribers. Subst Abus 2015;36(4):389–392. [DOI] [PubMed] [Google Scholar]
- 52.Stein BD, Sorbero M, Dick AW, Pacula RL, Burns RM, Gordon AJ. Physician capacity to treat opioid use disorder with buprenorphine-assisted treatment. JAMA Sep 20 2016;316(11):1211–1212. [DOI] [PMC free article] [PubMed] [Google Scholar]
- 53.Oliva EM, Trafton JA, Harris AH, Gordon AJ. Trends in opioid agonist therapy in the Veterans Health Administration: Is supply keeping up with demand? Am J Drug Alcohol Abuse 2013;39(2):103–107. [DOI] [PubMed] [Google Scholar]
- 54.Jones CM, Logan J, Gladden RM, Bohm MK. Vital Signs: Demographic and Substance Use Trends Among Heroin Users - United States, 2002–2013. MMWR Morb Mortal Wkly Rep July 10 2015;64(26):719–725. [PMC free article] [PubMed] [Google Scholar]