Abstract
In some clinical applications, prior normal-dose CT (NdCT) images are available, and the valuable textures and structure features in them may be used to promote follow-up low-dose CT (LdCT) reconstruction. This study aims to learn texture information from the NdCT images and leverage it for follow-up LdCT image reconstruction to preserve textures and structure features. Specifically, the proposed reconstruction method first learns the texture information from those patches with similar structures in NdCT image, and the similar patches can be clustered by searching context features efficiently from the surroundings of the current patch. Then it utilizes redundant texture information from the similar patches as a priori knowledge to describe specific regions in the LdCT image. The advanced region-aware texture preserving prior is termed as ‘RATP’. The main advantage of the PATP prior is that it can properly learn the texture features from available NdCT images and adaptively characterize the region-specific structures in the LdCT image. The experiments using patient data were performed to evaluate the performance of the proposed method. The proposed RATP method demonstrated superior performance in LdCT imaging compared to the filtered back projection (FBP) and statistical iterative reconstruction (SIR) methods using Gaussian regularization, Huber regularization and the original texture preserving regularization.
Keywords: statistical iterative reconstruction, low-dose, CT imaging, a priori image, texture preserving
1. Introduction
Computed tomography (CT) has been widely used in various clinical applications (Pouliot et al 2005, Schmidbauer et al 2008, Aberle et al 2011, Campbell et al 2015). However, concerns regarding high radiation dose in CT imaging are growing, especially for those patients undergoing repetitive CT scans. For instance, in the case of image-guided lung nodule biopsy, a patient may undergo multiple scans and the cumulative radiation dose is very significant. One simple way to reduce the radiation dose is to lower x-ray tube current and/or shorten exposure time during the scans. The downside of this is that image reconstructed by conventional filtered back projection (FBP) method is degraded dramatically due to the excessive quantum noise.
In the past decade, various reconstruction methods have been proposed to improve the low-dose CT (LdCT) image quality (Li et al 2004, Zeng et al 2013, Chen et al 2014, Gao et al 2014, Zhang et al 2014d, Karimi and Ward 2016a, 2016b, Zeng et al 2016c, Chen et al 2017, Liu et al 2017, Xie et al 2017, Li et al 2018). Among them, statistical iterative reconstruction (SIR) methods have shown great potential to reconstruct high quality CT image from the acquired low-dose data. The SIR methods incorporate the statistical noise properties of the measurements and the image priors into the reconstruction. In the SIR reconstruction framework, the image prior in the cost function plays an important role in successful image reconstruction (Wang et al 2006, Chen et al 2008, Sidky and Pan 2008, Wang et al 2009, Huang et al 2011, Tian et al 2011, Xu et al 2012, Zhang et al 2013, Liu et al 2014, Niu et al 2014, Geyer et al 2015, Sun et al 2015, Harms et al 2016, Zeng et al 2016a, Zhang et al 2016b, 2016c, 2017c, 2018, Wu et al 2017, Zeng et al 2017). Meanwhile, it is difficult to find appropriate priors for the whole image (Zoran and Weiss 2011). Alternatively, many methods resort to utilizing local neighboring pixels or the patches from the image as the priors to find the optimal solution. The Markov random field (MRF) (Li 2009) theory provides a convenient and consistent way to model the local image characteristics, such as the edges and the structure features. For instance, two popular MRF priors, including the Gaussian regularization and Huber regularization, have been widely applied in LdCT SIR reconstruction procedures. These generic MRF priors encourage regional smoothness and edge sharpness, but some structures and textures in the desired image could be compromised, which could affect the following tasks, i.e. computer-aided detection/diagnosis (Wang et al 2010, Han et al 2015) and radiomics analysis (Lambin et al 2012, Thawani et al 2017).
With the development of CT imaging techniques, a large number of CT images for clinical diagnosis are available. For example, in the biopsy guidance for lung cancer detection with a sequence of CT acquisition, some high-quality normal-dose CT (NdCT) images are available, which have similar anatomical structures with the following-up LdCT images. Based on this observation, many methods have been proposed to construct priors learned from the previous NdCT image (Chen et al 2008, Yu et al 2009, Xu et al 2012, 2013, Yu et al 2016, Zhang et al 2014a, 2014c, 2016a, 2017d). Ma et al derived the prior image based on the normal-dose induced nonlocal means filter (ndiNLM) (Ma et al 2011) for the LdCT image reconstruction (Ma et al 2012b). Chen et al proposed a prior image constrained compressed sensing (PICCS) method by integrating the prior image into the reconstruction procedure (Chen et al 2012). Stayman et al proposed a prior image registration penalized-likelihood estimation (PIRPLE) method by performing a joint registration of the prior image and a reconstruction of the low-dose data (Stayman et al 2013). Zhang et al proposed a prior image induced nonlocal (PINL) prior to exploit the nonlocal similarity between the current LdCT image and previous NdCT image (Zhang et al 2014b, Zhang et al 2017a). These priors can characterize the local structures of the desired image via learning NdCT information, but registration between the NdCT and LdCT images is usually needed, which is the major limitation for these methods.
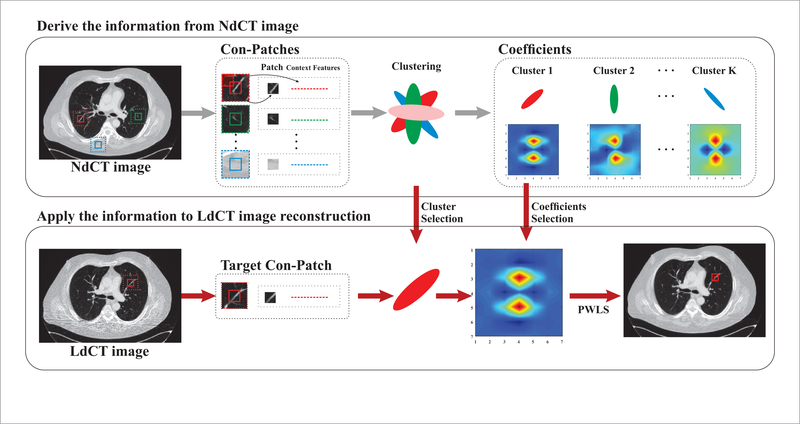
Recently, Zhang et al proposed a texture preserving prior for the LdCT image reconstruction via learning texture information from the segmented NdCT images (Zhang et al 2016a). For the chest CT image, the derived a priori information is varied for the four segmented regions, e.g. lung, fat, muscle and bone. Nevertheless, there are various details in the chest CT images, especially in the lung area, and it might be inadequate to characterize these different structures with the same a priori information. For example, in figure 1, the structures are different for the patches indicated by the red and green boxes in the different lung areas. Additionally, the accuracy of image segmentation has a direct influence on the reconstruction performance. Inspired by the texture preserving prior (Zhang et al 2016a), we propose a region-aware texture preserving (RATP) prior for the LdCT image reconstruction. Specifically, the proposed RATP method first learns the texture information from those patches with similar structures in NdCT image. Instead of the original patch itself, a context patch (con-patch) method (Romano and Elad 2016) is adopted for clustering, which incorporates the patch’s large surroundings into the patch by the context features. The context features can represent the patch’s surroundings in a compact manner and they can be obtained by measuring the similarity of the central patch to its neighborhood patches. Therefore, the con-patch can lead to a better matching for the similar patches because of these extra context features. Then the proposed RATP method utilizes the redundant texture information from these similar patches as a priori knowledge in the LdCT SIR procedure. The advantages of the proposed RATP prior are two-fold. First, compared to Zhang’s method (Zhang et al 2016a), the proposed method can extract more texture information from the NdCT image to characterize the local structures adaptively and preserve more details in the results. Second, neither segmentation nor registration operations is needed in the proposed RATP method, which can reduce the reconstruction bias resulting from the segmentation and mitigates the mismatch between the LdCT and NdCT images. The proposed RATP method was tested by using the patient data, and compared to reconstruction methods like the FBP and regularized SIR methods using Gaussian regularization, Huber regularization, and the original texture preserving regularization. The experiments demonstrate the proposed RATP method can achieve better performance in terms of noise suppression and texture preservation.
Figure 1.
Flowchart of the proposed RATP method.
The remainder of this paper is organized as follows: In section 2, the penalized weighted least-squares (PWLS) model is briefly reviewed and the proposed RATP method is described. Section 3 presents the experimental results. Finally, the conclusions and discussions are given in section 4.
2. Methods
2.1. Brief review of PWLS CT reconstruction
Given the acquired sinogram data y = [y1,y2,...yI]T, x-ray CT imaging is to reconstruct attenuation coefficients μ = [μ1,μ2,...μJ]T from y. Here, I is the number of the detector bins, J is the number of the image voxels, and T denotes the transpose operation. According to the MAP estimator, μ can be derived by minimizing the following PWLS problem:
| (1) |
where A is a projection matrix with size I × J, and its element Aij is the length of intersection of projection ray i and voxel j, and Σ is a weighting matrix (Ma et al 2012a). U(μ) is the regularization term and the hyper-parameter β balances the strength of the fidelity term and the regularization term.
One common choice of the regularization term is based on the MRF model (Li 2009), and it can be expressed as follows:
| (2) |
where index j runs over all voxels in the image domain, Ωj denotes the set of neighbors of voxel j, wjm is the interaction degree between the center voxel j and its neighboring voxel m. φ(·) denotes the potential function.
2.2. Region-aware texture preserving prior
Let P be a patch operator that extracts a patch from the image μ, and Pjμ denotes the jth patch centered at pixel j and its size is . Therefore, equation (2) with the quadratic potential function ((t) = t2) can be written as follows:
| (3) |
where I is a vector of all ones and has the same size with is the jth coefficient vector, diag(wj) converts wj to a diagonal matrix. Generally, wj represents the relationship between voxel μj and patch Pjμ, and it can be viewed as the a priori information about the patch Pjμ.
In the repeated CT scans, the previous NdCT image can be used to promote the LdCT image reconstruction performance. Because the NdCT image and LdCT image share the similar information (i.e. structures and edges), and the high-quality information in the NdCT can be used to characterize the corresponding region-specific structures in the desired LdCT image. Therefore, in this work, a region-aware texture preserving (RATP) prior learning the a priori information from the NdCT images is developed, and it can be defined as follows:
| (4) |
where R(k) denotes the kth region and K is the total number of the regions. is the a priori knowledge for the patches in R(k) and is determined by the previous NdCT image. nd is the abbreviation for normal-dose. can be obtained by a least square regression (Wang et al 2012):
| (5) |
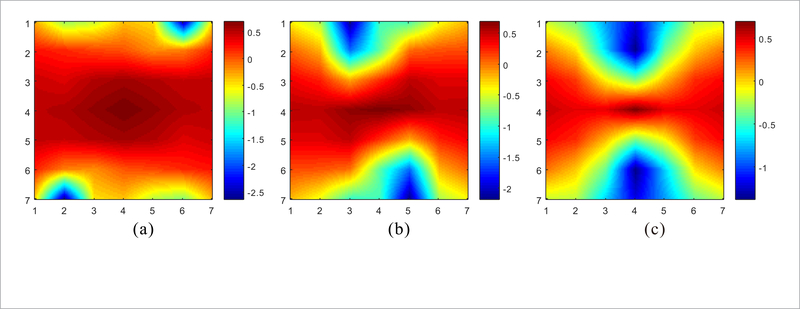
where μnd is the NdCT image. The expression is the sample auto-correlation matrix, and is the sample cross-correlation vector. The flowchart of the proposed RATP method is illustrated in figure 1. There are two stages in the proposed RATP method. The first stage is to derive the texture information from the NdCT image. The con-patches, which will be detailed in the following section, are extracted from the NdCT image firstly, and then they are divided into different clusters. The coefficients for each cluster can be derived based on equation (5). The second stage is to apply the derived information to LdCT image reconstruction. The con-patches from the LdCT image are divided into different clusters in the same way, and the pre-learned coefficients are chosen as a priori knowledge for the patches in each cluster. Based on the cluster results and the derived coefficients, the LdCT image can be reconstructed with equations (1) and (4). In figure 1, three typical structures are taken as examples and the corresponding coefficient sets are displayed by pseudo-color images. Figure 2 shows the Fourier transform of these three coefficient sets by setting the central coefficient to 1. It can be seen that they exhibit spectral patterns corresponding to different image structures. For the patches with similar structures, the corresponding coefficients represent the strong frequency component in them, and the frequency component in the reconstructed image will be emphasized by using these coefficients. Therefore, based on the coefficients pre-learned from NdCT image, the similar structures in LdCT image will be preserved.
Figure 2.
Fourier transform of the three coefficient sets in figure 1 with the central coefficient setting to 1. (a)-(c) are corresponding to the regions indicated by red, greed, blue rectangular boxes, respectively.
2.3. Con-patch for clustering
To effectively learn the region-aware information from the previous NdCT images, the images should be first partitioned into different regions. In this paper, we cluster the patches into different clusters based on the Gaussian mixture model (GMM) model (Zoran and Weiss 2011, Zhang et al 2016b). It is noted that the structures in the image are various, and therefore the image should be partitioned into as many small regions as possible so that the extracted a priori information can adaptively characterize the local structures. One major advantage of this strategy is that it is much more robust than the segmentation strategy (Zhang et al 2016a), because it mitigates the mismatch of the segmented regions in the NdCT and LdCT images. For the patch-based methods, such as the image restoration, large patches can yield better restoration performance (Levin and Nadler 2011, Levin et al 2012), but as the patch size increases, it becomes impractical to find the properly matched patches in the image or the database. To solve this problem, the con-Patch method (Romano and Elad 2016) was proposed to integrate the context features into the patch, and it can benefit from the potential the large patches provide. In this work, to produce better cluster results, the con-Patch method is adopted and it is defined as follows:
| (6) |
where is the context features for patch Pjμ, and λ is a scalar to control the weights of the context features. The context features quantify the correlation between the current patch and its surrounding patches, and they are obtained by dividing the similarity weights of the patches into a histogram of b-bins. The similarity weight between the two patches is calculated as follows:
In this work, the bin number is set to 10. If the correlation between the current patch and its surroundings is high, the similarity weights will be concentrated in the bins with larger values, indicating that the current patch has many co-occurrences in its surroundings. The advantage of the con-patch is that it can encapsulate the information from the surroundings of the current patch and the size of the patch does not significantly increase (Romano and Elad 2016).
2.4. Implementation of PWLS with RATP prior
In our implementation, the previous NdCT image is reconstructed by the FBP method with ramp filter, and then texture information is learned adaptively from the clustered patches with similar structures from the NdCT image. A Gauss–Seidel based strategy (Sauer and Bouman 1993, Fessler 1994, Wang et al 2006) is used to optimize the cost function in equation (1) which is summarized in algorithm 1. The patch size in this study is set to 7 × 7. Compared to the 3 × 3 patch size, more information can be derived from the NdCT image by increasing the patch size. However, for the larger patch size, the extra coefficients are close to zero and have nearly no impact in the experiments. Therefore, the 7 × 7 patch size is adequate in this study. To derive the context features for con-patch, the size of the searching window is set to 17 × 17. Then, we classify the derived con-patches by GMM, and other advanced cluster methods can also be used (Su and Chou 2001, Veenman et al 2002, Rodriguez and Laio 2014).
Algorithm 1.
Algorithm for PWLS-RATP.
| 1: Require: |
| 2: β: Regularization parameter |
| 3: λ, h, b: Parameters for con-patch |
| 4: K: Cluster numbers |
| 5: : Patch size |
| 6: Initialization: |
| 7: |
| 8: |
| 9: Calculate Σ |
| 10: |
| 11: Calculate wnd using equation (5) |
| 12: for each iteration: do |
| 13: for each voxel j: do |
| 14: Choose the coefficients for |
| 15: |
| 16: |
| 17: |
| 18: |
| 19: end for |
| 20: Update Σ |
| 21: |
| 22: end for |
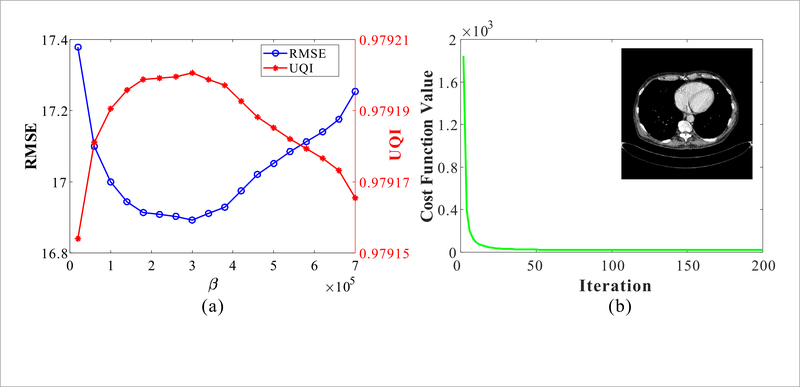
In this study, two quantitative metrics, root mean squared error (RMSE) and universal quality index (UQI) (Zhou and Bovik 2002), were employed to find the optimal β value. Specifically, the optimal β is determined by lowest RMSE and highest UQI measurements. Figure 3(a) shows these two quantitative measurements with different β on patient data. Figure 3(b) plots convergence curve of the cost function in equation (1) with respect to the iteration number. The curve shows that the cost function value decreases monotonically, and after 30 iterations, the value decreases little with further iteration. The result demonstrates that the proposed method can conv erge to a stable solution. In our studies, the reconstruction process is stopped after 30 iterations.
Figure 3.
(a) RMSE and UQI measurements of the proposed PWLS-RATP method with different hyper-parameter β; (b) Cost function values of the proposed PWLS-RATP method with different iterations.
2.5. Comparison methods
To evaluate the performance of the proposed PATP method, the FBP method using ramp filter and the PWLS methods with different regularization, including Gaussian regularization, Huber regularization and the texture preserving (TP) regularization (Zhang et al 2016a), and these PWLS methods are termed as ‘Gaussian’, ‘Huber’ and ‘TP’ in the following experiment. In Gaussian regularization, wjm in equation (3) usually takes the distance information of the neighbors into account and it can be written as follows:
The potential function for Huber regularization is defined as follows:
where θ is a threshold. The TP regularization can be approximately viewed as a special case of the RATP regularization by setting K = 4, which segments the image into four regions.
3. Experiments and results
In this work, the datasets from ‘2016 Low-dose CT Grand Challenge3’ were used to evaluate the performance of the proposed RATP method. The normal-dose CT data were acquired with 120 kilovolts peak (kVp) and 200 effective milliampere second (mAs). In addition, the corresponding CT data with 1/4, 1/8 and 1/16 dose were generated by adding noise to the normal-dose projection data according to the simulation method (Zeng et al 2015). The CT data with 1/8 and 1/16 dose are considered as ultra low-dose cases. In the experiments, the a priori information was extracted from the NdCT images reconstructed by the FBP method.
3.1. Selection of the parameter K
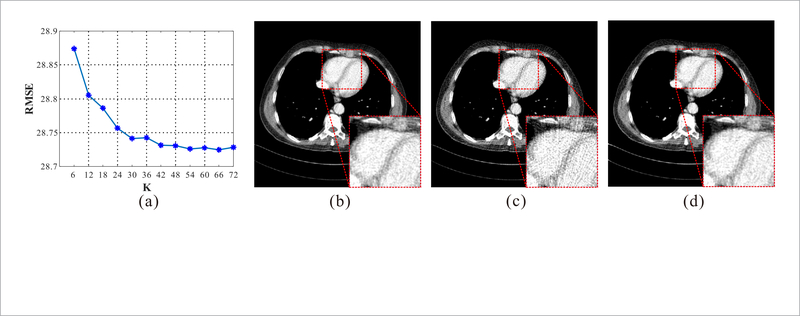
The parameter K determines the number of the regions extracted from the image. Generally, increasing the K can yield better reconstruction results. In this study, because the similar anatomy structures between the LdCT and corresponding NdCT images exist, a large K is not necessary in practice. Here, we evaluated the reconstruction performance with different K value and chose an appropriate K for the LdCT reconstruction. Figure 4(a) depicts the RMSE measurements of the quarter-dose reconstructions by the proposed RATP method with different K value. In the results, the proposed RATP method can produce smaller RMSE value with increased K value. The main reason is that the RATP method can use the information in NdCT images more effectively with increased K. With the observation, the K is set to 54 as default value in the following experiments. In this paper, the experiments were conducted on a PC with i7 3.5GHz CPU, 64Gb RAM and MATLAB 2015b compiler. In the stage to derive the coefficients from the NdCT image, the computational cost increased from 40 s to 190 s as the cluster number increased from 6 to 54. And in the reconstruction stage, since the cluster operation was pre-completed before the reconstruction, the correlation between the computational cost and the cluster numbers was not significant.
Figure 4.
Evaluation of the cluster number K. (a) The RMSE of the quarter-dose reconstructions by the proposed RATP method with different K. (b) The NdCT image reconstructed by FBP method; (c) and (d) the quarter-dose image reconstructed by the FBP method and the proposed RATP method with K = 54, respectively. All the images are displayed in the same window: [ —160 240] HU.
3.2. Texture information from different slices
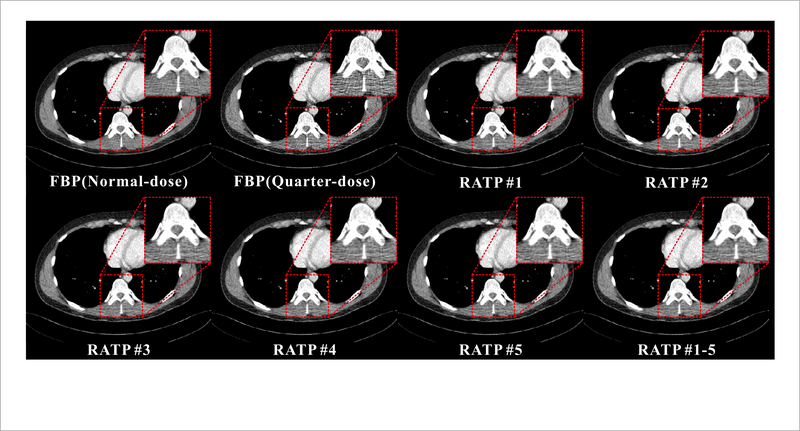
To validate the robustness and adaptability of the proposed RATP method, two strategies can be used to extract texture information from the NdCT images. The first one is to extract texture information from the corresponding NdCT image (#3), and the other one is to extract texture information from the nearby slices (#1, #2, #4 and #5) of the corresponding NdCT image (#3). In this experiment, five selected neighbor slices (#1, #2, #3, #4, #5) of the same patient are used for the LdCT image reconstruction respectively and figure 5 shows the corresponding reconstruction results of slice #3 with NdCT images from the different slices (#1–#5) with the proposed RAPT method. Here, RATP#1 denotes that the texture information is extracted from the slice #1, and the same for the others. And RATP#1–5 denotes that the texture information is extracted from all the normal-dose slices in the proposed RATP method. It can be observed that the reconstruction results with texture information for the nearby slices (RATP#1, RATP#2, RATP#4 and RATP#5) and all the slices (RATP#1–5) are similar to the result from the corresponding NdCT image (RATP#3) in visual inspection by the proposed RATP method.#
Figure 5.
The normal-dose and quarter-dose images reconstructed by the FBP method and the proposed RATP method with the texture information learned from different slices. All the images are displayed in the same window: [ —160 240] HU.
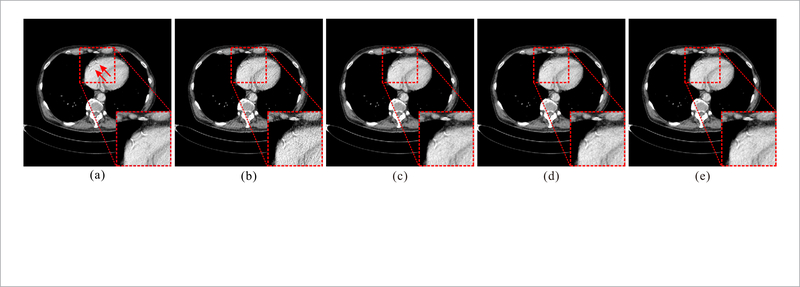
In figure 6, the proposed RATP method is further evaluated by using the texture information derived from the slices that are similar to the current slice but of different patients’ normal-dose scan. Figure 6(a) shows the FBP reconstruction of the normal-dose slice from another patient. It can be observed that there is a mismatch between this image and the NdCT images in figures 4 and 5. Besides, the details indicated by red arrows in figure 6(a) do not exist in the other two images. Figures 6(c)–(e) are the quarter-dose images reconstructed by the proposed RATP method with the texture information from the NdCT images in figures 4, 5, and corresponding NdCT image, respectively. As shown, the proposed RATP method provides similar results by using the texture information from different patients in visual inspection. The RMSE values of the images in figure 6 are 17.77, 15.16, 15.11 and 15.06, respectively. It can be found that although the figures 6(c) and (d) are reconstructed by using the texture information from different patients, the corresponding RMSE values are close to the result by using the texture information form the same patient. The main reason is that for the proposed RATP method, the patch-based strategy mitigates the mismatch between different images, and if the structures are not perfectly matched in the images, the texture information from the similar structures will be adopted instead. Additionally, the data fidelity term in equation (1) also plays a positive and important role in the reconstruction. These two experiments demonstrate the robustness and adaptability of the proposed method and in this work, the texture information from the corresponding NdCT image is used for the RATP method unless explicitly stated.
Figure 6.
Evaluation of the RATP method with the texture information from different patients. (a) The normal-dose image reconstructed by the FBP method; (b) the quarter-dose image reconstructed by the FBP method; (c)-(e) the images reconstructed by the proposed RATP method. The texture information used in (c) and (d) are from two different patients, and the texture information used in (e) is from the same patient. All the images are displayed in the same window: [ — 160 240] HU.
3.3. Comparison results
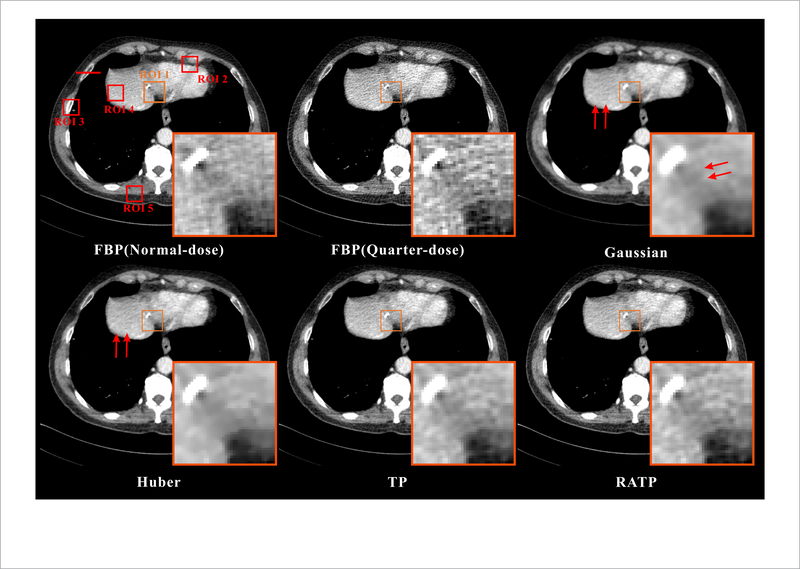
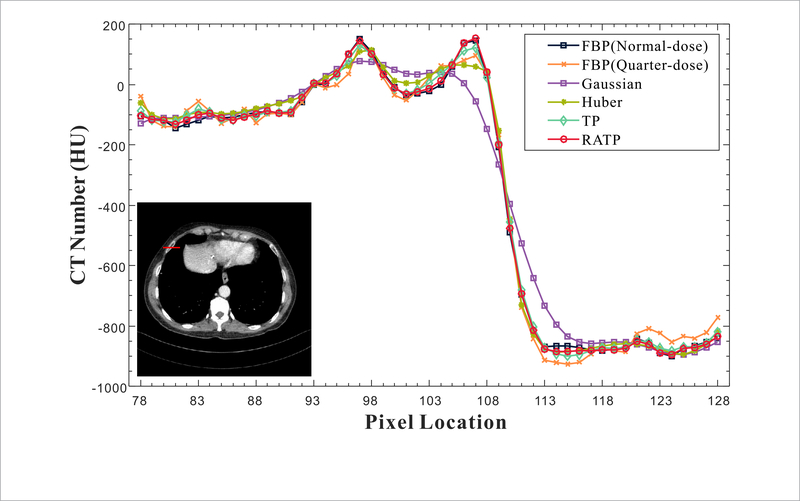
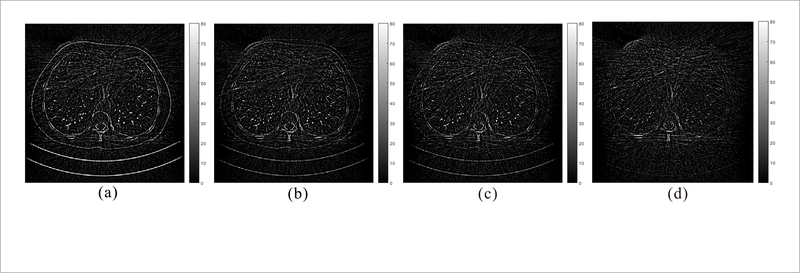
Figure 7 shows the normal-dose and quarter-dose images reconstructed by the different methods. The normal-dose FBP reconstruction result is served as the reference for comparison. In the quarter-dose case, all the PWLS methods significantly suppress noise-induced artifacts in the reconstructed images, wherein the FBP result contain severe noise-induced artifacts. Moreover, the Gaussian method yields a strong isotropic smooth effect and both the edges and structures are smoothed equally without discrimination as indicated by the red arrows in figure 7. The Huber method can well preserve the details with larger intensity change, but the subtle details in flat region are somewhat smoothed inevitably. Moreover, both the TP and proposed RATP are superior to those two generic MRF priors in terms of edges and structures preservation. In figure 7, the magnified local regions indicated by the orange boxes are the Post op/Post RFA defect, which contains detailed and abundant anatomical features, and were selected to demonstrate image quality improvement. By visual inspection, we can see that the proposed RATP method can obtain better structures than the other three methods, indicating the benefits of the incorporating region-aware learning strategy. Figure 8 depicts the horizontal profiles indicated by the red line in figure 7. In the profile comparison results, the noise in the proposed RATP method is much lower than that in the other three methods. The boundary of the proposed RATP result is sharper and more accurate than that from other three methods. The results demonstrate that the proposed RATP method can achieve more noticeable gains than the other competing methods in preserving the edges and details as compared with the reference one, and this is consistent with the visual observation in figure 7. Figure 9 shows the residuals between the normal-dose image and the reconstructed low-dose images reconstructed by the SIR methods. It can be observed that the proposed RATP method can better suppress noise-induced artifacts than other methods with fewer details loss.
Figure 7.
The normal-dose and quarter-dose images reconstructed by the different methods. All the images are displayed in the same window: [ —160 240] HU. The magnified local regions are the Post op/Post RFA defect indicated by the orange boxes.
Figure 8.
Comparisons of the horizontal profiles between the normal-dose image and the low-dose images from the different methods.
Figure 9.
Residuals between the normal-dose image and the quarter-dose images reconstructed by (a) Gaussian, (b) Huber, (c) TP and (d) proposed RATP method, respectively. All the images are displayed in the same window.
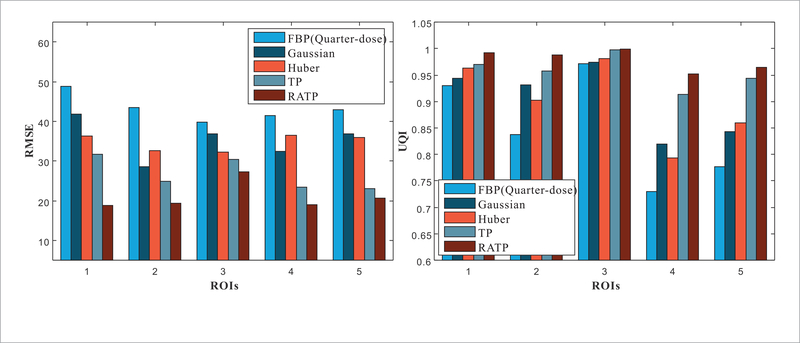
To quantitatively demonstrate the benefits of the proposed RATP method, the five selected ROIs in figure 7 are evaluated with the RMSE and UQI. The RMSE characterizes the reconstruction accuracy and the UQI measures the similarity between the reconstructed images and the reference image. The lower RMSE and the higher UQI indicates that the the better image quality is obtained. Figure 10 shows the corresponding RMSE and UQI measurements, and it shows that the proposed RATP method producing the best RMSE and UQI values in all the cases. This indicates that the proposed RATP methods can reconstruct accurate CT image with efficient noise-induced artifacts reduction. In addition, the haralick texture features (Haralick et al 1973), were extracted from the five selected ROIs in figure 7. Then, the Euclidean distances between the features of the normal-dose image and the reconstructed quarter-dose images were computed, and this can be viewed as a quantitative index in texture analysis where a shorter distance indicates better texture preservation performance. The haralick measurements for the proposed RATP method fall by about 62%, 50%, 32% and 13% compared to the results from the FBP, Gaussian, Huber and TP methods, respectively. The distance results listed in table 1 illustrate that the proposed RATP method obtains strong texture preservation capability than the other competing methods in all cases.
Figure 10.
RMSE and UQI measurements of the selected ROIs in figure 7.
Table 1.
Haralick texture measurements of the five selected ROIs in figure 7 from different methods.
| FBP | Gaussian | Huber | TP | RATP | |
|---|---|---|---|---|---|
| ROI 1 | 1.5774 | 1.4405 | 0.9283 | 0.7193 | 0.6702 |
| ROI 2 | 0.3331 | 0.2581 | 0.2420 | 0.2118 | 0.1632 |
| ROI 3 | 0.1766 | 0.1525 | 0.1399 | 0.1102 | 0.0953 |
| ROI 4 | 0.7063 | 0.3383 | 0.3105 | 0.1961 | 0.1436 |
| ROI 5 | 0.3962 | 0.2346 | 0.1820 | 0.1609 | 0.1376 |
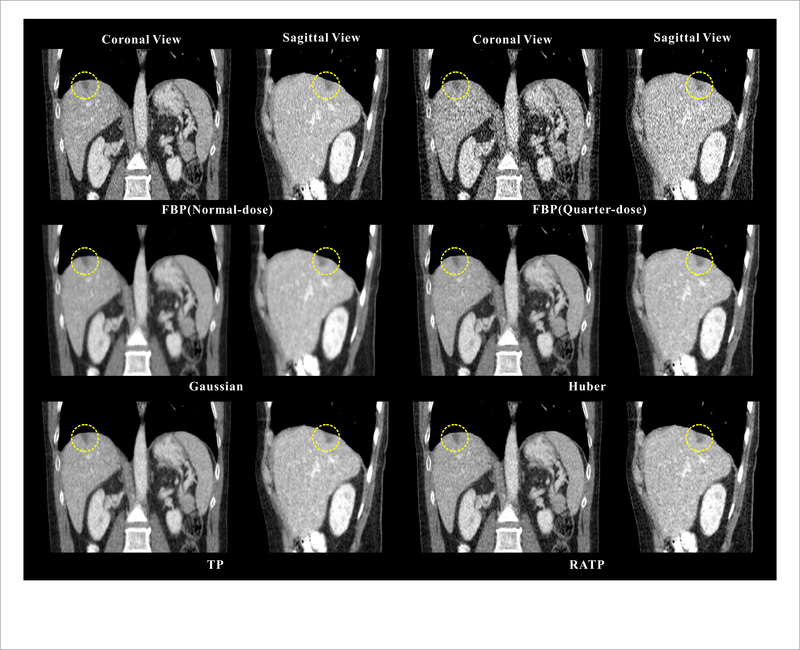
Figure 11 shows the selective coronal and sagittal slices of the reconstructed images from another patient. The yellow ROI in the image indicates a hemangioma in the liver. As seen in the results, the lesions from the proposed RATP method have the sharper anatomical structures with less noise-induced artifacts, indicating that the proposed RATP method is capable of improving the resolution to match the normal-dose one.
Figure 11.
The selective coronal and sagittal slices of the reconstructed images from the different methods. All the images are displayed in the same window: [ —160 240] HU. The yellow circles indicate the hemangioma.
3.4. Ultra low-dose study
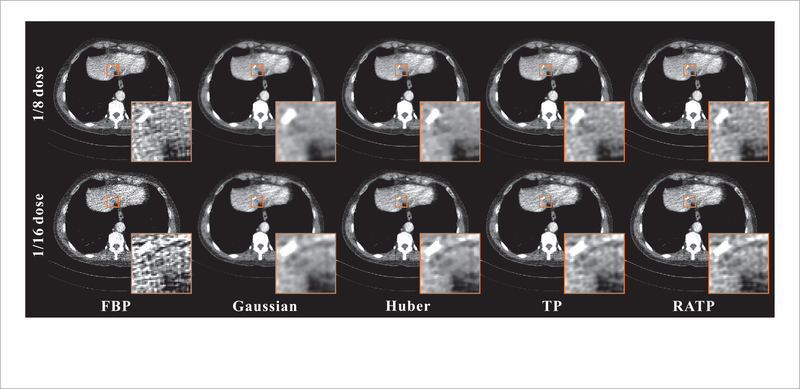
Figure 12 shows the images reconstructed by different methods from the 1/8 and 1/16 dose data. The proposed RATP method can yield better results in terms of the noise-induced artifacts reduction and edge preservation by visual inspection. In order to qualitatively evaluate reconstruction performance in a clinically realistic context, three experienced physicians were invited to score the images in terms of noise reduction and detail/texture preservation. The score ranges from 0 (worst) to 10 (best). Table 2 summarizes the physicians’ scores on the reconstructed image quality under the three different dose levels. The proposed RATP method clearly yields the highest scores, indicating that the RATP method outperformed other methods from the physicians’ point of view. The main reason is that the RATP method can learn more texture-specific information from the NdCT images.
Figure 12.
The images reconstructed by different methods at different dose levels. All the images are displayed in the same window: [−160 240] HU.
Table 2.
Physicians’ scoring of the reconstructed image quality in figure 12 by the different reconstruction methods.
| Dose | Physician | FBP | Gaussian | Huber | TP | RATP |
|---|---|---|---|---|---|---|
| 1/8 | #1 | 5 | 6 | 5 | 7 | 8 |
| #2 | 5 | 6 | 6 | 8 | 9 | |
| #3 | 4 | 6 | 5 | 8 | 9 | |
| Average | 4.67 | 6 | 5.33 | 7.67 | 8.67 | |
| 1/16 | #1 | 2 | 4 | 3 | 5 | 6 |
| #2 | 2 | 4 | 3 | 4 | 5 | |
| #3 | 2 | 3 | 4 | 4 | 5 | |
| Average | 2 | 3.67 | 3.33 | 4.33 | 5.67 | |
4. Discussion and conclusion
In this paper, we incorporated a region-aware texture preserving (RATP) regularization into the PWLS reconstruction framework for LdCT, and the method is evaluated in multiple patient data experiments. CT has been widely used for both diagnostic and therapeutic procedures. In the repeated CT scans, the NdCT images share similar anatomical structures with the sequential LdCT images while the NdCT images have lower noise level and more abundant structures. And the abundant prior information can further promote CT reconstruction performance i.e. prior image induced CT reconstruction (Chen et al 2012, Stayman et al 2013, Zhang et al 2014b, Zhang et al 2016a), and deep learning CT reconstruction (Chen et al 2017, Wu et al 2017, He et al 2018, Würfl et al 2018). In the work, the RATP method adaptively learns the abundant information from the clustered patches with similar patterns in the previous NdCT images and adopts the a priori information for the LdCT reconstruction. Compared with the generic MRF priors, i.e. Gaussian and Huber, the proposed RATP method can adaptively characterize the local structures and textures of the desired image. Compared with the TP method, the proposed RATP method is much more robust and adaptive for the local structures discrimination because more useful information can be derived from the NdCT image and the image segmentation operation is not needed. Compared with the Gaussian mixture MRF method (Zhang et al 2016b), the proposed RATP method provides a more direct way to derive the priors for the desired LdCT image. The idea of using the pre-learned knowledge from the clustered NdCT image patches for LdCT image reconstruction was also adopted in PWLS reconstruction with a union of learned transform (PWLS-ULTRA) (Zheng et al 2018). Based on the pre-learned sparsifying transforms from NdCT image patches, the PWLS-ULTRA exploits the regularization in the transform domain. Compared to the PWLS-ULTRA method, the proposed RATP method derives the MRF coefficients from the clustered NdCT image patches directly, and it has been demonstrated as a simple and effective way to incorporate the a priori knowledge from the NdCT image into the LdCT image reconstruction. Additionally, the con-patch method is adopted for clustering in this study and it efficiently integrates the features from the surroundings of the current patch and can yield better matches for the similar patches, which is another contribution of this work.
There are several limitations to this preliminary study. First, the optimal parameters in the proposed RATP method were determined empirically. It is known that proper parameter selection in all SIR methods is a crucial task to achieve superior image quality. Generally, this should be done by using some adaptive optimization schemes that sweep all the parameter combinations to find the optimal one. Therefore, some automatic/adaptive parameter selection strategies, i.e. deep learning-based method (Shen et al 2018), task-driven method (Gang et al 2017), can be investigated in the future study. Second, in this work, the con-patch method is used to improve the patch cluster performance. The context features are derived based on the similarity weights of the patch and its surrounding patches by measuring the Euclidean distance between them. It should be noted Euclidean distance is one option to quantify the similarity between the patches. And some other meaningful feature descriptors, i.e. Histogram of Oriented Gradient (HOG) (Freeman 1995, Dalal and Triggs 2005) or Local Binary Pattern (LBP) (Ojala and Harwood 1996), can be adopted to quantify the similarity of the patches. The investigation of conpatch method based on these different feature descriptors will be a future topic. Third, the Gaussian mixture model (GMM) was directly used for patch cluster in this study and the comparison of the different cluster methods was not conducted explicitly. How to choose an appropriate cluster method should be discussed in the future study. Fourth, the interactions between the system models and the regularization were not taken into account in this study, which may lead to spatially variant spatial resolution in the reconstructed images. This problem could be solved by adjusting the regularization strength with a scaling factor at each voxel (Cho and Fessler 2015). And the performance of the proposed method will be further improved if such strategy is employed, which will be the subject of future work. Fifth, in this paper, the slices with the similar structures were selected to provide the texture information for the current LdCT image reconstruction. If the selected slices are not similar to the current one with totally different anatomical structures, the derived texture information could not exactly reflect the characteristics in the desired image and some structures would be compromised because of the texture divergence. Therefore, how to automatically retrieve a similar NdCT image from the huge existing images would be an interesting topic in the future study. Last, the datasets used in the experiment were produced by retrospective low-dose simulation. Although the proposed RATP method presents a great potential in LdCT reconstruction, more patients data in practical scenarios should be enrolled in the future study.
In summary, this work demonstrates the potential of the proposed RATP method for LdCT image reconstruction. The proposed RATP method is able to learn region-specific texture information from the available prior NdCT image while needs no registration and segmentation operations in the reconstruction procedure. This is a big advantage over conventional prior image induced LdCT reconstruction methods. While this work focused on the LdCT image reconstruction, the proposed RATP method may also be applied in other CT imaging tasks, such as spectral CT (Zhang et al 2017b), perfusion CT (Zeng et al 2016b, 2016d, Gu et al 2018) and digital breast tomosynthesis (DBT) (Zheng et al 2018b).
Acknowledgments
This work was supported in part by the National Natural Science Foundation of China under Grant U1708261, Grant 81701690, Grant 61701217, Grant 61871383 and Grant 61571214, the Guangdong Natural Science Foundation under Grant 2015A030313271, the Science and Technology Program of Guangzhou, China under Grant CT201510010039 and Grant 201705030009, and the Science and Technology Program of Guangdong, China under Grant 2015B020233008. Z Liang was also supported in part by the National Institutes of Health and the National Cancer Institute under Grant CA206171.
Footnotes
References
- Aberle DR, Adams AM, Berg CD, Black WC, Clapp JD, Fagerstrom RM, Gareen IF, Gatsonis C, Marcus PM, Sicks JD and National Lung Screening Trial Research Team 2011. Reduced lung-cancer mortality with low-dose computed tomographic screening New Engl. J. Med 365 395–409 [DOI] [PMC free article] [PubMed] [Google Scholar]
- Campbell BCV et al. (EXTEND-IA Investigators) 2015. Endovascular therapy for ischemic stroke with perfusion-imaging selection New Engl. J. Med 372 1009–18 [DOI] [PubMed] [Google Scholar]
- Chen GH, Tang J and Leng S 2008. Prior image constrained compressed sensing (piccs): a method to accurately reconstruct dynamic ct images from highly undersampled projection data sets Med. Phys 35 660–3 [DOI] [PMC free article] [PubMed] [Google Scholar]
- Chen GH, Theriault-Lauzier P, Tang J, Nett B, Leng S, Zambelli J, Qi Z, Bevins N, Raval A and Reeder S 2012. Time-resolved interventional cardiac C-arm cone-beam CT: an application of the piccs algorithm IEEE Trans. Med. Imaging 31 907–23 [DOI] [PMC free article] [PubMed] [Google Scholar]
- Chen H, Zhang Y, Kalra MK, Lin F, Chen Y, Liao P, Zhou J and Wang G 2017. Low-dose CT with a residual encoder-decoder convolutional neural network IEEE Trans. Med. Imaging 36 2524–35 [DOI] [PMC free article] [PubMed] [Google Scholar]
- Chen Y, Shi L, Feng Q, Yang J, Shu H, Luo L, Coatrieux J L and Chen W 2014. Artifact suppressed dictionary learning for low-dose CT image processing IEEE Trans. Med. Imaging 33 2271–92 [DOI] [PubMed] [Google Scholar]
- Cho JH and Fessler JA 2015. Regularization designs for uniform spatial resolution and noise properties in statistical image reconstruction for 3D x-ray CT IEEE Trans. Med. Imaging 34 678–89 [DOI] [PMC free article] [PubMed] [Google Scholar]
- Dalal N and Triggs B 2005. Histograms of oriented gradients for human detection Proc. IEEE Conf. on Computer Vision and Pattern Recognition vol 1 pp 886–93 [Google Scholar]
- Fessler JA 1994. Penalized weighted least-squares image reconstruction for positron emission tomography IEEE Trans. Med. Imaging 13 290–300 [DOI] [PubMed] [Google Scholar]
- Freeman WT 1995. Orientation histograms for hand gesture recognition IEEE Int. Workshop on Automatic Face and Gesture Recognition pp 296–301 [Google Scholar]
- Gang GJ, Siewerdsen JH and Stayman JW 2017. Task-driven optimization of fluence field and regularization for model-based iterative reconstruction in computed tomography IEEE Trans. Med. Imaging 36 2424–35 [DOI] [PMC free article] [PubMed] [Google Scholar]
- Gao Y, Bian Z, Huang J, Zhang Y, Niu S, Feng Q, Chen W, Liang Z and Ma J 2014. Low-dose x-ray computed tomography image reconstruction with a combined low-mAs and sparse-view protocol Opt. Express 22 15190–210 [DOI] [PMC free article] [PubMed] [Google Scholar]
- Geyer LL et al. 2015. State of the art: iterative CT reconstruction techniques Radiology 276 338–56 [DOI] [PubMed] [Google Scholar]
- Gu C. et al. Promote quantitative ischemia imaging via myocardial perfusion CT iterative reconstruction with tensor total generalized variation regularization. Phys. Med. Biol. 2018;63:125009. doi: 10.1088/1361-6560/aac7bd. [DOI] [PubMed] [Google Scholar]
- Han F, Wang H, Zhang G, Han H, Song B, Li L, Moore W, Lu H, Zhao H and Liang Z 2015. Texture feature analysis for computer-aided diagnosis on pulmonary nodules J. Digital Imaging 28 99–115 [DOI] [PMC free article] [PubMed] [Google Scholar]
- Haralick RM, Shanmugam K and Dinstein I 1973. Textural features for image classification IEEE Trans. Syst. Man Cybern 3 610–21 [Google Scholar]
- Harms J, Wang T, Petrongolo M, Niu T and Zhu L 2016. Noise suppression for dual-energy CT via penalized weighted least-square optimization with similarity-based regularization Med. Phys 43 2676. [DOI] [PMC free article] [PubMed] [Google Scholar]
- He J, Wang Y, Yang Y, Bian Z, Zeng D, Sun J, Xu Z and Ma J 2018. LdCT-net: low-dose CT image reconstruction strategy driven by a deep dual network Proc. SPIE 10573 105733G [Google Scholar]
- Huang J, Ma J, Liu N, Feng Q and Chen W 2011. Projection data restoration guided non-local means for low-dose computed tomography reconstruction Proc. IEEE Int. Symp. on Biomedical Imaging: from Nano To Macro pp 1167–70 [Google Scholar]
- Karimi D and Ward R 2016a. Reducing streak artifacts in computed tomography via sparse representation in coupled dictionaries Med. Phys 43 1473–86 [DOI] [PubMed] [Google Scholar]
- Karimi D and Ward RK 2016b. Sinogram denoising via simultaneous sparse representation in learned dictionaries Phys. Med. Biol 61 3536–53 [DOI] [PubMed] [Google Scholar]
- Lambin P, Riosvelazquez E, Leijenaar R, Carvalho S, van Stiphout RG, Granton P, Zegers CM, Gillies R, Boellard R and Dekker A 2012. Radiomics: extracting more information from medical images using advanced feature analysis Eur. J. Cancer 48 441–6 [DOI] [PMC free article] [PubMed] [Google Scholar]
- Levin A and Nadler B 2011. Natural image denoising: optimality and inherent bounds Proc. Int. Conf. on Computer Vision and Pattern Recognition pp 2833–40 [Google Scholar]
- Levin A, Nadler B, Durand F and Freeman WT 2012. Patch complexity, finite pixel correlations and optimal denoising Proc. European Conf. on Computer Vision pp 73–86 [Google Scholar]
- Li SZ 2009. Markov Random Field Modeling in Image Analysis (London: Springer; ) [Google Scholar]
- Li S et al. 2018. An efficient iterative cerebral perfusion CT reconstruction via low-rank tensor decomposition with spatial-temporal total variation regularization IEEE Trans. Med. Imaging accepted ( 10.1109/TMI.2018.2865198) [DOI] [PubMed] [Google Scholar]
- Li T, Li X, Wang J and Wen J 2004. Nonlinear sinogram smoothing for low-dose x-ray CT IEEE Trans. Nucl. Sci 51 2505–13 [Google Scholar]
- Liu J et al. 2017. Discriminative feature representation to improve projection data inconsistency for low dose CT imaging IEEE Trans. Med. Imaging 36 2499–509 [DOI] [PubMed] [Google Scholar]
- Liu Y, Liang ZR, Ma JH, Lu HB, Wang K, Zhang H and Moore W 2014. Total variation-stokes strategy for sparse-view x-ray CT image reconstruction (vol 33, p 749, 2014) IEEE Trans. Med. Imaging 33 1004. [DOI] [PMC free article] [PubMed] [Google Scholar]
- Ma J, Huang J, Feng Q, Zhang H, Lu H, Liang Z and Chen W 2011. Low-dose computed tomography image restoration using previous normal-dose scan Med. Phys 38 5713–31 [DOI] [PMC free article] [PubMed] [Google Scholar]
- Ma J, Liang Z, Fan Y, Liu Y, Huang J, Chen W and Lu H 2012a. Variance analysis of x-ray CT sinograms in the presence of electronic noise background Med. Phys 39 4051–65 [DOI] [PMC free article] [PubMed] [Google Scholar]
- Ma J, Zhang H, Gao Y, Huang J, Liang Z, Feng Q and Chen W 2012b. Iterative image reconstruction for cerebral perfusion CT using a precontrast scan induced edge-preserving prior Phys. Med. Biol. 57 7519–42 [DOI] [PMC free article] [PubMed] [Google Scholar]
- Niu S, Gao Y, Bian Z, Huang J, Chen W, Yu G, Liang Z and Ma J 2014. Sparse-view x-ray CT reconstruction via total generalized variation regularization Phys. Med. Biol 59 2997. [DOI] [PMC free article] [PubMed] [Google Scholar]
- Ojala T and Harwood I 1996. A comparative study of texture measures with classification based on feature distributions Pattern Recognit. 29 51–9 [Google Scholar]
- Pouliot J et al. 2005. Low-dose megavoltage cone-beam CT for radiation therapy Int. J. Radiat. Oncol. Biol. Phys 61 552–60 [DOI] [PubMed] [Google Scholar]
- Rodriguez A and Laio A 2014. Clustering by fast search and find of density peaks Science 344 1492–6 [DOI] [PubMed] [Google Scholar]
- Romano Y and Elad M 2016. Con-patch: when a patch meets its context IEEE Trans. Image Process 25 3967–78 [DOI] [PubMed] [Google Scholar]
- Sauer K and Bouman C 1993. A local update strategy for iterative reconstruction from projections IEEE Trans. Signal Process. 41 534–48 [Google Scholar]
- Schmidbauer J, Remzi M, Memarsadeghi M, Haitel A, Klingler HC, Katzenbeisser D, Wiener H and Marberger M 2008. Diagnostic accuracy of computed tomography-guided percutaneous biopsy of renal masses Eur. Urol 53 1003–12 [DOI] [PubMed] [Google Scholar]
- Shen C, Gonzalez Y, Chen L, Jiang SB and Jia X 2018. Intelligent parameter tuning in optimization-based iterative CT reconstruction via deep reinforcement learning IEEE Trans. Med. Imaging 37 1430–9 [DOI] [PMC free article] [PubMed] [Google Scholar]
- Sidky EY and Pan X 2008. Image reconstruction in circular cone-beam computed tomography by constrained, total-variation minimization Phys. Med. Biol. 53 4777–807 [DOI] [PMC free article] [PubMed] [Google Scholar]
- Stayman JW, Dang H, Ding Y F and Siewerdsen JH 2013. Pirple: a penalized-likelihood framework for incorporation of prior images in CT reconstruction Phys. Med. Biol 58 7563–82 [DOI] [PMC free article] [PubMed] [Google Scholar]
- Su MC and Chou CH 2001. A modified version of the K-means algorithm with a distance based on cluster symmetry IEEE Trans. Pattern Anal. Mach. Intell. 23 674–80 [Google Scholar]
- Sun T, Sun N, Wang J and Tan S 2015. Iterative CBCT reconstruction using Hessian penalty Phys. Med. Biol 60 1965–87 [DOI] [PubMed] [Google Scholar]
- Thawani R, Mclane M, Beig N, Ghose S, Prasanna P, Velcheti V and Madabhushi A 2017. Radiomics and radiogenomics in lung cancer: a review for the clinician Lung Cancer 115 34–41 [DOI] [PubMed] [Google Scholar]
- Tian Z, Jia X, Yuan K, Pan T and Jiang S B 2011. Low-dose CT reconstruction via edge-preserving total variation regularization Phys. Med. Biol 56 5949–67 [DOI] [PMC free article] [PubMed] [Google Scholar]
- Veenman CJ, Reinders MJT and Backer E 2002. A maximum variance cluster algorithm IEEE Trans. Pattern Anal. Mach. Intell 24 1273–80 [Google Scholar]
- Wang H, Guo XH, Jia ZW, Li HK, Liang ZG, Li KC and He Q 2010. Multilevel binomial logistic prediction model for malignant pulmonary nodules based on texture features of CT image Eur. J. Radiol 74 124–9 [DOI] [PubMed] [Google Scholar]
- Wang J, Li T and Xing L 2009. Iterative image reconstruction for CBCT using edge-preserving prior Med. Phys 36 252–60 [DOI] [PMC free article] [PubMed] [Google Scholar]
- Wang J, Li T, Lu H and Liang Z 2006. Penalized weighted least-squares approach to sinogram noise reduction and image reconstruction for low-dose x-ray computed tomography IEEE Trans. Med. Imaging 25 1272 [DOI] [PMC free article] [PubMed] [Google Scholar]
- Wang J, Sauer K, Thibault JB, Yu Z and Bouman C 2012. Prediction coefficient estimation in markov random fields for iterative x-ray CT reconstruction Proc. SPIE Med. Imaging 8314 8314444 [Google Scholar]
- Wu D, Kim K, Fakhri GE and Li Q 2017. Iterative low-dose CT reconstruction with priors trained by artificial neural network IEEE Trans. Med. Imaging 36 2479–86 [DOI] [PMC free article] [PubMed] [Google Scholar]
- Würfl T, Hoffmann M, Christlein V, Breininger K, Huang Y, Unberath M and Maier AK 2018. Deep learning computed tomography: learning projection-domain weights from image domain in limited angle problems IEEE Trans. Med. Imaging 37 1454–63 [DOI] [PubMed] [Google Scholar]
- Xie Q, Zeng D, Zhao Q, Meng D, Xu Z, Liang Z and Ma J 2017. Robust low-dose CT sinogram preprocessing via exploiting noise-generating mechanism IEEE Trans. Med. Imaging 36 2487–98 [DOI] [PMC free article] [PubMed] [Google Scholar]
- Xu Q, Yu HY, Mou XQ, Zhang L, Hsieh J and Wang G 2012. Low-dose x-ray CT reconstruction via dictionary learning IEEE Trans. Med. Imaging 31 1682–97 [DOI] [PMC free article] [PubMed] [Google Scholar]
- Xu W, Ha S and Mueller K 2013. Database-assisted low-dose CT image restoration Med. Phys 40 7. [DOI] [PubMed] [Google Scholar]
- Yu H, Zhao S, Hoffman EA and Wang G 2009. Ultra-low dose lung CT perfusion regularized by a previous scan Acad. Radiol 16 363–73 [DOI] [PMC free article] [PubMed] [Google Scholar]
- Yu ZC, Leng S, Li ZB and McCollough CH 2016. Spectral prior image constrained compressed sensing (spectral piccs) for photon-counting computed tomography Phys. Med. Biol. 61 6707–32 [DOI] [PMC free article] [PubMed] [Google Scholar]
- Zeng D, Gao Y, Huang L, Bian Z, Zhang H, Lu L and Ma J 2016a. Penalized weighted least-squares approach for multienergy computed tomography image reconstruction via structure tensor total variation regularization Comput. Med. Imaging Graph 53 19–29 [DOI] [PubMed] [Google Scholar]
- Zeng D. et al. Robust dynamic myocardial perfusion CT deconvolution for accurate residue function estimation via adaptive-weighted tensor total variation regularization: a preclinical study. Phys. Med. Biol. 2016b;61:8135. doi: 10.1088/0031-9155/61/22/8135. [DOI] [PMC free article] [PubMed] [Google Scholar]
- Zeng D, Huang J, Bian Z, Niu S, Zhang H, Feng Q, Liang Z and Ma J 2015. A simple low-dose x-ray CT simulation from high-dose scan IEEE Trans. Nucl. Sci 62 2226–33 [DOI] [PMC free article] [PubMed] [Google Scholar]
- Zeng D, Huang J, Zhang H, Bian Z, Niu S, Zhang Z, Feng Q, Chen W and Ma J 2016c. Spectral CT image restoration via an average image-induced nonlocal means filter IEEE Trans. Biomed. Eng 63 1044–57 [DOI] [PubMed] [Google Scholar]
- Zeng D et al. 2017. Low-dose dynamic cerebral perfusion computed tomography reconstruction via Kronecker-basis-representation tensor sparsity regularization IEEE Trans. Med. Imaging 36 2546–56 [DOI] [PMC free article] [PubMed] [Google Scholar]
- Zeng D et al. 2016d. Cerebral perfusion computed tomography deconvolution via structure tensor total variation regularization Med. Phys 43 2091–107 [DOI] [PubMed] [Google Scholar]
- Zeng G, Li Y and Zamyatin A 2013. Iterative total-variation reconstruction versus weighted filtered-backprojection reconstruction with edge-preserving filtering Phys. Med. Biol 58 3413–31 [DOI] [PMC free article] [PubMed] [Google Scholar]
- Zhang H, Han H, Liang J, Hu Y, Liu Y, Moore W, Ma J and Lu H 2016a. Extracting information from previous full-dose CT scan for knowledge-based bayesian reconstruction of current low-dose CT images IEEE Trans. Med. Imaging 35 860–70 [DOI] [PMC free article] [PubMed] [Google Scholar]
- Zhang H, Han H, Wang J, Ma J, Liu Y, Moore W and Liang Z 2014a. Deriving adaptive MRF coefficients from previous normal-dose CT scan for low-dose image reconstruction via penalized weighted least-squares minimization Med. Phys 41 041916. [DOI] [PMC free article] [PubMed] [Google Scholar]
- Zhang H, Huang J, Ma J, Bian Z, Feng Q, Lu H, Liang Z and Chen W 2014b. Iterative reconstruction for x-ray computed tomography using prior-image induced nonlocal regularization IEEE Trans. Biomed. Eng. 61 2367–78 [DOI] [PMC free article] [PubMed] [Google Scholar]
- Zhang H, Ma J, Wang J, Moore W and Liang Z 2017a. Assessment of prior image induced nonlocal means regularization for low-dose CT reconstruction: change in anatomy Med. Phys 44 e264–78 [DOI] [PMC free article] [PubMed] [Google Scholar]
- Zhang H, Ouyang L, Huang J, Ma J, Chen W and Wang J 2014c. Few-view cone-beam CT reconstruction with deformed prior image Med. Phys 41 527. [DOI] [PubMed] [Google Scholar]
- Zhang H, Ouyang L, Ma J, Huang J, Chen W and Wang J 2014d. Noise correlation in CBCT projection data and its application for noise reduction in low-dose CBCT Med. Phys 41 031906. [DOI] [PubMed] [Google Scholar]
- Zhang H, Wang J, Zeng D, Tao X and Ma J 2018. Regularization strategies in statistical image reconstruction of low-dose x-ray CT: a review Med. Phys 45 e886–907 [DOI] [PMC free article] [PubMed] [Google Scholar]
- Zhang H et al. 2017b. Iterative reconstruction for dual energy CT with an average image-induced nonlocal means regularization Phys. Med. Biol 62 5556–74 [DOI] [PMC free article] [PubMed] [Google Scholar]
- Zhang H, Zeng D, Zhang H, Wang J, Liang Z and Ma J 2017c. Applications of nonlocal means algorithm in low-dose x-ray CT image processing and reconstruction: a review Med. Phys 44 1168–85 [DOI] [PMC free article] [PubMed] [Google Scholar]
- Zhang R, Thibault JB, Bouman C, Sauer K and Hsieh J 2013. Model-based iterative reconstruction for dual-energy x-ray CT using a joint quadratic likelihood model IEEE Trans. Med. Imaging 33 117–34 [DOI] [PubMed] [Google Scholar]
- Zhang R, Ye DH, Pal D, Thibault JB, Sauer KD and Bouman C A 2016b. A gaussian mixture MRF for model-based iterative reconstruction with applications to low-dose x-ray CT IEEE Trans. Comput. Imaging 2 359–74 [Google Scholar]
- Zhang Y, Mou X, Wang G and Yu H 2016c. Tensor-based dictionary learning for spectral CT reconstruction IEEE Trans. Med. Imaging 36 142–54 [DOI] [PMC free article] [PubMed] [Google Scholar]
- Zhang Y, Rong J, Lu H, Xing Y and Meng J 2017d. Low-dose lung CT image restoration using adaptive prior features from full-dose training database IEEE Trans. Med. Imaging 36 2510–23 [DOI] [PubMed] [Google Scholar]
- Zheng JB, Fessler J A and Chan HP 2018b. Detector blur and correlated noise modeling for digital breast tomosynthesis reconstruction IEEE Trans. Med. Imaging 37 116–27 [DOI] [PMC free article] [PubMed] [Google Scholar]
- Zheng X, Ravishankar S, Long Y and Fessler JA 2018. PWLS-ULTRA: an efficient clustering and learning-based approach for low-dose 3D CT image reconstruction IEEE Trans. Med. Imaging 37 1498–510 [DOI] [PMC free article] [PubMed] [Google Scholar]
- Zhou W and Bovik AC 2002. A universal image quality index IEEE Signal Process. Lett 9 81–4 [Google Scholar]
- Zoran D and Weiss Y 2011. From learning models of natural image patches to whole image restoration Proc. Int. Conf. on Computer Vision pp 479–86 [Google Scholar]


