

Abstract
Exposure to poly- and perfluoroalkyl substances (PFAS), ubiquitous and persistent environmental contaminants, could be associated with adverse health outcomes, but there are limited longitudinal data assessing patterns and predictors of exposure during childhood. We quantified concentrations of eight different PFAS in sera collected from women during pregnancy and children at delivery and ages 3 and 8 years in 367 mother-child pairs enrolled in a prospective cohort from 2003–2006. In general, median childhood PFAS concentrations increased from birth to age 3 and then decreased by age 8. Maternal serum PFAS concentrations during pregnancy were strongly correlated with cord serum concentrations (0.76<r<0.94), but were weakly correlated with childhood concentrations (0.12<r<0.30). Several sociodemographic factors were associated with maternal PFAS concentrations, including income, race, and parity. In children, serum PFAS concentrations were associated with maternal age at delivery, race, parity, and child age. Breastfeeding duration was positively associated with childhood PFAS concentrations at ages 3 and 8 years. In addition, stain repellant use was associated with higher perfluorooctanoic acid and perfluorohexane sulfonic acid concentrations at age 8 years. Serum PFAS concentrations are higher during early childhood, a potentially sensitive period of development, and were highest among breastfed children.
Keywords: perfluoroalkyl substances, pregnancy, early childhood
1. Introduction
Poly- and perfluoroalkyl substances (PFAS) are a group of synthetic fluorinated chemicals widely used in industrial and consumer products, including some stain and water resistant coatings, non-stick cookware, food container coatings, floor polish, fire-fighting foam, carpets, apparel, upholstery and industrial surfactants (Agency for Toxic Substances and Disease Registry, 2015; DeWitt, 2015; European Food Safety Authority, 2008). The strong carbon-fluoride bond makes them resistant to environmental degradation. Some PFAS have biological half-lives in humans ranging from 3.8 to 8.5 years, and are ubiquitous in the environment and human sera from both children and adults (Andersen et al., 2013; Apelberg et al., 2007; Darrow et al., 2013; Fei et al., 2010; Fromme et al., 2010; Grandjean et al., 2012; Halldorsson et al., 2012; Hamm et al., 2010; Inoue et al., 2004; Jain, 2013a; Javins et al., 2013; Lee et al., 2013; Olsen et al., 2007; Whitworth et al., 2012; Zhang et al., 2013).
Production of PFAS began in the 1950s and peaked in the 1990s; in the United States, voluntary industry phase-out of perfluorooctane sulfonic acid (PFOS) and perfluorooctanoic acid (PFOA) began in the early 2000s (Bowman, 2015; Environmental Protection Agency, 2000; Fromme et al., 2009; Kato et al., 2011b). Humans are primarily exposed to PFAS through food and water, and, to a lesser extent, via dust exposure (ingestion and inhalation) (Fromme et al., 2009; Lorber and Egeghy, 2011). Human exposures to PFAS have attracted considerable attention in recent years due to PFAS widespread use, persistence in humans and the environment, and association with a variety of health outcomes in humans (Agency for Toxic Substances and Disease Registry, 2015; Antignac et al., 2013; Braun, 2016; Cardenas et al., 2017; DeWitt, 2015; Emmett et al., 2006; Environmental Protection Agency, 2013; European Food Safety Authority, 2008; Fleisch et al., 2017; Lopez-Espinosa et al., 2011; Maisonet et al., 2012; Mora et al., 2017; Office of Health Assessment and Translation and National Toxicology Program, 2016; Shoeib et al., 2005; Starling et al., 2017). Additionally, the detection of PFAS in cord blood strongly shows that these chemicals can cross the placenta and reach the developing fetus (Beesoon et al., 2011; Glynn et al., 2012; Kim et al., 2011; Porpora et al., 2013).
There is limited knowledge about the patterns and determinants of PFAS exposure in mother – child dyads and even less about longitudinal patterns in childhood (Winkens et al., 2017). Longer duration of breastfeeding and higher parity are associated with reduced PFAS concentrations in mothers (Berg et al., 2014; Brantsaeter et al., 2013; Jain, 2013b; Kato et al., 2014; Lauritzen et al., 2016; Manzano-Salgado et al., 2016; Mondal et al., 2014; Morck et al., 2015; Ode et al., 2013; Sagiv et al., 2015) and higher PFAS concentrations in children (Mondal et al., 2014; Papadopoulou et al., 2016; Wu et al., 2015). Prior studies have also identified age (Berg et al., 2014; Harris et al., 2017; Manzano-Salgado et al., 2016; Morck et al., 2015; Sagiv et al., 2015), race (Harris et al., 2017; Kato et al., 2014), contaminated drinking water (DeWitt, 2015; Frisbee et al., 2009; Herrick et al., 2017; Worley et al., 2017), and some features of diet (Berg et al., 2014; Brantsaeter et al., 2013; Halldorsson et al., 2008; Manzano-Salgado et al., 2016; Wu et al., 2015) as predictors of PFAS concentrations in women and children. However, these studies have either focused solely on maternal PFAS concentrations (Berg et al., 2014; Brantsaeter et al., 2013; Halldorsson et al., 2008; Jain, 2013b; Kato et al., 2014; Lauritzen et al., 2016; Manzano-Salgado et al., 2016; Sagiv et al., 2015) or only measured PFAS once in women and children (Berg et al., 2014; Brantsaeter et al., 2013; Harris et al., 2017; Jain, 2013b; Lauritzen et al., 2016; Manzano-Salgado et al., 2016; Morck et al., 2015; Sagiv et al., 2015). Few studies have examined PFAS concentrations in newborns and young children (Harris et al., 2017; Morck et al., 2015; Papadopoulou et al., 2016; Pinney et al., 2014; Schecter et al., 2012; Wu et al., 2015; Ye et al., 2017).
Exposure to PFAS during gestation or childhood is of particular concern because biologically protective mechanisms are not fully developed. Thus, it is important to understand the longitudinal patterns of PFAS concentrations in pregnant women and their children and identify predictors of PFAS exposure. The purpose of this study was to characterize the patterns and predictors of serum PFAS concentrations during pregnancy, at delivery, and during childhood.
2. Methods
2.1. Study Participants
The Health Outcomes and Measures of the Environment (HOME) Study is a prospective pregnancy and birth cohort that enrolled pregnant women living in the Cincinnati, Ohio metropolitan area from March 2003 – January 2006. Participant recruitment and eligibility criteria have been previously described (Braun et al., 2017). About 37% of the 1,263 women eligible were enrolled (n=468) in the study. Of those enrolled, we restricted our analyses to women who delivered singleton births and had a gestational PFAS measurement (n=367), and to singleton children who had at least one PFAS measurement at birth, 3-year, or 8-year visits (n=333). The institutional review board (IRB) of Cincinnati Children’s Hospital Medical Center (CCHMC) approved the study protocol. The Centers for Disease Control and Prevention (CDC) deferred to CCHMC IRB as the IRB of record. Women provided written informed consent to participate in the study for themselves and their children after research assistants explained the study protocols.
2.2. Serum PFAS Concentrations
We collected venous blood samples from mothers at prenatal clinic appointments at 16 and 26 weeks of gestation, and within 48 hours of delivery. Children’s samples included venous cord blood at birth and venous blood at the 3-year and 8-year clinic visits. We measured serum concentrations of eight PFASs: PFOA, PFOS, perfluorononanoic acid (PFNA), perfluorohexane sulfonic acid (PFHxS), 2-(N-methylperfluorooctane sulfonamido) acetic acid (Me-PFOSA-AcOH, also known as MeFOSAA), 2-(N-ethyl-perfluorooctane sulfonamido) acetic acid (Et-PFOSA-AcOH, also known as EtFOSAA), perfluorodecanoic acid (PFDeA, also known as PFDA), and perfluorooctane sulfonamide (PFOSA, also known as FOSA) at the CDC laboratory. As previously described, concentrations of all PFAS chemicals were quantified in 100 μL of serum using online solid phase extraction coupled to high performance liquid chromatography-isotope dilution with tandem mass spectrometry (Kato et al., 2011a; Kato et al., 2014). Low-concentration and high-concentration quality control (QC) samples, reagent blanks, and serum blanks were analyzed with the study samples. The analytical methods for the maternal and child samples were the same as those used to quantify PFAS concentrations in NHANES samples for the 2009−2010 and 2011−2012 NHANES cycles, respectively (Centers for Disease Control and Prevention, 2011; Centers for Disease Control and Prevention, 2013). The limits of detection (LOD) were 0.1 ng/mL (PFOA, PFHxS, PFDA, FOSA, EtFOSAA); 0.2 ng/mL (PFOS); 0.082 ng/mL (PFNA); and 0.087 ng/mL (MeFOSAA). We assigned concentrations below the LOD to a value of LOD /√2 (Supplemental Table S1).
2.3. Predictors of PFAS Concentrations
We examined demographic, perinatal, and environmental factors - assessed with questionnaires, medical chart reviews, and biomarkers - as predictors of gestational and childhood serum PFAS concentrations. We obtained child sex (male, female) and parity (0, 1, >1) from medical charts at delivery. Trained research staff administered standardized questionnaires at each study visit to assess demographic and lifestyle characteristics. These characteristics included: maternal age (years), maternal race (non-Hispanic white, non-Hispanic black, other), household income (per $10 000), marital status (married, unmarried), fish consumption during pregnancy (<once a month, 1–3 times a month, 1–3 times a week, >four times a week) and at ages 3 and 8 years (<once a month, >once a month), and duration of any breastfeeding (months, up to 3 years for index child).
Several prior studies have found that smoking, or tobacco smoke exposure biomarkers, is associated with serum PFAS concentrations in other populations (Jain, 2013b; Lauritzen et al., 2016; Sagiv et al., 2015). Based on this, we included serum cotinine as a potential predictor of maternal PFAS concentrations. In addition, if serum cotinine was associated with PFAS concentrations, then we would want to adjust for smoking or secondhand tobacco smoke exposure in studies examining the health effects of PFAS, since tobacco smoke exposure is associated with many health outcomes. Serum cotinine concentrations were measured in samples taken at 16 and 26 weeks of gestation and the two log10-transformed measures were averaged. Childhood serum cotinine concentrations were measured annually from 1 – 4 years of age, and multiple log10-transformed measures were averaged and used in analyses. At the 8-year visit, we administered questionnaires asking about stain repellent use in the last 3 years (any, none), frequency of non-stick cookware use (almost daily, sometimes, rarely, never), and frequency of microwave popcorn consumption (any, none).
2.4. Statistical Analyses
We calculated the geometric mean (GM), range, interquartile range (IQR), and median of each PFAS at each visit and used boxplots of natural log-transformed serum PFAS concentrations to examine longitudinal patterns of PFAS exposure. When available, we used the 16-week serum PFAS concentrations to assess gestational exposure; if the 16-week sample was missing, we used 26-week concentrations, or birth concentrations if both were missing. Serum PFAS concentrations were natural log-transformed to satisfy normality assumptions. We calculated Pearson correlation coefficients of each serum PFAS concentration between visits (gestational, cord blood, 3-year, and 8-year) and between each of the eight PFAS at each visit.
Using linear regression, we examined the association between gestational natural log-transformed serum PFAS concentrations and maternal factors: age at delivery, household income, natural log-transformed serum cotinine concentration, race, marital status, parity, and fish consumption. In children, we examined the association of cord, 3-year, and 8-year natural log-transformed serum PFAS concentrations with time-varying factors (household income, marital status, parity, childhood fish consumption in the past year, child age, child age as a quadratic term) and time-invariant factors (maternal age at delivery, natural log-transformed childhood mean serum cotinine concentration, race, child sex) using linear mixed models with a random intercept and an unstructured covariance to account for the correlation between repeated PFAS measures. To estimate associations between childhood serum PFAS concentrations at 8-years of age and stain repellent, nonstick cookware, and microwave popcorn use, we used multivariable linear regression models adjusted for maternal age at delivery, maternal race, household income, parity, and child sex.
We examined associations between duration of breastfeeding and natural log-transformed PFAS concentrations in cord, 3-year, and 8-year serum samples using linear mixed models with a random intercept and an unstructured covariance. We estimated GM and percent differences in PFAS concentrations by categories of any breastfeeding (yes, no) and length of breastfeeding (0, >0–3, >3–12, >12 months) using a piecewise linear spline of child age and interaction terms between breastfeeding and age. Duration of breastfeeding was assigned a value of 0 for cord blood samples taken at delivery. We adjusted all models for maternal age at delivery, maternal race, parity, household income, natural log-transformed serum cotinine concentration during pregnancy, and child sex.
For all models, we calculated the percent change in serum PFAS concentration for each predictor by exponentiating the regression coefficients, subtracting 1, and multiplying by 100. We conducted all analyses using R (v3.4.0).
3.0. Results
3.1. Patterns and Variability of PFAS
Median gestational serum concentrations of PFOA, PFOS, PFNA, and PFHxS were higher than concentrations of these PFAS at delivery and age 8 years (Supplemental Table S2, Figure 1). Among children, serum PFOA, PFOS, PFNA, PFHxS, and PFDA concentrations rose between delivery and age 3 years; median PFOA, PFNA, PFHxS, and PFDA concentrations at age 3 years were similar to gestational PFAS concentrations. Children’s PFOA, PFOS, PFNA, PFHxS, and PFDA concentrations declined from age 3 to 8 years.
Figure 1:
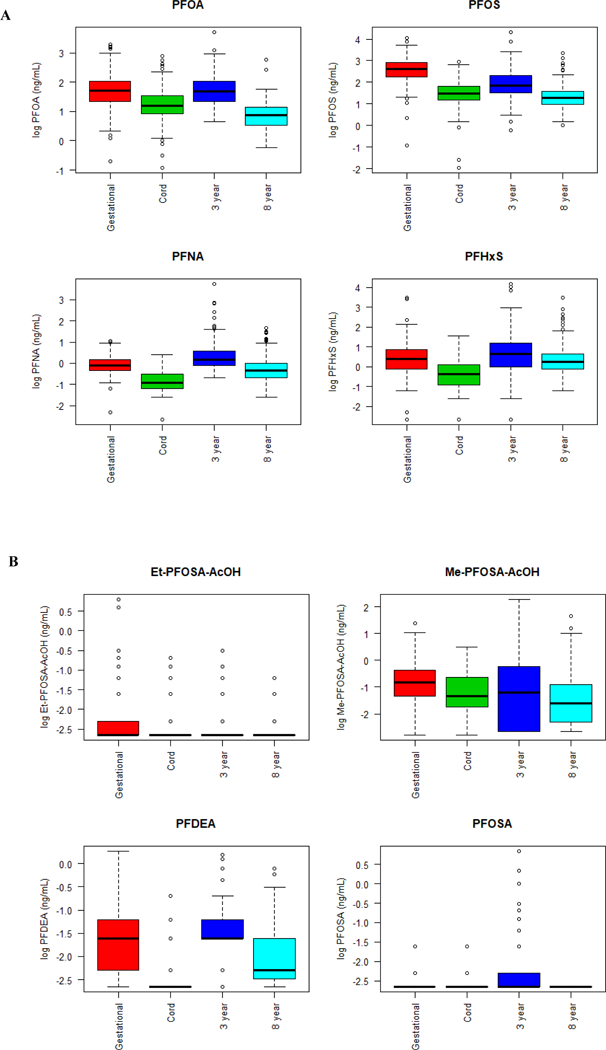
Box-and-whisker plots of natural log transformed serum PFOA, PFOS, PFNA, PFHxS (Panel A), and EtFOSAA, MeFOSAA, PFDA, FOSA (Panel B) concentrations
Because >25% of serum EtFOSAA, MeFOSAA, PFDA, and FOSA concentrations were <LOD at a given visit or had limited variability at each visit (e.g., EtFOSAA concentrations ranged from 0.1 to 0.3 ng/mL at age 8 years), we focused our subsequent analyses on PFOA, PFOS, PFNA, and PFHxS (Supplemental Table S1, Figure 1 B).
Generally, we observed that pairs of longitudinal serum PFAS measurements that were temporally closer were more strongly correlated than pairs of measurements taken further apart (Figure 2 A-D). For instance, serum PFOA concentrations during pregnancy and at delivery were strongly correlated, but gestational concentrations were weakly correlated with concentrations at age 3 and 8 years. At each visit, serum PFOS was strongly correlated with PFOA and PFHxS, serum PFOA was moderately correlated with PFNA and PFHxS, and serum PFNA and PFHxS were weakly or not correlated (Supplemental Figure S1).
Figure 2:
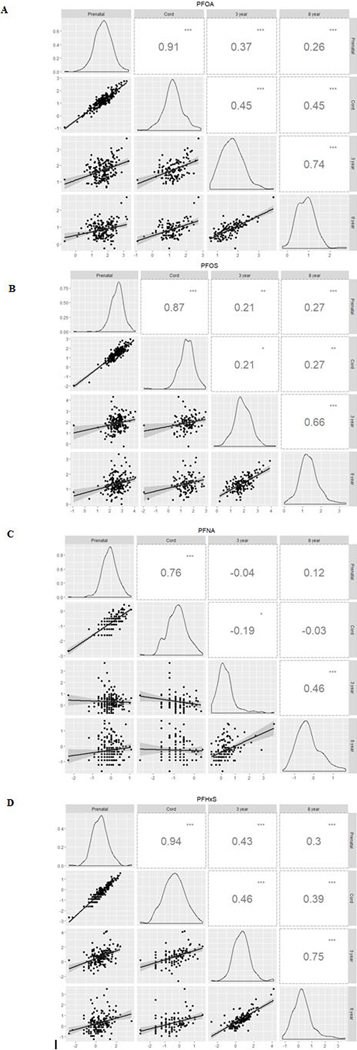
Correlation matrix of natural log-transformed serum PFOA (A), PFOS (B), PFNA (C), and PFHxS (D) concentrations over time. Note: p-values <0.05 (.), <0.01 (*), <0.001 (**), <0.0001 (***).
3.2. Predictors of PFAS
Several maternal factors were associated with serum PFAS concentrations during pregnancy (Table 1). Household income was associated with higher gestational serum PFAS concentrations, particularly for PFOS. Non-Hispanic black women had lower serum PFAS concentrations than non-Hispanic white women. Specifically, non-Hispanic black women had 18% (95% CI: −31, −3.8) and 43% (95% CI: −55, −29) lower serum PFOA and PFHxS concentrations, respectively, compared with white women. Compared with primiparous women, women with one or more child had lower serum PFAS concentrations; however, there were not additional decreases in PFAS concentration after the first child. Marital status, maternal age at delivery, serum cotinine concentrations, and maternal fish consumption were not associated with gestational PFAS serum concentrations.
Table 1:
Adjusted percent difference in HOME Study pregnant women’s serum PFAS concentrations (ng/mL) during gestation according to demographic, perinatal, and maternal factors (N=350)
| Variable | N (%) or Mean+−SD |
PFOA | PFOS | PFNA | PFHxS |
|---|---|---|---|---|---|
| Maternal age | 29 ± 5.8 | −0.78 (−8.0, 7.1) | −2.8 (−9.8, 4.8) | 0.84 (−4.9, 7.0) | −8.7 (−18, 1.3) |
| Serum cotinine concentrations (log10) | −1.2 ± 1.2 | 5.8 (−0.7, 13) | −5.1 (−11, 1.1) | 0.24 (−4.6, 5.3) | 0.11 (−8.3, 9.4) |
| Income (per $10,000) | 5.8 ± 4.3 | 0.63 (−1.2, 2.5) | 1.9 (0.01, 3.8) | 0.92 (−0.53, 2.4) | 1.2 (−1.4, 3.8) |
| Maternal race | |||||
| Non-Hispanic White | 214 (61) | Ref | Ref | Ref | Ref |
| Non-Hispanic Black | 113 (32) | −18 (−31, −3.8) | −12 (−25, 3.3) | −0.72 (−13, 13) | −43 (−55, −29) |
| Other | 23 (7) | −10 (−29, 13) | −11 (−29, 11) | −0.73 (−17, 18) | −13 (−37, 19) |
| Parity | |||||
| 0 | 153 (44) | Ref | Ref | Ref | Ref |
| 1 | 108 (31) | −30 (−39, −21) | −17 (−27, −5.9) | −15 (−23, −6.2) | −18 (−31, −1.7) |
| >1 | 89 (25) | −26 (−36, −14) | −21 (−32, −8.4) | −16 (−25, −5.9) | −17 (−33, 1.6) |
| Marital status | |||||
| Unmarried | 122 (35) | Ref | Ref | Ref | Ref |
| Married | 228 (65) | 1.7 (−16, 23) | −6.3 (−22, 13) | 3.7 (−10, 20) | 3.5 (−20, 34) |
| Maternal fish consumptiona | |||||
| < Once a month | 161 (46) | Ref | Ref | Ref | Ref |
| 1–3 times a month | 116 (33) | 3.0 (−9.0, 17) | 7.7 (−4.7, 22) | 2.2 (−7.1, 13) | 4.2 (−12, 24) |
| 1–3 times a week | 65 (19) | −0.76 (−15, 15) | 6.6 (−8.1, 24) | 2.3 (−8.9, 15) | 10 (−11, 35) |
| > 4 times a week | 8 (2) | 40 (−3.6, 103) | 25 (−13, 81) | −13 (−35, 17) | −6.4 (−44, 57) |
Note: Results are mutually adjusted for all presented variables.
P-values for trend were 0.46 (PFOA), 0.17 (PFOS), 0.98 (PFNA), and 0.49 (PFHxS).
Several factors were associated with serum PFAS concentration in children. Maternal age at delivery was positively associated with serum PFAS concentrations, with the strongest associations observed for PFOA and PFOS (Table 2). Serum PFAS concentrations were not associated with household income or childhood serum cotinine concentrations. Children born to non-Hispanic black women had lower serum concentrations of all four PFAS – ranging from 17% less (95% CI: −30, −2.0) for PFNA to 33% less (95% CI: −48, −14) for PFHxS - compared to children of non-Hispanic white women. Compared to first-born children (i.e. primiparous women), children with one (−14%; 95% CI: −24, −4.0) or more than one (−22%; 95% CI: −31, −10) older sibling had lower serum PFOA concentrations. A similar pattern was observed for PFOS, PFNA, and PFHxS concentrations. Marital status, childhood fish consumption, and child sex were not associated with childhood serum PFAS concentrations. However, serum PFAS concentrations were non-significantly higher in females than males. Child age and child age-squared were associated with childhood serum PFAS concentrations (p-values <0.001).
Table 2:
Percent difference in HOME Study childhood serum PFAS concentrations (ng/mL) at birth, 3 years, and 8 years, according to demographic, perinatal, and maternal factors (N=279 with 544 repeated measures)
| Variable | N (%) or Mean+−SD |
PFOA | PFOS | PFNA | PFHxS |
|---|---|---|---|---|---|
| Maternal age | 30 ± 5.4 | 12 (4.1, 20) | 9.0 (0.76, 18) | 6.9 (−0.75, 15) | 2.1 (−8.5, 14) |
| Serum cotinine concentrations (log10) | −2.3 ± 1.9 | 0.73 (−3.0, 4.6) | 2.5 (−1.8, 7.0) | 0.60 (−3.4, 4.8) | 2.1 (−3.9, 8.5) |
| Income (per $10,000) | 7.2 ± 4.9 | 0.10 (−1.2, 1.4) | 1.1 (−0.39, 2.7) | 1.0 (−0.48, 2.6) | 0.93 (−1.1, 3.0) |
| Maternal race | |||||
| Non-Hispanic white | 188 (67) | Ref | Ref | Ref | Ref |
| Non-Hispanic black | 73 (26) | −23 (−34, −9.5) | −26 (−38, −11) | −17 (−30, −2.0) | −33 (−48, −14) |
| Other | 18 (6) | −12 (−28, 8.3) | −17 (−34, 4.3) | −2.4 (−21, 21) | −14 (−38, 20) |
| Parity | |||||
| 0 | 124 (44) | Ref | Ref | Ref | Ref |
| 1 | 88 (32) | −14 (−24, −4.0) | −7.2 (−19, 5.7) | 2.7 (−9.2, 16) | −7.0 (−23, 12) |
| >1 | 67 (24) | −22 (−31, −10) | −17 (−29, −3.4) | −7.9 (−20, 6.3) | −11 (−28, 11) |
| Marital status | |||||
| Unmarried | 86 (31) | Ref | Ref | Ref | Ref |
| Married | 193 (69) | 6.2 (−9.6, 25) | 0.71 (−16, 21) | −9.3 (−24, 7.8) | 27 (−1.7, 65) |
| Childhood fish consumption | |||||
| < Once a month | 177 (63) | Ref | Ref | Ref | Ref |
| > Once a month | 102 (37) | 0.84 (−8.1, 11) | 3.1 (−8.2, 16) | 5.8 (−6.4, 19) | −0.84 (−14, 15) |
| Child sex | |||||
| Male | 125 (45) | Ref | Ref | Ref | Ref |
| Female | 154 (55) | 8.6 (−1.5, 20) | 4.5 (−6.5, 17) | 7.3 (−3.3, 19) | 9.1 (−6.8, 28) |
Note: Results are mutually adjusted for all presented variables, child age, and child age2.
Serum PFOA and PFHxS concentrations at the 8-year visit were 16% (95% CI: 3.7, 29) and 33% (95% CI: 8.0, 64) higher, respectively, among those who reported having ever used stain repellents compared with those who reported never using stain repellants (Table 3). Consuming microwave popcorn in the past year was associated with 22% (95% CI: −39, −0.25) lower serum PFOA concentrations compared to those who did not consume microwave popcorn. Use of non-stick cookware was not associated with 8-year old serum PFAS concentrations.
Table 3:
Adjusted percent difference in HOME Study childhood serum PFAS concentrations (ng/mL) at age 8 years by exposure to stain repellents, nonstick cookware, and microwave popcorn
| Variable | N (%) | PFOA | PFOS | PFNA | PFHxS |
|---|---|---|---|---|---|
| Stain repellent use in past 3 years | |||||
| No | 103 (54) | Ref | Ref | Ref | Ref |
| Yes | 86 (46) | 16 (3.7, 29) | 13 (−2.7, 30) | −1.8 (−18, 18) | 33 (8.0, 64) |
| Nonstick cookware | |||||
| Never | 11 (6) | Ref | Ref | Ref | Ref |
| Rarely | 16 (8) | −5.5 (−30, 27) | −19 (−45, 19) | 19 (−26, 92) | −36 (−63, 11) |
| Sometimes | 64 (34) | −4.1 (−25, 23) | −21 (−43, 9.6) | 8.3 (−28, 62) | −35 (−59, 3.5) |
| Almost daily | 99 (52) | −7.6 (−27, 18) | −23 (−43, 5.8) | 6.7 (−28, 58) | −34 (−58, 3.5) |
| Microwave popcorn in past year | |||||
| No | 10 (5) | Ref | Ref | Ref | Ref |
| Yes | 180 (95) | −22 (−39, −0.25) | 8.7 (−21, 49) | 7.5 (−27, 60) | −10 (−44, 43) |
Note: All models are adjusted for maternal age, maternal race, income, parity, and child sex.
3.3. Breastfeeding and PFAS Concentrations
Serum concentrations of PFOA, PFOS, and PFNA all rose considerably between delivery and age 3 years among children who were breastfed compared with children who were not breastfed (Figure 3 A, Supplemental Table S3). In addition, serum PFOA, PFOS, and PFNA concentrations remained higher among breastfed children at age 8 years compared to children who were not breastfed. For example, serum PFOA concentrations were 36% (95% CI: 12, 64) and 22% (95% CI: 0.3, 48) higher at age 3 and 8 years, respectively, among children who were breastfed compared to those who were not. PFAS concentrations at both age 3 and 8 years were monotonically related to duration of breastfeeding (Figure 3 B, Supplemental Table S3).
Figure 3:
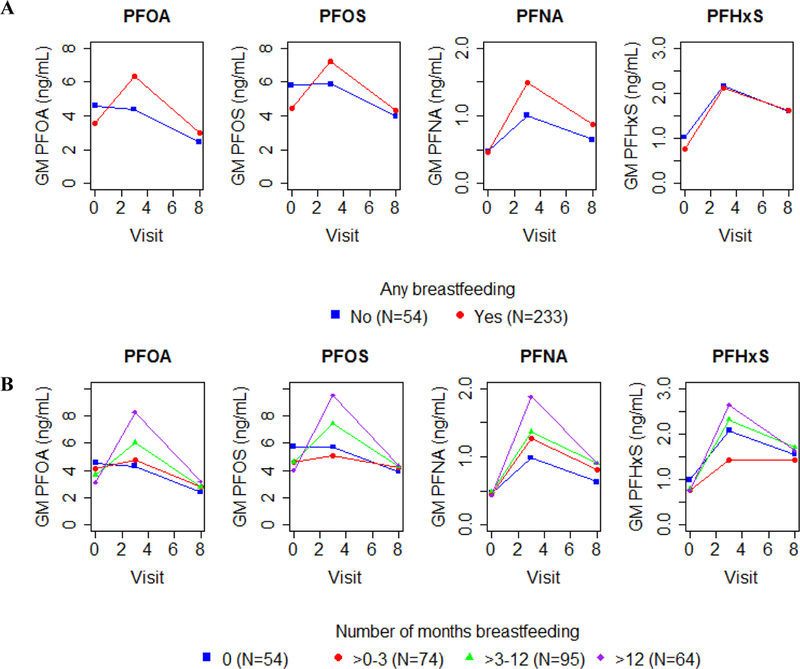
Adjusted GM serum PFAS concentrations (ng/mL) in cord, 3-year, and 8-year serum samples by any breastfeeding (A) and duration of breastfeeding (B) Note: Y-axes differ in each plot. Models are adjusted for gestational serum PFAS concentrations, maternal age, race, parity, household income, serum cotinine concentrations during pregnancy, and child sex
4. Discussion
We assessed the patterns and predictors of serum PFAS concentrations in pregnant women and their children during gestation and over the first 8 years of life. Childhood serum PFAS concentrations increased from delivery to age 3 years and then declined from age 3 to 8 years. These increases from delivery to age 3 years were greatest among children who were breastfed. Children’s concentrations of most PFAS at age 3 years of age were similar to their mothers’ concentrations during pregnancy. Serum PFAS concentrations in pregnant women were strongly correlated with concentrations in cord serum, but less strongly correlated with their children’s concentrations at age 3 or 8 years. In mothers, household income, maternal race, and parity were associated with serum PFAS concentrations. Serum PFAS concentrations in children were associated with maternal age, child age, maternal race, parity, and breastfeeding duration. Additionally, stain repellent use was positively associated with serum PFOA and PFHxS concentrations at age 8 years.
Generally, PFAS concentrations among women and children in the HOME Study were similar to concentrations measured in prior studies conducted in the United States (Harris et al., 2017; Kato et al., 2014; Sagiv et al., 2015; Schecter et al., 2012; Wu et al., 2015), but generally higher than studies conducted in Europe (Berg et al., 2014; Brantsaeter et al., 2013; Cariou et al., 2015; Lauritzen et al., 2016; Manzano-Salgado et al., 2016; Morck et al., 2015; Papadopoulou et al., 2016). However, gestational PFOA concentrations were higher than concentrations observed among pregnant women in the United States at the same time (Braun et al., 2016), which is consistent with another study of school age girls in the Cincinnati, OH area (Pinney et al., 2014). As observed in the current study, prior studies have found that that maternal and childhood PFAS concentrations are positively correlated (Kato et al., 2014; Morck et al., 2015) and that PFAS concentrations (PFOA, PFOS, PFNA, and PFHxS) are correlated with each other (Harris et al., 2017; Manzano-Salgado et al., 2016; Morck et al., 2015; Papadopoulou et al., 2016; Sagiv et al., 2015; Wu et al., 2015).
Previously, Kato et al. (2014) reported similar predictors of gestational serum PFAS concentrations in a subset of women from the HOME Study. Other prior studies examining predictors of PFAS concentrations in pregnant women have observed an inverse association between maternal age and serum PFAS concentrations (Berg et al., 2014; Kato et al., 2014; Manzano-Salgado et al., 2016; Morck et al., 2015; Sagiv et al., 2015). We did not find an association between maternal age and serum PFAS concentrations after adjusting for sociodemographic factors, although our findings for PFOA, PFOS, and PFHxS were in the same direction as prior studies.
In our participants, gestational serum PFAS concentrations were higher among non-Hispanic white women with higher household incomes and more children. Consistent with our findings, prior studies report that black women had lower PFOA, PFOS, PFNA, and PFHxS concentrations than white women (Kato et al., 2014; Sagiv et al., 2015). Prior studies also reported that household income was positively associated with serum PFOA, PFOS, PFNA, and PFHxS concentrations (Brantsaeter et al., 2013; Kato et al., 2014; Sagiv et al., 2015). We observed the strongest positive association between household income and gestational serum PFOS concentrations. It is unclear why maternal race and household income are predictors of serum PFAS concentrations, but these findings may be due to behavioral and lifestyle factors associated with race and socioeconomic status. Consistent with prior studies, we found an inverse association between parity and maternal serum PFAS concentrations (Berg et al., 2014; Brantsaeter et al., 2013; Kato et al., 2014; Manzano-Salgado et al., 2016; Morck et al., 2015; Sagiv et al., 2015).
While fish consumption was previously reported to be positively associated with maternal concentrations of some PFAS (Berg et al., 2014; Brantsaeter et al., 2013; Manzano-Salgado et al., 2016), we only found suggestive evidence of an association between frequent fish consumption and gestational PFAS concentrations. Four studies of Spanish or Norwegian women observed that marine food, fish, or shellfish consumption was associated with higher serum or breast milk concentrations of some PFAS (Berg et al., 2014; Brantsaeter et al., 2013; Manzano-Salgado et al., 2016; Motas Guzmàn et al., 2016). Fish consumption was low among women in our cohort, which might explain why we did not observe this association.
Few studies have examined predictors of childhood PFAS concentrations (Harris et al., 2017; Morck et al., 2015; Papadopoulou et al., 2016; Wu et al., 2015). Of those studies, none found an association with maternal age except for a positive association with MeFOSAA concentrations in one study (Harris et al., 2017). We observed that maternal age was positively associated with childhood serum PFOA and PFOS concentrations. Our finding may be explained by older women having higher cumulative PFAS exposure than other women; thus, children of older women may have had more transplacental exposure than younger women.
We found that children’s PFAS concentrations rose between delivery and age 3 years and then declined between age 3 and 8 years; yet, were still correlated at ages 3 and 8 years. It is not clear if the observed decline is due to the phase out of some PFAS, age-related increases in blood volume, or age-related changes in the relative contributions of different sources of PFAS (Centers for Disease Control and Prevention, 2018; Egeghy and Lorber, 2011). For instance, children’s blood volume would increase by approximately 75% for a child of average weight between 3 and 8 years of age (Pearson, 2003). Moreover, the relative contribution of PFAS from breast milk would change over infancy and early childhood (Domingo and Nadal, 2017). The observed longitudinal patterns of serum PFAS concentrations in the first eight years of life are important to consider when examining early childhood periods of susceptibility to PFAS exposure since age-related variations in exposure may coincide with periods of heightened sensitivity to PFAS exposure.
In our study, childhood serum PFAS concentrations were associated with maternal race and parity, but not with household income. Consistent with our findings, Harris et al. (2017) did not observe an association between family income and childhood PFAS concentrations, except for an inverse association with PFHxS. Harris et al. (2017) also reported that children of black women had lower concentrations of PFOA, PFOS, and PFHxS compared with children of white women. Similar to our findings, Papadopoulou et al. (2016) found that first-born children had higher concentrations of PFOA and PFOS at 3 years of age compared with latter-born children in a Norwegian birth cohort of 112 children. Previous studies have not found associations between childhood PFAS concentrations and fish consumption or child sex (Harris et al., 2017; Morck et al., 2015). Consistent with this we found that childhood fish consumption was not associated with childhood serum PFAS concentrations in our participants. Additional age-specific analyses examining the relative contribution of different PFAS exposures sources could be performed in the future.
At the age 8-year visit, we found that children of mothers who reported ever using stain repellents had higher serum PFOA, PFOS, and PFHxS concentrations. PFOA, PFOS, and PFHxS have been used in stain repellents on carpeting and we speculate that PFAS contaminated dust from treated carpets could be one source of exposure in these children (Beesoon et al., 2012; Betts, 2008). We are not aware of any prior studies that examined stain repellent use and PFAS concentrations in children. However, Harris et al. (2017) found that children who slept in a bedroom with carpeting had higher concentrations of PFOS and PFHxS compared with children who did not sleep in a carpeted bedroom. PFOA has been previously used to coat microwave popcorn bags and has been measured on the surface of the bag and in the vapors after cooking (Begley et al., 2005; Sinclair et al., 2007). We found that children who ate microwave popcorn in the past year had lower serum PFOA concentrations at the 8-year visit compared to those who did not eat popcorn. We did not have information on other PFAS sources such as water and food wraps for other foods at home or in restaurants.
Our finding that longer duration of breastfeeding is associated with higher PFAS concentrations in children is consistent with three prior studies (Mogensen et al., 2015; Papadopoulou et al., 2016; Wu et al., 2015). In our study, increases in PFAS concentrations between birth and 3 years of age were greatest among children who were breastfed except for PFHxS, which may be due to lower excretion rates for PFHxS in breastmilk compared to the other PFAS we examined (Mogensen et al., 2015; Mondal et al., 2014). Elevated PFAS concentrations among children who were breastfed persisted until age 8 years, but the absolute serum concentrations at age 8 years were lower than concentrations at gestation, delivery, or age 3 years. These findings highlight the “weanling’s dilemma,” but do not suggest that women should discontinue breastfeeding their children as the benefits of breastfeeding are likely to outweigh the potential adverse effects of early childhood PFAS exposure (Grandjean and Jensen, 2004). Still, women should not be required to choose between exposure to a potentially toxic chemical and breastfeeding their child.
There are a variety of sources of PFAS exposure in infants and children, in addition to breastmilk, that we were not able to measure in this study. Notably, textiles (i.e. carpeting and clothing) and toys could be treated with PFAS chemicals which could be ingested by mouthing behaviors or accumulate into household dust and ingested or inhaled. Compared to adults who are primarily exposed to PFAS from food, dust ingestion of some PFAS is nearly equivalent to dietary ingestion in children (Egeghy and Lorber, 2011).
Our findings were not consistent for all PFAS examined and we observed some compound specific results. For example, we observed weaker correlations of repeated PFNA measures over time compared to correlations for repeated PFOA measures. Additionally, breastfeeding duration was associated with greater increases in PFOA than PFNA. It is important to note that during the time of sample collection, PFOA was being phased out of production and PFNA production was being increased; this might affect the pattern of correlations we observed (Bowman, 2015; Environmental Protection Agency, 2000).
The pattern of higher PFAS concentrations among non-Hispanic whites, those with higher income, and children who were breastfed suggests the potential for negative confounding in epidemiological studies examining links between PFAS exposure and human health. For instance, breastfeeding is associated with higher childhood PFAS concentrations and better health outcomes in children. Thus, unadjusted associations between childhood PFAS concentrations and health outcomes related to breastfeeding could be attenuated towards the null.
Our study has some limitations. First, many of the predictors used in the analyses were based on self-report, which may result in misclassification. This is of particular concern for some of the childhood predictors, such as fish and microwave popcorn consumption, which were parent-reported. Second, we did not measure other potential sources of PFAS including diet, dust, water source/consumption, or use of PFAS containing products (e.g., stain repellant treated clothing, carpeting, and toys). Third, our results may not be generalizable to pregnant women and their children who live outside the study area; however, concentrations of PFAS in women and children in this study were generally similar to those observed among pregnant women and children in the United States around the same time period. Finally, while our sample size was modest, we measured serum PFAS concentrations in mothers and children at several time points, including potential windows of susceptibility during gestation and childhood. To our knowledge, this is the first study to examine longitudinal trajectories of children’s PFAS concentrations.
4.1. Conclusions
Among children in this cohort, serum PFAS concentrations increased from birth to age 3 years and declined from ages 3 to 8 years; these changes were greatest among breastfed children. We observed that stain repellant use was associated with higher childhood serum PFAS concentrations, suggesting that there may be modifiable sources of PFAS exposure in the home environment. Future studies should consider adjusting for parity, maternal age, race, breastfeeding, and socioeconomic status as potential confounders since they were associated with serum PFAS concentrations and may be associated with various health outcomes.
Supplementary Material
Acknowledgements:
We acknowledge the technical assistance of X. Ye, K. Kato, and J. Tao (Centers for Disease Control and Prevention [CDC]) in measuring the serum concentrations of the biomarkers. Disclaimer: The findings and conclusions in this report are those of the authors and do not necessarily represent the official position of the CDC.
Support: This work was supported by the National Institute of Environmental Health Sciences (NIEHS) R01 ES025214, R01 ES020349, P01 ES011261, and R01 ES014575.
Footnotes
Conflict of Interest: The authors declare no competing financial interest.
References
- Agency for Toxic Substances and Disease Registry, Draft Toxicological Profile for Perfluoroalkyls. In: Agency for Toxic Substances and Disease Registry, (Ed.), Atlanta, GA, 2015. [Google Scholar]
- Andersen CS, et al. , 2013. Prenatal exposures to perfluorinated chemicals and anthropometry at 7 years of age. Am J Epidemiol. 178, 921–7. [DOI] [PubMed] [Google Scholar]
- Antignac JP, et al. , 2013. Occurrence of perfluorinated alkylated substances in breast milk of French women and relation with socio-demographical and clinical parameters: results of the ELFE pilot study. Chemosphere. 91, 802–8. [DOI] [PubMed] [Google Scholar]
- Apelberg BJ, et al. , 2007. Cord serum concentrations of perfluorooctane sulfonate (PFOS) and perfluorooctanoate (PFOA) in relation to weight and size at birth. Environ Health Perspect. 115, 1670–6. [DOI] [PMC free article] [PubMed] [Google Scholar]
- Beesoon S, et al. , 2012. Exceptionally High Serum Concentrations of Perfluorohexanesulfonate in a Canadian Family are Linked to Home Carpet Treatment Applications. Environmental Science & Technology. 46, 12960–12967. [DOI] [PubMed] [Google Scholar]
- Beesoon S, et al. , 2011. Isomer Profiles of Perfluorochemicals in Matched Maternal, Cord, and House Dust Samples: Manufacturing Sources and Transplacental Transfer. Environmental Health Perspectives. 119, 1659–1664. [DOI] [PMC free article] [PubMed] [Google Scholar]
- Begley TH, et al. , 2005. Perfluorochemicals: Potential sources of and migration from food packaging. Food Additives & Contaminants. 22, 1023–1031. [DOI] [PubMed] [Google Scholar]
- Berg V, et al. , 2014. Maternal serum concentrations of per- and polyfluoroalkyl substances and their predictors in years with reduced production and use. Environ Int. 69, 58–66. [DOI] [PubMed] [Google Scholar]
- Betts KS, 2008. Chemical Exposures: Not Immune to PFOS Effects? Environmental Health Perspectives. 116, A290–A290. [DOI] [PMC free article] [PubMed] [Google Scholar]
- Bowman L, FluoroCouncil Companies to Phase out Long-Chain Chemicals by Year’s End. American Chemistry, Washington, 2015. [Google Scholar]
- Brantsaeter AL, et al. , 2013. Determinants of plasma concentrations of perfluoroalkyl substances in pregnant Norwegian women. Environ Int. 54, 74–84. [DOI] [PMC free article] [PubMed] [Google Scholar]
- Braun JM, 2016. Early-life exposure to EDCs: role in childhood obesity and neurodevelopment. Nature Reviews: Endocrinology. [DOI] [PMC free article] [PubMed] [Google Scholar]
- Braun JM, et al. , 2016. Prenatal perfluoroalkyl substance exposure and child adiposity at 8 years of age: The HOME study Obesity (Silver Spring). 24, 231–7. [DOI] [PMC free article] [PubMed] [Google Scholar]
- Braun JM, et al. , 2017. Cohort Profile: The Health Outcomes and Measures of the Environment (HOME) study. Int J Epidemiol. 46, 24. [DOI] [PMC free article] [PubMed] [Google Scholar]
- Cardenas A, et al. , 2017. Plasma Concentrations of Per- and Polyfluoroalkyl Substances at Baseline and Associations with Glycemic Indicators and Diabetes Incidence among High-Risk Adults in the Diabetes Prevention Program Trial. Environ Health Perspect. 125, 107001. [DOI] [PMC free article] [PubMed] [Google Scholar]
- Cariou R, et al. , 2015. Perfluoroalkyl acid (PFAA) levels and profiles in breast milk, maternal and cord serum of French women and their newborns. Environment International. 84, 71–81. [DOI] [PubMed] [Google Scholar]
- Centers for Disease Control and Prevention, 2011. Laboratory Procedure Manual: Polyfluoroalkyl chemicals. [Google Scholar]
- Centers for Disease Control and Prevention, 2013. Laboratory Procedure Manual: Polyfluoroalkyl chemicals. [Google Scholar]
- Centers for Disease Control and Prevention, National Report on Human Exposure to Environmental Chemicals, March 2018 Updated Tables. In: US Department of Health and Human Services, (Ed.), Centers for Disease Control and Prevention,, 2018. [Google Scholar]
- Darrow LA, et al. , 2013. Serum perfluorooctanoic acid and perfluorooctane sulfonate concentrations in relation to birth outcomes in the Mid-Ohio Valley, 2005–2010. Environ Health Perspect. 121, 1207–13. [DOI] [PMC free article] [PubMed] [Google Scholar]
- DeWitt JC, 2015. Toxicological Effects of Perfluoroalkyl and Polyfluoroalkyl Substances. Humana Press. [Google Scholar]
- Domingo JL, Nadal M, 2017. Per- and Polyfluoroalkyl Substances (PFASs) in Food and Human Dietary Intake: A Review of the Recent Scientific Literature. J Agric Food Chem. 65, 533–543. [DOI] [PubMed] [Google Scholar]
- Egeghy PP, Lorber M, 2011. An assessment of the exposure of Americans to perfluorooctane sulfonate: a comparison of estimated intake with values inferred from NHANES data. J Expo Sci Environ Epidemiol. 21, 150–68. [DOI] [PubMed] [Google Scholar]
- Emmett EA, et al. , 2006. Community exposure to perfluorooctanoate: relationships between serum concentrations and exposure sources. J Occup Environ Med. 48, 759–70. [DOI] [PMC free article] [PubMed] [Google Scholar]
- Environmental Protection Agency, EPA and 3M Announce Phase out of PFOS. 2000. Environmental Protection Agency, Perfluorooctanoic Acid (PFOA) and Fluorinated Telomers. Vol. 2014, 2013. [Google Scholar]
- European Food Safety Authority, 2008. Perfluoroctane sulfonate, perfluorooctanoic acid and their salts: Scientific opinion of the panel on contaminants in the food chain. European Food Safety Authority Journal,. 653, 1–131. [DOI] [PMC free article] [PubMed] [Google Scholar]
- Fei C, et al. , 2010. Maternal concentrations of perfluorooctanesulfonate (PFOS) and perfluorooctanoate (PFOA) and duration of breastfeeding. Scand J Work Environ Health. 36, 413–21. [DOI] [PubMed] [Google Scholar]
- Fleisch AF, et al. , 2017. Early-Life Exposure to Perfluoroalkyl Substances and Childhood Metabolic Function. Environmental Health Perspectives. 125, 481–487. [DOI] [PMC free article] [PubMed] [Google Scholar]
- Frisbee SJ, et al. , 2009. The C8 Health Project: Design, Methods, and Participants. Environmental Health Perspectives. 117, 1873–1882. [DOI] [PMC free article] [PubMed] [Google Scholar]
- Fromme H, et al. , 2010. Pre- and postnatal exposure to perfluorinated compounds (PFCs). Environ Sci Technol. 44, 7123–9. [DOI] [PubMed] [Google Scholar]
- Fromme H, et al. , 2009. Perfluorinated compounds--exposure assessment for the general population in Western countries. Int J Hyg Environ Health. 212, 239–70. [DOI] [PubMed] [Google Scholar]
- Glynn A, et al. , 2012. Perfluorinated Alkyl Acids in Blood Serum from Primiparous Women in Sweden: Serial Sampling during Pregnancy and Nursing, And Temporal Trends 1996–2010. Environmental Science & Technology. 46, 9071–9079. [DOI] [PubMed] [Google Scholar]
- Grandjean P, et al. , 2012. Serum vaccine antibody concentrations in children exposed to perfluorinated compounds. JAMA. 307, 391–7. [DOI] [PMC free article] [PubMed] [Google Scholar]
- Grandjean P, Jensen AA, 2004. Breastfeeding and the weanling’s dilemma. American Journal of Public Health. 94, 1075–1075. [DOI] [PMC free article] [PubMed] [Google Scholar]
- Halldorsson TI, et al. , 2008. Dietary Predictors of Perfluorinated Chemicals: A Study from the Danish National Birth Cohort. Environmental Science & Technology. 42, 8971–8977. [DOI] [PubMed] [Google Scholar]
- Halldorsson TI, et al. , 2012. Prenatal exposure to perfluorooctanoate and risk of overweight at 20 years of age: a prospective cohort study. Environ Health Perspect. 120, 668–73. [DOI] [PMC free article] [PubMed] [Google Scholar]
- Hamm MP, et al. , 2010. Maternal exposure to perfluorinated acids and fetal growth. J Expo Sci Environ Epidemiol. 20, 589–97. [DOI] [PubMed] [Google Scholar]
- Harris MH, et al. , 2017. Predictors of Per- and Polyfluoroalkyl Substance (PFAS) Plasma Concentrations in 6–10 Year Old American Children. Environ Sci Technol. 51, 5193–5204. [DOI] [PMC free article] [PubMed] [Google Scholar]
- Herrick RL, et al. , 2017. Polyfluoroalkyl substance exposure in the Mid-Ohio River Valley, 1991–2012. Environmental Pollution. 228, 50–60. [DOI] [PMC free article] [PubMed] [Google Scholar]
- Inoue K, et al. , 2004. Perfluorooctane sulfonate (PFOS) and related perfluorinated compounds in human maternal and cord blood samples: assessment of PFOS exposure in a susceptible population during pregnancy. Environ Health Perspect. 112, 1204–7. [DOI] [PMC free article] [PubMed] [Google Scholar]
- Jain RB, 2013a. Effect of pregnancy on the levels of selected perfluoroalkyl compounds for females aged 17–39 years: data from National Health and Nutrition Examination Survey 2003–2008. J Toxicol Environ Health A. 76, 409–21. [DOI] [PubMed] [Google Scholar]
- Jain RB, 2013b. Effect of Pregnancy on The Levels of Selected Perfluoroalkyl Compounds for Females Aged 17–39 Years: Data From National Health and Nutrition Examination Survey 2003–2008. Journal of Toxicology and Environmental Health, Part A. 76, 409–421. [DOI] [PubMed] [Google Scholar]
- Javins B, et al. , 2013. Circulating maternal perfluoroalkyl substances during pregnancy in the C8 Health Study. Environ Sci Technol. 47, 1606–13. [DOI] [PubMed] [Google Scholar]
- Kato K, et al. , 2011a. Improved selectivity for the analysis of maternal serum and cord serum for polyfluoroalkyl chemicals. J Chromatogr A. 1218, 2133–7. [DOI] [PubMed] [Google Scholar]
- Kato K, et al. , 2011b. Trends in Exposure to Polyfluoroalkyl Chemicals in the U.S. Population: 1999−2008. Environmental Science & Technology. 45, 8037–8045. [DOI] [PubMed] [Google Scholar]
- Kato K, et al. , 2014. Changes in serum concentrations of maternal poly- and perfluoroalkyl substances over the course of pregnancy and predictors of exposure in a multiethnic cohort of Cincinnati, Ohio pregnant women during 2003–2006. Environ Sci Technol. 48, 9600–8. [DOI] [PMC free article] [PubMed] [Google Scholar]
- Kim S, et al. , 2011. Trans-Placental Transfer of Thirteen Perfluorinated Compounds and Relations with Fetal Thyroid Hormones. Environmental Science & Technology. 45, 7465–7472. [DOI] [PubMed] [Google Scholar]
- Lauritzen HB, et al. , 2016. Factors Associated with Maternal Serum Levels of Perfluoroalkyl Substances and Organochlorines: A Descriptive Study of Parous Women in Norway and Sweden. PLoS ONE. 11, e0166127. [DOI] [PMC free article] [PubMed] [Google Scholar]
- Lee YJ, et al. , 2013. Concentrations of perfluoroalkyl compounds in maternal and umbilical cord sera and birth outcomes in Korea. Chemosphere. 90, 1603–9. [DOI] [PubMed] [Google Scholar]
- Lopez-Espinosa M-J, et al. , 2011. Association of Perfluorooctanoic Acid (PFOA) and Perfluorooctane Sulfonate (PFOS) with Age of Puberty among Children Living near a Chemical Plant. Environmental Science & Technology. 45, 8160–8166. [DOI] [PubMed] [Google Scholar]
- Lorber M, Egeghy PP, 2011. Simple Intake and Pharmacokinetic Modeling to Characterize Exposure of Americans to Perfluoroctanoic Acid, PFOA. Environmental Science & Technology. 45, 8006–8014. [DOI] [PubMed] [Google Scholar]
- Maisonet M, et al. , 2012. Maternal Concentrations of Polyfluoroalkyl Compounds during Pregnancy and Fetal and Postnatal Growth in British Girls. Environmental Health Perspectives. 120, 1432–1437. [DOI] [PMC free article] [PubMed] [Google Scholar]
- Manzano-Salgado CB, et al. , 2016. Variability of perfluoroalkyl substance concentrations in pregnant women by socio-demographic and dietary factors in a Spanish birth cohort. Environ Int. 92–93, 357–65. [DOI] [PubMed] [Google Scholar]
- Mogensen UB, et al. , 2015. Breastfeeding as an Exposure Pathway for Perfluorinated Alkylates. Environmental Science & Technology. 49, 10466–10473. [DOI] [PMC free article] [PubMed] [Google Scholar]
- Mondal D, et al. , 2014. Breastfeeding: A Potential Excretion Route for Mothers and Implications for Infant Exposure to Perfluoroalkyl Acids. Environmental Health Perspectives. 122, 187–192. [DOI] [PMC free article] [PubMed] [Google Scholar]
- Mora AM, et al. , 2017. Prenatal Exposure to Perfluoroalkyl Substances and Adiposity in Early and Mid-Childhood. Environmental Health Perspectives. 125, 467–473. [DOI] [PMC free article] [PubMed] [Google Scholar]
- Morck TA, et al. , 2015. PFAS concentrations in plasma samples from Danish school children and their mothers. Chemosphere. 129, 203–9. [DOI] [PubMed] [Google Scholar]
- Motas Guzmàn M, et al. , 2016. Perfluorinated carboxylic acids in human breast milk from Spain and estimation of infant’s daily intake. Science of The Total Environment. 544, 595–600. [DOI] [PubMed] [Google Scholar]
- Ode A, et al. , 2013. Determinants of maternal and fetal exposure and temporal trends of perfluorinated compounds. Environmental Science and Pollution Research. 20, 7970–7978. [DOI] [PubMed] [Google Scholar]
- Office of Health Assessment and Translation, National Toxicology Program, Systematic review of immunotoxicity associated with exposure to perfluorooctanoic acid (PFOA) or perfluorooctane sulfonate (PFOS). In: US Department of Health and Human Services, (Ed.), 2016. [Google Scholar]
- Olsen GW, et al. , 2007. Half-life of serum elimination of perfluorooctanesulfonate,perfluorohexanesulfonate, and perfluorooctanoate in retired fluorochemical production workers. Environ Health Perspect. 115, 1298–305. [DOI] [PMC free article] [PubMed] [Google Scholar]
- Papadopoulou E, et al. , 2016. Exposure of Norwegian toddlers to perfluoroalkyl substances (PFAS): The association with breastfeeding and maternal PFAS concentrations. Environ Int. 94, 687–94. [DOI] [PubMed] [Google Scholar]
- Pearson H, Blood and blood forming tissues. In: Rudolph C, Rudolph A, Eds.), Rudolph’s pediatrics McGraw-Hill, New York, 2003, pp. 1521. [Google Scholar]
- Pinney SM, et al. , 2014. Serum Biomarkers of Polyfluoroalkyl Compound Exposure in Young Girls in Greater Cincinnati and the San Francisco Bay Area, USA. Environmental pollution (Barking, Essex : 1987). 184, 10.1016/j.envpol.2013.09.008. [DOI] [PMC free article] [PubMed] [Google Scholar]
- Porpora GM, et al. , 2013. Placental Transfer of Persistent Organic Pollutants: A Preliminary Study on Mother-Newborn Pairs. International Journal of Environmental Research and Public Health. 10. [DOI] [PMC free article] [PubMed] [Google Scholar]
- Sagiv SK, et al. , 2015. Sociodemographic and Perinatal Predictors of Early Pregnancy Per- and Polyfluoroalkyl Substance (PFAS) Concentrations. Environ Sci Technol. 49, 11849–58. [DOI] [PMC free article] [PubMed] [Google Scholar]
- Schecter A, et al. , 2012. Polyfluoroalkyl Compounds in Texas Children from Birth through 12 Years of Age. Environmental Health Perspectives. 120, 590–594. [DOI] [PMC free article] [PubMed] [Google Scholar]
- Shoeib M, et al. , 2005. Perfluorinated sulfonamides in indoor and outdoor air and indoor dust: occurrence, partitioning, and human exposure. Environ Sci Technol. 39, 6599–606. [DOI] [PubMed] [Google Scholar]
- Sinclair E, et al. , 2007. Quantitation of Gas-Phase Perfluoroalkyl Surfactants and Fluorotelomer Alcohols Released from Nonstick Cookware and Microwave Popcorn Bags. Environmental Science & Technology. 41, 1180–1185. [DOI] [PubMed] [Google Scholar]
- Starling AP, et al. , 2017. Perfluoroalkyl Substances during Pregnancy and Offspring Weight and Adiposity at Birth: Examining Mediation by Maternal Fasting Glucose in the Healthy Start Study. Environ Health Perspect. 125, 067016. [DOI] [PMC free article] [PubMed] [Google Scholar]
- Whitworth KW, et al. , 2012. Perfluorinated compounds in relation to birth weight in the Norwegian Mother and Child Cohort Study. Am J Epidemiol. 175, 1209–16. [DOI] [PMC free article] [PubMed] [Google Scholar]
- Winkens K, et al. , 2017. Early life exposure to per- and polyfluoroalkyl substances (PFASs): A critical review. Emerging Contaminants. 3, 55–68. [Google Scholar]
- Worley RR, et al. , 2017. Per- and polyfluoroalkyl substances in human serum and urine samples from a residentially exposed community. Environment International. 106, 135–143. [DOI] [PMC free article] [PubMed] [Google Scholar]
- Wu XM, et al. , 2015. Serum concentrations of perfluorinated compounds (PFC) among selected populations of children and adults in California. Environ Res. 136, 264–73. [DOI] [PMC free article] [PubMed] [Google Scholar]
- Ye X, et al. , 2017. Per- and polyfluoroalkyl substances in sera from children 3 to 11 years of age participating in the National Health and Nutrition Examination Survey 2013–2014. International Journal of Hygiene and Environmental Health. [DOI] [PMC free article] [PubMed] [Google Scholar]
- Zhang Y, et al. , 2013. Biomonitoring of perfluoroalkyl acids in human urine and estimates of biological half-life. Environ Sci Technol. 47, 10619–27. [DOI] [PubMed] [Google Scholar]
Associated Data
This section collects any data citations, data availability statements, or supplementary materials included in this article.