Abstract
We have recently developed a cancer-specific therapy, photoimmunotherapy, which uses an antibody-IR700 (phototoxic phthalocyanine dye) conjugate to bind to the cell membrane and near-infrared light to induce immediate and highly specific tumor killing in vivo. For monitoring the acute cytotoxic effects of photoimmunotherapy before the tumor begins to shrink, we used 18F-FDG PET before and after this intervention in mice.
Methods:
Photoimmunotherapy was performed by binding panitumumab (anti-HER1)-IR700 to HER1-positive tumor cells (A431), followed by near-infrared light irradiation in vitro and in vivo. The uptake of 18F-FDG in the tumor after photoimmunotherapy was evaluated in cellular uptake studies and PET imaging studies. Serial histologic analyses were conducted after photoimmunotherapy.
Results:
The in vitro cellular uptake of 18F-FDG was reduced as the dose of light increased, and at high light dose (2 J/cm2) the uptake was reduced by more than 99% within 1 h after photoimmunotherapy. In vivo 18F-FDG PET imaging showed that the accumulation of radioactivity in the treated tumors decreased 76% at 75 min after photoimmunotherapy and did not change for 24 h. In contrast, no significant changes were demonstrated in nontreated tumors. None of tumors changed size within 24 h after photoimmunotherapy, although diffuse necrosis was observed in photoimmunotherapy-treated tumors.
Conclusion:
Immediate cytotoxic effects induced by photoimmunotherapy were clearly detected by decreased glucose uptake using 18F-FDG PET even before changes in tumor size became evident. 18F-FDG allows the clinical assessment of the therapeutic effects of photoimmunotherapy earlier than anatomic methods that rely on tumor size.
Keywords: 18F-FDG, PET, monitoring therapy, photoimmunotherapy, acute cytotoxicity
Molecularly targeted cancer therapies offer the promise of more effective tumor control with fewer side effects than conventional cancer therapies (1,2); however, only limited success has thus far been achieved because of relatively weak cytotoxic effects, serious off-target side effects, and the development of escape pathways that lead to resistance (3). We recently reported a new type of molecularly targeted therapy based on a monoclonal antibody (mAb) conjugated to a highly specific photosensitizer that uses a near-infrared (NIR) phthalocyanine dye, IRDye700DX (IR700) (4). The therapeutic potential of IR700 is only evident when conjugated with the mAb and then only after it is bound to the target molecule on the cell membrane. An hour after the administration of the appropriate mAb-IR700 conjugate, NIR light exposure to cells leads to immediate, target-selective necrotic cell death in vitro. When translated in vivo, however, no visible effects on the tumor could be seen until 3–4 d after a single cycle of photoimmunotherapy although there was evidence of tumor softening. This absence of change in tumor size after photoimmunotherapy occurs despite evidence of immediate cell killing based on bioluminescence studies (5). The absence of change in size is reminiscent of stable tumor size after highly effective treatment with imatinib (Gleevec) in gastrointestinal stromal tumors (6). Early monitoring of therapeutic effects is important for determining the effectiveness of treatment in patients and deciding whether additional cycles of mAb-IR700 or NIR light are necessary.
18F-FDG PET, which provides an index of local glucose metabolism, has been used for detecting tumors and for monitoring effects of cancer therapies in preclinical and clinical studies (7–10) because tumors require excessive glucose for growth by Warburg effect (11,12). Rapid reductions in glucose metabolism in cancer can occur within days after the administration of some molecularly targeted therapies even before tumor shrinkage is observed (13,14). To test whether a similar phenomenon occurs in acute photoimmunotherapy, we used 18F-FDG PET before and after this procedure in mice.
MATERIALS AND METHODS
Synthesis of mAb-IR700 (Panitumumab-IR700 and Trastuzumab-IR700) Conjugates
The conjugation of IR700 (water-soluble, silicon-phthalocyanine derivative, IRDye 700DX NHS ester; LI-COR Bioscience) with the mAbs panitumumab (Amgen) and trastuzumab (Genentech Inc.) was performed according to the procedure reported previously (4). Panitumumab is a fully humanized IgG2 mAb directed against the extracellular domain of the human epidermal growth factor receptor 1 (or HER1). Trastuzumab is a recombinant humanized mAb directed against the human epidermal growth factor receptor 2 (or HER2). In brief, each mAb (1 mg, 6.8 nmol) was incubated with IR700 (66.8 mg, 34.2 nmol) in 0.1 M aqueous Na2HPO4 (pH 8.6) at room temperature for 1 h. The mixture was purified with a Sephadex G50 column (PD-10; GE Healthcare). The number of IR700 per mAb was approximately 4.
Cells
HER2 gene–transfected NIH/3T3 (3T3/HER2) cells, HER1expressing A431 cells, and Balb3T3/DsRed cells were used for photoimmunotherapy. Cells were grown in RPMI1640 supplemented with 10% fetal bovine serum and 1% penicillin and streptomycin in tissue culture flasks in a humidified incubator at 37°C in an atmosphere of 95% air and 5% carbon dioxide.
In Vitro Photoimmunotherapy
A431 or 3T3/HER2 cells (5 × 10⁵ cells) were preincubated in 35-mm cell culture dishes and incubated for 16 h at 37°C. Glucose concentration in the medium was adjusted to 5.5 mM. After panitumumab-IR700 or trastuzumab-IR700 was added in each dish at 0 or 10 μg/mL and incubated for 1 h at 37°C, the medium was removed and replaced with fresh culture medium to expose cells to an accurate amount of NIR light without confounding the effects of light absorption from unbound IR700 in the supernatant. Then, cells were irradiated with a red light–emitting diode (light emission wavelength, 670–710 nm; L680–66-60 [Marubeni America Co.]), using a variable-power density ranging from 0 to 2.0 J/cm2 as measured with an optical power meter (PM 100; Thorlabs).
Morphologic changes after in vitro photoimmunotherapy were evaluated with microscopy. A431 or 3T3/HER2 cells (1 × 10⁴) were seeded on glass-bottomed culture dishes and preincubated for 16 h. Transmitted light differential-interference contrast images were obtained with a IX81 microscope (Olympus America) at 1, 3, and 6 h after photoimmunotherapy.
18F-FDG Cell Uptake Study
One, 3, and 6 h after photoimmunotherapy, 18F-FDG (74 kBq/well; Cardinal Health) was administered to the cells and incubated for 30 min at 37°C in the medium containing 5.5 mM glucose. The cells were dissociated from the dishes by incubation with trypsin ethylenediaminetetraacetic acid, washed with phosphate-buffered saline (without calcium or magnesium) twice, and then lysed in 0.2N NaOH. This procedure was followed by the measurement of radioactivity in cells with a NaI scintillation counter (ARC-370 M; Aloka). The protein content was determined using the BCA protein assay kit (Thermo Fisher Scientific Inc.). Cell uptake was presented as percentage dose per milligram of protein.
Animal Model
All procedures were performed in compliance with the Guide for the Care and Use of Laboratory Animals (15) and approved by the local Animal Care and Use Committee. Six- to 8-week old female homozygote athymic nude mice (BALB/c congenic) were purchased from Charles River (National Cancer Institute Frederick). A431 or Balb3T3/DsRed cells (2 · 106 in phosphate-buffered saline) were injected subcutaneously in the right and left shoulders under isoflurane anesthesia, and the experiments were conducted at 5–7 d after cell injection.
In Vivo 18F-FDG PET Imaging Study After Photoimmunotherapy and Histologic Study
Under anesthesia, A431 and Balb3T3/DsRed tumor–bearing mice were administered 18F-FDG (6.2 ± 0.2 and 8.6 ± 0.1 MBq/100 μL in phosphate-buffered saline for A431 and Balb3T3/DsRed mice, respectively) intravenously before photoimmunotherapy treatment. The mice were not fasted for 18F-FDG PET imaging. The mice were anesthetized with 1.5% isoflurane and placed prone on the scanner bed. At 60–80 min after 18F-FDG injection, the mice were imaged using BioPET/CT (Bioscan Inc.). An energy window of 250–700 keV was used. Before reconstruction, the raw data were corrected for random and scattered coincidences and radioactive decay. PET images were reconstructed using a 2-dimensional ordered-subset expectation maximization algorithm. After the PET scans, CT images of the mice were obtained for anatomic comparison using radiographic tube settings of 45 kV and a current of 0.15 mA. Regions of interest were manually drawn on both tumors based on CT images, and maximum standardized uptake values (SUVmax) were calculated.
After the baseline 18F-FDG PET imaging study, panitumumabIR700 (100 μg) was injected into mice intravenously. Fluorescence images before and after photoimmunotherapy were obtained with a Pearl Imager (LI-COR Biosciences) at 24 h after injection of panitumumab-IR700. The tumors on the right shoulder were irradiated with light from a red-light–emitting diode (L680–66-60) at a wavelength of 670–710 nm and a power density of 100 J/cm2. The whole body except for the right-sided tumor was covered with aluminum foil. Fifteen minutes, 7 h, or 23 h later, 18F-FDG (6.3 ± 0.2 and 8.6 ± 0.1 MBq for A431 and Balb3T3/DsRed tumor– bearing mice, respectively) was administered, and PET images were acquired 1 h after 18F-FDG injection. The same mice were used for 8- and 24-h groups. Leftover radioactivity of 18F-FDG injected for the 1.25-h scan prevented rescanning of the same mice at the 8-h time point because of the relatively long half-life of 18F; therefore, another group of mice was used for the 1.25-h group. Mice were returned to cages between scans and allowed to move freely without anesthesia.
To evaluate serial histologic changes immediately after photoimmunotherapy, a microscopy study was performed (BX-61; Olympus America). A431 and Balb3T3/DsRed tumors were harvested in 10% formalin before and at 1, 8, and 24 h after 100 J/cm2 of photoimmunotherapy. Serial 10-μm slice sections were fixed on 2 glass slides, followed by hematoxylin and eosin staining.
Statistical Analysis
Quantitative data were expressed as mean ± SEM. Means were compared using 2-way factorial ANOVA, followed by the Dunnett test for in vitro cell uptake studies and by Tukey–Kramer for relative changes of SUVmax. P values of less than 0.01 were considered statistically significant.
RESULTS
In Vitro 18F-FDG Cell Uptake Study After Photoimmunotherapy
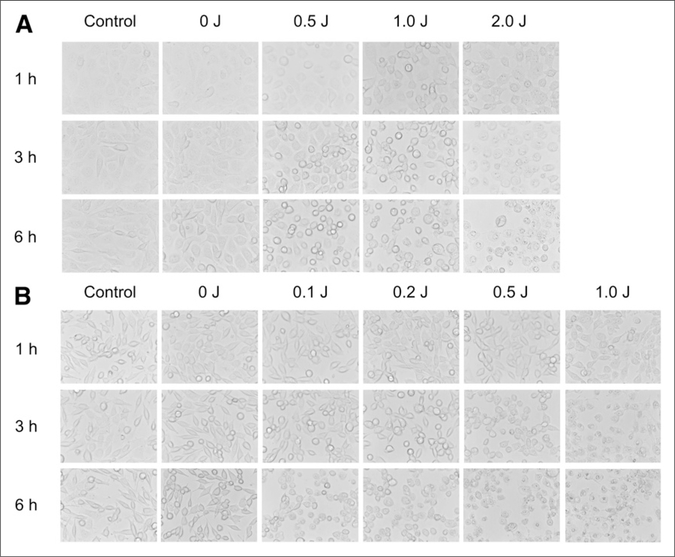
Microscopic changes of A431 cells after photoimmunotherapy are shown in Figure 1A. After a 1-h incubation of panitumumab-IR700, NIR light induced cellular swelling, bleb formation, and rupture of vesicles representing necrotic cell death, as reported previously (4). The change of cell morphology was remarkable in groups treated with a high light dose and in the late time point after photoimmunotherapy. Light exposure without panitumumab-IR700 or no light exposure with administration of panitumumabIR700 showed minimal effects on cell morphology. Similar results were obtained in 3T3/HER2 cells treated by trastuzumab-IR700 and NIR light with similar controls (Fig. 1B).
FIGURE 1.
In vitro microscopy studies on A431 cells (A) and 3T3/HER2 cells (B) after photoimmunotherapy. In both cell lines, excitation light induced cellular swelling, bleb formation, and rupture of vesicles representing necrotic cell death. Change of cell morphology correlated with dose of light and also increased over time after photoimmunotherapy.
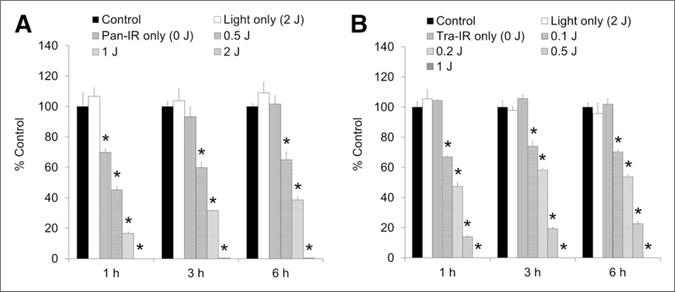
The cellular uptake of 18F-FDG on A431 cells after photoimmunotherapy was reduced in a NIR light dosedependent manner (Fig. 2A). Panitumumab-IR700 itself (without light exposure) slightly (30%) inhibited the uptake of 18F-FDG at 1 h after photoimmunotherapy; uptake was recovered to control levels by 3 h. In the groups exposed to 0.5 and 1.0 J/cm2, the suppression of 18F-FDG uptake induced by excitation light was also gradually regained with time; however, a high dose of light (2 J/cm2) exposure completely suppressed the 18F-FDG uptake for 6 h. Similar results were obtained for 3T3/HER2 cells with trastuzumab-IR700 (Fig. 2B), however, 18F-FDG uptake was not influenced by trastuzumab-IR700 itself; moreover, the reduction of 18F-FDG uptake by photoimmunotherapy with trastuzumab-IR700 was maintained for 6 h at all power density.
FIGURE 2.
In vitro 18F-FDG cell uptake studies on A431 cells (A) and 3T3/HER2 cells (B) after photoimmunotherapy. In both cell lines, the uptake of 18F-FDG was reduced in NIR light dose-dependent manner. High light doses completely (>99%) shut down glucose metabolism. Data are represented as mean ± SEM (n = 4 wells). *P < 0.01, compared with control group, Dunnett test.
In Vivo 18F-FDG PET Imaging After Photoimmunotherapy
We conducted the in vivo 18F-FDG PET imaging study in A431 tumor–bearing mice, not in 3T3/HER2 mice. This is because trastuzumab, but not panitumumab, showed minor therapeutic effects in vivo by itself on our previous study (4).
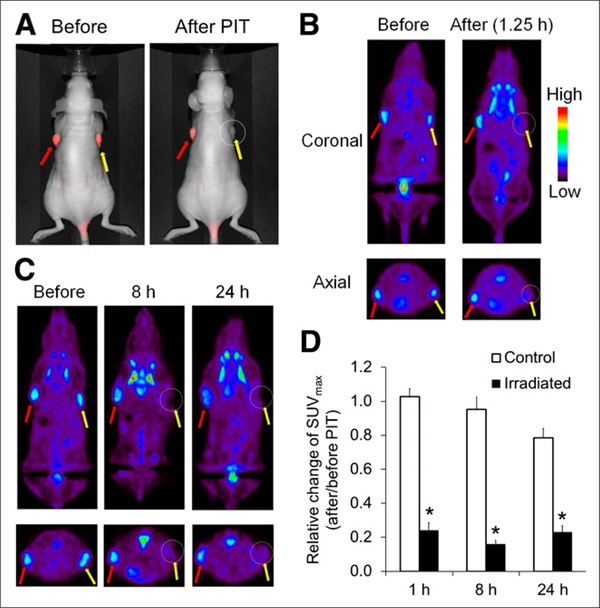
The results of 18F-FDG PET imaging in mice treated by photoimmunotherapy are summarized in Figure 3. A431 tumors growing on both shoulders were selectively detected with IR700 fluorescence at 24 h after injection of panitumumab-IR700 (Fig. 3A). After photoimmunotherapy, fluorescence signals on irradiated tumors almost completely disappeared, whereas those on the nonirradiated tumors were unchanged. A431 tumors under no treatment were also clearly visualized by 18F-FDG (Fig. 3B). On the other hand, photoimmunotherapy resulted in a significant decrease of radioactivity signal in irradiated tumors just 1.25 h after treatment (Fig. 3B). The quantitative data analysis of relative change of SUVmax (the SUVmax ratios after and before photoimmunotherapy) suggested that there was a significant difference between nonirradiated and irradiated tumors (1.03 ± 0.05 and 0.24 ± 0.04 at 1.25 h, respectively; P < 0.01, Fig. 3D). The effect of photoimmunotherapy on SUVmax was sustained for at least 24 h (0.16 ± 0.02 and 0.23 ± 0.04 on irradiated tumors at 8 and 24 h, respectively, Figs. 3C and 3D). The tumor uptake of 18F-FDG in the nonirradiated tumors was unchanged for 8 h (0.95 ± 0.07); however, it was slightly decreased at 24 h (0.79 ± 0.05) probably because of scattered NIR light that crossed over from the irradiated side, repeated handlings, and brief exposures to anesthesia. Sizes of both irradiated and nonirradiated tumors did not show noticeable changes at 24 h after photoimmunotherapy.
FIGURE 3.
In vivo 18F-FDG PET imaging before and after photoimmunotherapy. Panitumumab-IR700 was injected intravenously into mice bearing A431 (HER1-positive) tumors on both shoulders. Photoimmunotherapy was performed only in tumors on right shoulders 24 h after injection of panitumumab-IR700. (A) In vivo fluorescence images of IR700 in mice bearing A431 tumors on both shoulders. Fluorescence signals of treated tumors (right side: circled; yellow arrow) were almost completely absent after photoimmunotherapy, whereas those on covered side (left side: red arrow) were unchanged. (B and C) 18F-FDG PET images were acquired 1.25, 8, and 24 h after photoimmunotherapy in mice bearing A431 tumors. Photoimmunotherapy resulted in significant decrease of 18F-FDG uptake within only irradiated tumors (right side: circled; yellow arrow) beginning 1.25 h after treatment. This effect was sustained for at least 24 h. (D) Quantitative data analysis on relative change of SUVmax (after and before photoimmunotherapy). Data are represented as mean ± SEM (n = 4–6 mice). *P < 0.01, compared with control group, Tukey–Kramer test. PIT = photoimmunotherapy.
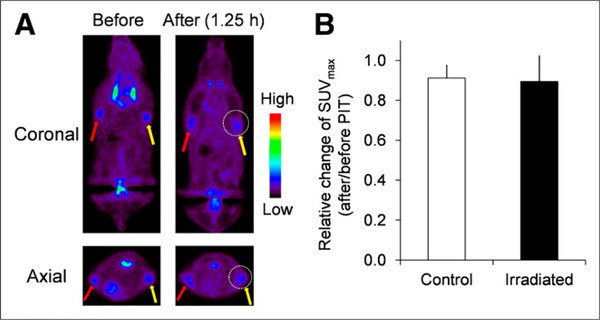
As a control, the 18F-FDG PET imaging study was conducted in non–HER1-expressing Balb3T3/DsRed tumor– bearing mice before and after photoimmunotherapy with panitumumab-IR700. Any significant decrease of 18F-FDG uptake in Balb3T3/DsRed tumors after photoimmunotherapy was not observed (Figs. 4A and 4B).
FIGURE 4.
In vivo 18F-FDG PET imaging before and after photoimmunotherapy in target-negative animal model. (A) 18F-FDG PET images were acquired 1.25 h after photoimmunotherapy with panitumumab-IR700 in Balb3T3/DsRed tumor (HER1-negative)–bearing mice. (B) Quantitative data analysis on relative change of SUVmax (after and before photoimmunotherapy). Data are represented as mean ± SEM (n= 4–6 mice). Uptake of 18F-FDG was not changed before and after photoimmunotherapy. PIT = photoimmunotherapy.
Histologic Analysis
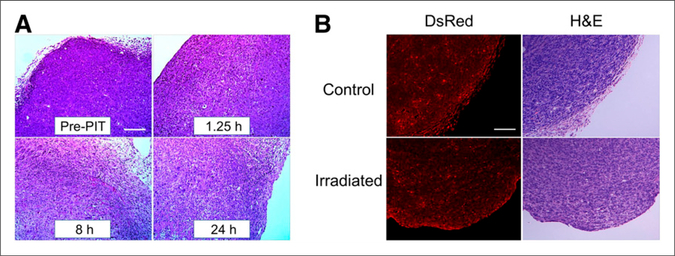
Microscopic evaluation of treated A431 tumors revealed diffuse necrosis and microhemorrhage, with scattered clusters of damaged tumor cells after photoimmunotherapy using 100 J/cm2. Necrotic damage became more intense at longer times after NIR light (Fig. 5A). On the other hand, photoimmunotherapy with panitumumab-IR700 did not affect the histology of non–HER1-expressing Balb3T3/ DsRed tumors (Fig. 5B).
FIGURE 5.
Histologic findings immediately after photoimmunotherapy. (A) Histologic specimens of A431 tumors before and 1.25, 8, and 24 h after photoimmunotherapy with 100 J/cm2 are shown. All specimens are stained with hematoxylin and eosin. A few scattered clusters of damaged tumor cells are seen within background of diffuse cellular necrosis and microhemorrhage at all time points after photoimmunotherapy. (B) Histologic specimens of Balb3T3/DsRed tumors and control tumors at 1.25 h after photoimmunotherapy. No obvious damage was observed. Scale indicates 50 μm. H&E = hematoxylin and eosin; PIT = photoimmunotherapy.
DISCUSSION
The results of this study demonstrate that photoimmunotherapy almost completely shut down glucose metabolism of tumor cells in vitro. 18F-FDG PET imaging showed a greater than 75% decrease of SUVmax of in vivo tumors even 1.25 h after photoimmunotherapy; however, tumor size and shape were unchanged. This decreased glucose uptake lasted up to 24 h after photoimmunotherapy, indicating a successful and prolonged response to the photoimmunotherapy.
As shown by histology, photoimmunotherapy induces rapid and profound damage to the outer and inner membrane structures of target cells, where the mAb-IR700 is bound, leading to necrotic cell death. This cytotoxic effect of photoimmunotherapy was induced in a dose-dependent manner for both the mAb-IR700 conjugate and light exposure. Additionally, photoimmunotherapy induced diffuse necrosis in a NIR light dose-dependent manner in vivo (5). The histologic changes showing necrosis readily explain the decreased 18F-FDG uptake.
NIR light exposure totally inhibited 18F-FDG uptake in A431-cultured cells treated with panitumumab-IR700 in vitro. However, panitumumab-IR700 alone slightly influenced the 18F-FDG uptake by A431 cells because panitumumab itself shows a blocking effect of human epidermal growth factor receptor signaling (16), resulting in diminished glucose metabolism even after only a short incubation.
A subtle increase of 18F-FDG uptake after an initial rapid decline in the irradiated tumors was observed 8–24 h after photoimmunotherapy probably because some tumor cells survived the initial photoimmunotherapy and began to regrow. Tumor recurrence was observed in incompletely treated mice after only a single administration of mAb-IR700 followed by a single light exposure; however, repeated NIR exposures totally eradicated the tumor (17).
In general, 18F-FDG can visualize a variety of cancers such as lung, breast, and colorectal (18,19). 18F-FDG PET imaging is useful as a general-purpose tool for estimating a therapeutic effect. We have already confirmed that photoimmunotherapy can be combined with several different targeting antibodies directed at a variety of tumor types (HER1, HER2, prostate specific membrane antigen–expressing tumors) and, thus, 18F-FDG PET may be a useful indicator of treatment success for deep tumors regardless of the specific antibody used in the conjugate (4). In comparison to recently developed phototherapy approaches using ultraviolet C (UVC) light (20,21), photoimmunotherapy uses NIR light, which can physically penetrate and treat tumors deeper within tissues. Thus, UVC phototherapy with fluorescent protein monitoring is limited to superficial structures, whereas 18F-FDG PET can noninvasively depict and monitor the entire extent of disease anywhere in the human body after therapy.
18F-FDG PET has been clinically established as a response biomarker for monitoring cytotoxic or cytoreductive cancer therapies (7,8). Many researchers have reported the early reduction in PET signal after treatment such as radiotherapy, immunotherapy, chemotherapy, and traditional photodynamic therapy; however, effects usually take days to weeks to manifest and even then, the reductions can range from 20% to 100% in rare cases (22–24). Photodynamic therapy using ATX-S10(Na) as a photosensitizer did not affect the 18F-FDG uptake (22). In contrast, photoimmunotherapy reduced the glucose uptake by more than 75% at 1.25 h. This incomplete reduction is partly because photoimmunotherapy dedicatedly kills cancer cells but leaves normal stromal cells untouched. Furthermore, additional cycles of therapy might result in a little superior reduction.
CONCLUSION
The immediate cytotoxic effects induced by photoimmunotherapy were clearly detected by decreased glucose uptake using 18F-FDG PET imaging even before changes in tumor size became evident in vivo. 18F-FDG is a good imaging biomarker for photoimmunotherapy, which allows us to assess the therapeutic effects earlier than anatomic methods that rely on tumor size.
Acknowledgments
DISCLOSURE
The costs of publication of this article were defrayed in part by the payment of page charges. Therefore, and solely to indicate this fact, this article is hereby marked “advertisement” in accordance with 18 USC section 1734. This research was supported by the Intramural Research Program of the U.S. NIH, National Cancer Institute, Center for Cancer Research. No other potential conflict of interest relevant to this article was reported.
REFERENCES
- 1.Waldmann TA. Immunotherapy: past, present and future. Nat Med. 2003;9:269–277. [DOI] [PubMed] [Google Scholar]
- 2.Weiner LM, Surana R, Wang S. Monoclonal antibodies: versatile platforms forcancer immunotherapy. Nat Rev Immunol. 2010;10:317–327. [DOI] [PMC free article] [PubMed] [Google Scholar]
- 3.Hambley TW, Hait WN. Is anticancer drug development heading in the rightdirection? Cancer Res. 2009;69:1259–1262. [DOI] [PubMed] [Google Scholar]
- 4.Mitsunaga M, Ogawa M, Kosaka N, Rosenblum LT, Choyke PL, Kobayashi H.Cancer cell-selective in vivo near infrared photoimmunotherapy targeting specific membrane molecules. Nat Med. 2011;17:1685–1691. [DOI] [PMC free article] [PubMed] [Google Scholar]
- 5.Mitsunaga M, Nakajima K, Sano K, Kramer-Marek G, Choyke L, Kobayashi H.Immediate in vivo target-specific cancer cell death after near infrared photoimmunotherapy. BMC Cancer. 2012;12:345. [DOI] [PMC free article] [PubMed] [Google Scholar]
- 6.Choi H, Charnsangavej C, de Castro Faria S, et al. CT evaluation of the response of gastrointestinal stromal tumors after imatinib mesylate treatment: a quantitative analysis correlated with FDG PET findings. AJR. 2004;183: 1619–1628. [DOI] [PubMed] [Google Scholar]
- 7.Contractor KB, Aboagye EO. Monitoring predominantly cytostatic treatment response with 18F-FDG PET. J Nucl Med. 2009;50(suppl 1):97S–105S. [DOI] [PubMed] [Google Scholar]
- 8.Weber WA. Assessing tumor response to therapy. J Nucl Med. 2009;50(suppl 1):1S–10S. [DOI] [PubMed] [Google Scholar]
- 9.Shankar LK, Van den Abbeele A, Yap J, Benjamin R, Scheutze S, Fitzgerald TJ.Considerations for the use of imaging tools for phase II treatment trials in oncology. Clin Cancer Res. 2009;15:1891–1897. [DOI] [PubMed] [Google Scholar]
- 10.Herrmann K, Benz MR, Czernin J, et al. 18F-FDG-PET/CT imaging as an early survival predictor in patients with primary high grade soft tissue sarcomas undergoing neoadjuvant therapy. Clin Cancer Res. 2012;18:2024–2031. [DOI] [PMC free article] [PubMed] [Google Scholar]
- 11.Warburg O, Posener K, Negelein E. Hyper metabolism of tumors [in German]. Biochem Z. 1924;152:319–344. [Google Scholar]
- 12.Warburg O On the origin of cancer cells. Science. 1956;123:309–314. [DOI] [PubMed] [Google Scholar]
- 13.van Oosterom AT, Judson I, Verweij J, et al. Safety and efficacy of imatinib (STI571) in metastatic gastrointestinal stromal tumours: a phase I study. Lancet. 2001;358:1421–1423. [DOI] [PubMed] [Google Scholar]
- 14.Gayed I, Vu T, Iyer R, et al. The role of 18F-FDG PET in staging and early prediction of response to therapy of recurrent gastrointestinal stromal tumors. J Nucl Med. 2004;45:17–21. [PubMed] [Google Scholar]
- 15.Guide for the Care and Use of Laboratory Animals. Washington, DC: National Academy Press; 1996. [Google Scholar]
- 16.Yang XD, Jia XC, Corvalan JR, Wang P, Davis CG. Development of ABX-EGF,a fully human anti-EGF receptor monoclonal antibody, for cancer therapy. Crit Rev Oncol Hematol. 2001;38:17–23. [DOI] [PubMed] [Google Scholar]
- 17.Mitsunaga M, Nakajima T, Sano K, Choyke PL, Kobayashi H. Near-infrared theranostic photoimmunotherapy (PIT): repeated exposure of light enhances the effect of immunoconjugate. Bioconjug Chem. 2012;23:604–609. [DOI] [PMC free article] [PubMed] [Google Scholar]
- 18.Jadvar H Prostate cancer: PET with 18F-FDG, 18F- or 11C-acetate, and 18F- or 11C-choline. J Nucl Med. 2011;52:81–89. [DOI] [PMC free article] [PubMed] [Google Scholar]
- 19.Jadvar H, Alavi A, Gambhir SS. 18F-FDG uptake in lung, breast, and colon cancers: molecular biology correlates and disease characterization. J Nucl Med. 2009;50:1820–1827. [DOI] [PMC free article] [PubMed] [Google Scholar]
- 20.Kimura H, Lee C, Hayashi K, et al. UV light killing efficacy of fluorescent protein-expressing cancer cells in vitro and in vivo. J Cell Biochem. 2010;110: 1439–1446. [DOI] [PubMed] [Google Scholar]
- 21.Tsai MH, Aki R, Amoh Y, et al. GFP-fluorescence-guided UVC irradiation inhibits melanoma growth and angiogenesis in nude mice. Anticancer Res. 2010;30:3291–3294. [PubMed] [Google Scholar]
- 22.Sugiyama M, Sakahara H, Sato K, et al. Evaluation of 3ʹ-deoxy-3ʹ−18F-fluorothymidine for monitoring tumor response to radiotherapy and photodynamic therapy in mice. J Nucl Med. 2004;45:1754–1758. [PubMed] [Google Scholar]
- 23.Su H, Bodenstein C, Dumont RA, et al. Monitoring tumor glucose utilization by positron emission tomography for the prediction of treatment response to epidermal growth factor receptor kinase inhibitors. Clin Cancer Res. 2006;12:5659–5667. [DOI] [PubMed] [Google Scholar]
- 24.Holdsworth CH, Badawi RD, Manola JB, et al. CT and PET: early prognostic indicators of response to imatinib mesylate in patients with gastrointestinal stromal tumor. AJR. 2007;189:W324–330. [DOI] [PubMed] [Google Scholar]


