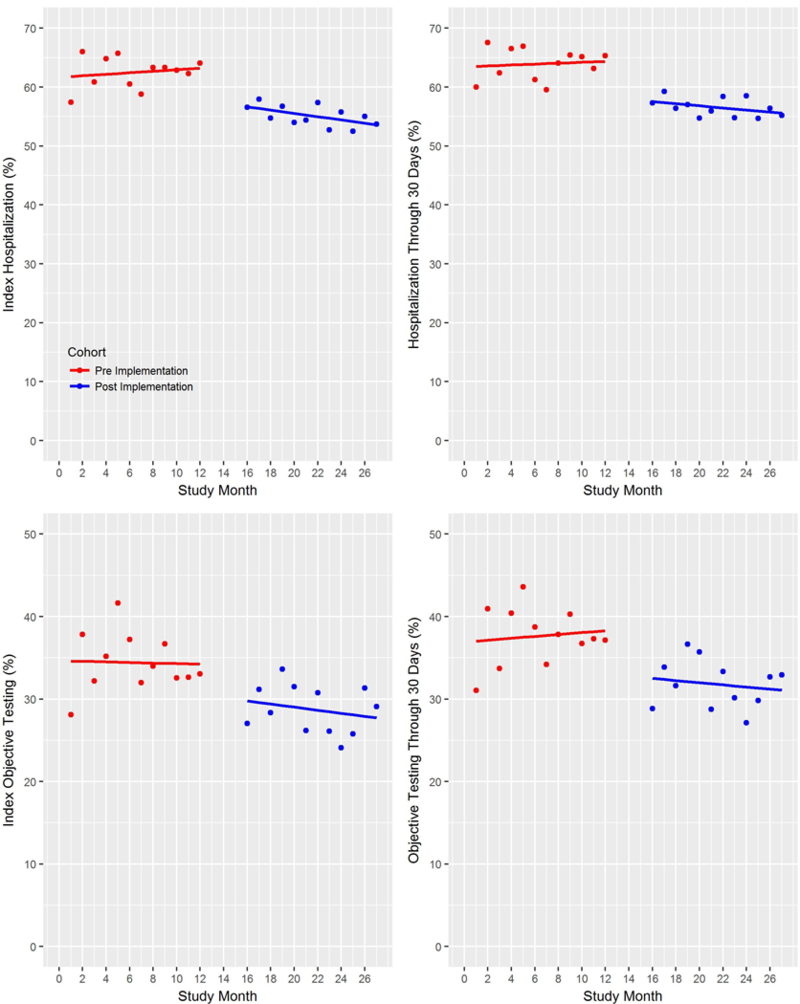
Figure 3.

Hospitalization and objective cardiac testing rates at WFBMC and DMC sites during the index visit and through the 30-day follow-up period, with fitted regression lines. Data from LMC are excluded from this plot due to asynchronous accrual times.
