

Abstract
Aims/hypothesis
Prolactin, a multifunctional hormone, is involved in regulating insulin sensitivity and glucose homeostasis in experimental studies. However, whether circulating concentrations of prolactin are associated with risk of type 2 diabetes remains uncertain.
Methods
We analysed the prospective relationship between circulating prolactin concentrations and type 2 diabetes risk in the Nurses’ Health Study (NHS) and NHSII with up to 22 years of follow-up. Total plasma prolactin was measured using immunoassay in 8615 women free of type 2 diabetes and cardiovascular disease at baseline blood collection (NHS 1989–1990; NHSII 1996–1999) and a subset of 998 NHS women providing a second blood sample during 2000–2002. Baseline bioactive prolactin was measured in a subset of 2478 women using the Nb2 bioassay. HRs were estimated using Cox regression.
Results
A total of 699 incident type 2 diabetes cases were documented during 156,140 person- years of follow-up. Total plasma prolactin levels were inversely associated with type 2 diabetes risk; the multivariable HR comparing the highest with the lowest quartile was 0.73 (95% CI 0.55, 0.95; ptrend=0.02). The associations were similar by menopausal status and other risk factors (pinteraction>0.70). Additional adjustment for sex and growth hormones, adiponectin, and inflammatory and insulin markers did not significantly alter the results. The association of plasma bioactive prolactin with type 2 diabetes risk was non-significantly stronger than that of total prolactin (HR comparing extreme quartiles, 0.53 vs 0.81 among the subset of 2478 women, pdifference=0.11). The inverse association of total prolactin with type 2 diabetes was significant during the first 9 years after blood draw but waned linearly with time, whereas for bioactive prolactin, the inverse relationship persisted for a longer follow-up time after blood draw.
Conclusions/interpretation
A normally high circulating total prolactin concentration was associated with a lower type 2 diabetes risk within 9–10 years of follow-up since blood draw in US women. Our findings are consistent with experimental evidence, suggesting that among healthy women, prolactin within the biologically normal range may play a protective role in the pathogenesis of type 2 diabetes.
Keywords: Hormone, Insulin, Prolactin, Type 2 diabetes
Graphical Abstract
Introduction
Type 2 diabetes is an endocrine and metabolic disease that affects more than 425 million people worldwide [1]. This disease, together with its macrovascular and microvascular complications, is associated with an augmented risk of disability and mortality, imposing an enormous burden on healthcare systems [2]. Although insulin resistance (IR), impaired insulin secretion and systemic inflammation are key metabolic abnormalities of type 2 diabetes [3], specific determinants and pathways leading to these pathological changes remain uncertain.
Somatolactogenic hormones, including prolactin and IGF, are critically involved in regulation of pancreatic cell growth and insulin functions [4]. Prolactin is a multifunctional pituitary hormone involved in lactation, reproduction, metabolism, immune regulation and osmoregulation [5–9]. In healthy women, circulating prolactin levels change in response to pregnancy, lactation, physical activity, sleep and stress [5, 9]. Accumulating experimental evidence suggests that prolactin can stimulate beta cell proliferation, and improve insulin secretion and sensitivity [5, 6, 10–14]. It also functions as an adipokine to regulate adipogenesis, lipid metabolism and inflammation [5, 6, 15]. Recent cross-sectional studies reported that higher circulating prolactin levels were associated with greater insulin sensitivity, lower glucose and lipid levels [12, 16, 17], and lower prevalence of diabetes and the metabolic syndrome [17, 18] (see electronic supplementary material [ESM] Fig. 1). These findings suggest a potential role of prolactin in glucose homeostasis. However, long-term prospective data evaluating the relationship between prolactin and future type 2 diabetes risk remain limited, and existing evidence has been inconsistent [18–20]. Some studies reported an inverse association between prolactin and type 2 diabetes risk, particularly among women, while a few others reported null or positive associations in men and women combined [18– 21]. These studies had a limited number of participants (N<200) and a short follow-up (a median of <6 years). In addition, due to post-transcriptional modifications, prolactin has different isoforms with divergent biological activities [22]. The immunoassay used in prior studies did not differentiate between prolactin isoforms or evaluate their biological activity, and it remains unclear whether the association between prolactin and diabetes risk varies by the somatolactogenic activity of prolactin.
We therefore conducted a secondary data analysis in the Nurses’ Health Study (NHS) and NHSII to prospectively examine the association between total circulating prolactin concentrations and type 2 diabetes risk. We explored whether prolactin measured in different time periods prior to diabetes diagnosis was differentially associated with diabetes risk. Furthermore, we examined whether the concentrations of somatolactogenically active prolactin (i.e., bioactive prolactin) were more strongly associated with diabetes risk than total prolactin.
Methods
Study population
The NHS was initiated in 1976 with 121,700 female registered nurses, aged 30–55 years, enrolled from 11 US states. The NHSII, established in 1989, enrolled 116,429 women, aged 25–42 years, from 14 US states. Women in both cohorts completed a detailed initial questionnaire regarding diseases and health-related questions and have been followed up biennially to update health-related factors and medical diagnoses.
From 1989–1990, 32,826 NHS women aged 43–70 years provided a heparin blood sample and completed a short questionnaire regarding weight, menopausal status and blood- draw characteristics [23]. Among these women, 18,743 donated a second blood sample from 2000–2002 [24]. In the NHSII, blood samples were collected from 29,611 women aged 32–54 years from 1996–1999 [25]. All blood samples were immediately shipped to our laboratory on ice, processed and stored in liquid nitrogen freezers. A high follow-up rate (≥95%) was maintained among women who provided blood [26].
Our study included 9097 NHS and NHSII women who had circulating prolactin levels previously measured in other studies (including three nested case-control studies of breast cancer, ovarian cancer and rheumatoid arthritis) [25–29]. After excluding duplicate measurements, outliers and individuals who were lost to follow-up or who had diabetes, cardiovascular disease (CVD) or cancer at the date of blood draw, 5891 women in the NHS and 2724 in the NHSII were included in the final analysis. Of the 5891 NHS women, 988 who were free of diabetes and CVD at the second blood draw had a repeated prolactin measurement using the second blood samples. Furthermore, a subset of 1485 NHS women and 993 NHSII women had a baseline measurement of bioactive prolactin [30] (ESM Fig. 2).
This study was approved by the institutional review board of the Brigham and Women’s Hospital, Boston, MA, USA, with the consent of participants implied by the return of the questionnaires and blood samples.
Laboratory assays
Total plasma prolactin levels were measured by a microparticle enzyme immunoassay. Samples were assayed either at the Clinical Laboratory Research Core at the Massachusetts General Hospital using the ARCHITECT chemiluminescence immunoassay system (Abbott Diagnostics, Abbott Park, IL, USA) or by Dr Christopher Longcope (University of Massachusetts Medical Centre, Worcester, MA, USA) using the IMx System (Abbott Laboratories, Abbott Park, IL, USA) [26]. The concordance was 0.91 between the two laboratories and >0.95 across different batches within the same laboratory [26]. No measurement was below the limit of detection (LOD=26.1 pmol/l) [26]. The mean CV across all studies/batches (based on 10% blinded quality control samples) was 7.8% [26].
Concentrations of bioactive prolactin (i.e., a measure of somatolactogenic activity of prolactin) were measured using the Nb2 lymphoma cell bioassay, which has been previously described [30]. The LOD was 0.1 pmol/l [30]. The mean within-batch CV was 7% and the mean across-batch CV was 40% [30].
Ten other biomarkers were evaluated in sensitivity analyses, including sex hormone binding globin (SHBG), oestrone, oestradiol, testosterone, IGF-1, IGF binding protein-3 (IGFBP-3), total adiponectin, high-sensitivity C-reactive protein (hsCRP), insulin and C- peptide, which were previously measured in the NHS/NHSII across various datasets (each biomarker was measured by 6 to 23 sub-studies within the NHS/NHSII) [24, 31–35]. The assays and CVs have been described elsewhere [24, 31–35].
Ascertainment of type 2 diabetes
Diagnosis of type 2 diabetes in the NHS and NHSII was described in detailed in prior publications [31, 32, 34, 36, 37]. Women who reported a physician’s diagnosis of diabetes on any biennial questionnaire completed a supplemental questionnaire to confirm the diagnosis. Type 2 diabetes was confirmed according to the criteria from the National Diabetes Data Group [38] (for individuals diagnosed before 1998; see ESM Methods) and the American Diabetes Association [39] (for individuals diagnosed after 1998). Using medical records from 62 NHS participants, a prior validation study showed 98% accuracy for type 2 diabetes ascertainment through the supplemental questionnaire [37].
Assessment of covariates
Information on demographic, reproductive and lifestyle factors, mental health, family history, medical history and medication use was acquired and updated biennially from baseline and follow-up questionnaires. Blood-draw characteristics, including fasting status, date, time of day, weight, menopausal status, hormone therapy (HT) and medication use at blood draw, were acquired at blood collection. In 1984, 1986 and every 4 years thereafter (NHSII: 1991 and every 4 years thereafter), a validated food frequency questionnaire was used to assess diet; and the Alternative Healthy Eating Index (AHEI) was derived to indicate diet quality [40]. BMI was calculated as weight in kilograms divided by the square of height in metres. Metabolic equivalent tasks in hours per week was calculated based on self-reported leisure-time physical activities. The five-item Mental Health Inventory (MHI-5) was derived to evaluate depressive symptoms [36]. Early-life body size was assessed by the Stunkard scale [41] and we used the mean body size at the age of 5 and 10 years to indicate childhood body size.
Statistical methods
A detailed description of the statistical methods is provided in ESM Methods. We excluded 36 prolactin concentration outliers identified by a generalised extreme studentised deviate many-outlier procedure [42]. Batch effects for all biomarkers were corrected using the average batch correction method [33, 43]. Person-time of follow-up was calculated from the date of baseline blood draw to the date of type 2 diabetes diagnosis, last return of a follow-up questionnaire, death or end of follow-up (June 2012 in the NHS and June 2013 in NHSII), whichever came first. Cox proportional hazards regressions were used to estimate HRs and 95% CIs of type 2 diabetes according to quartiles of prolactin concentrations, with the lowest quartile as the reference. All models were stratified by age in months, follow-up period and cohorts, and were adjusted for fasting status, time of day, oral steroid use and antidepressant use at blood draw, as well as menopausal status and HT use (Model 1). We further adjusted for BMI, physical activity, AHEI, smoking, childhood body size, MHI-5 score, parity, age at menarche, age at menopause, change in menopausal status and postmenopausal HT use during follow-up compared with blood draw, family history of diabetes, hypercholesterolaemia and hypertension (Model 2), and for race and incident primary diseases (breast cancer, ovarian cancer or rheumatoid arthritis; Model 3). Restricted cubic splines were used to assess dose-response relationships.
We examined potential effect modification by menopausal status at blood draw, BMI, parity, diet quality, physical activity and smoking status. Several sensitivity analyses were conducted. First, we excluded incident type 2 diabetes cases diagnosed after diagnosis of the primary diseases or within the first year after blood draw. Second, we additionally adjusted for thyroid hormone use, thyroid functions (hyperthyroidism, hypothyroidism or normal) and duration of breastfeeding. Third, we examined whether the association between prolactin and type 2 diabetes risk was independent of SHBG, testosterone, oestrone, oestradiol, IGF-1, IGFBP-3, adiponectin, hsCRP, insulin and C-peptide by including individual biomarkers in the fully-adjusted model. Differences in HRs of prolactin from models with and without additional adjustments of each biomarker (among the participants with that biomarker measured) were assessed using a meta-analysis. Pairwise correlations between these biomarkers and prolactin (on the log scale) were evaluated using the Pearson correlation coefficients. Secondarily, we evaluated the association between bioactive prolactin and type 2 diabetes risk among a subgroup of 2478 women, using similar methods as described for total prolactin.
To evaluate whether the association between prolactin and type 2 diabetes risk varied by follow-up time, we included an interaction term between prolactin concentrations (total and bioactive) and follow-up time since blood draw in the multivariate model, and estimated HRs and 95% CIs of type 2 diabetes at each follow-up time point, comparing the highest vs lowest quartile of prolactin.
All analyses were performed using SAS software, version 9.4 (SAS Institute, Cary, NC, USA). A two-sided p value<0.05 was considered statistically significant.
Results
We documented 699 incident type 2 diabetes cases among 8615 women during up to 22 years of follow-up in the NHS and NHSII (156,140 person-years). Women with higher baseline prolactin concentrations were more likely to be younger, premenopausal and non-smokers, have longer duration of breastfeeding, and more likely to use antidepressant or postmenopausal HT; meanwhile, they are less likely to be parous, have fewer children, and less likely to have hypercholesterolaemia or thyroid dysfunction, or to use thyroid hormones (Table 1). Baseline concentrations of total and bioactive prolactin were both lower in individuals with incident type 2 diabetes than in those without (p<0.001) (ESM Table 1).
Table 1.
Baseline (date of the first blood collection) characteristics of the study participants
| Characteristics | Quartiles of prolactin levels |
|||
|---|---|---|---|---|
| Quartile 1 (≤347.8 pmol/l) |
Quartile 2 (>347.8–482.6 pmol/l) |
Quartile 3 (>482.6–687.0 pmol/l) |
Quartile 4 (>687.0 pmol/l) |
|
| n=2096 | n=2145 | n=2143 | n=2231 | |
| Prolactin, pmol/l, median (10th, 90th percentiles) | 273.9 (200.0, 339.1) | 417.4 (365.2, 469.6) | 573.9 (500.0, 656.5) | 1043.5 (713.0, 1534.8) |
| White, % | 95.9 | 96.9 | 97.2 | 96.3 |
| Age at blood draw, years | 56.1 (7.9) | 53.9 (8.4) | 51.6 (8.3) | 49.2 (7.6) |
| BMI at blood draw, kg/m2 | 25.5 (4.8) | 25.5 (4.9) | 25.3 (4.9) | 25.2 (4.7) |
| Childhood body size a | 2.5 (1.3) | 2.4 (1.2) | 2.4 (1.2) | 2.5 (1.2) |
| Age at menarche, years | 12.5 (1.4) | 12.5 (1.4) | 12.5 (1.3) | 12.6 (1.5) |
| Age at menopause, years b | 49.2 (4.8) | 49.3 (4.6) | 49.3 (4.4) | 48.8 (4.6) |
| Postmenopausal % | 52.6 | 49.2 | 45.2 | 43.0 |
| Postmenopausal HT b, % | 40.7 | 42.0 | 48.1 | 61.1 |
| Parous, % | 93.5 | 90.7 | 89.1 | 86.5 |
| Number of children c | 3.2 (1.6) | 3.0 (1.4) | 2.8 (1.4) | 2.7 (1.2) |
| Total duration of lactation, months c | 7.6 (10.0) | 8.7(10.5) | 9.5 (11.0) | 9.9(10.9) |
| Oral steroid use, % | 1.2 | 1.8 | 1.5 | 2.7 |
| Antidepressant use, % | 5.6 | 5.9 | 6.1 | 8.1 |
| Hyperthyroidism, % | 1.7 | 1.7 | 1.6 | 1.2 |
| Hypothyroidism, % | 11.3 | 10.3 | 10.4 | 9.3 |
| Thyroid hormone use, % | 10.7 | 11.0 | 10.4 | 7.7 |
| MHI-5 score, scale 1–100 | 76.7(13.4) | 76.8 (13.5) | 76.5 (13.7) | 77.3 (13.7) |
| Smoking status | ||||
| Current smokers, % | 15.3 | 9.5 | 10.5 | 6.7 |
| Former smokers, % | 38.0 | 37.7 | 35.2 | 35.2 |
| Never smokers, % | 46.7 | 52.8 | 54.3 | 58.1 |
| Physical activity, MET-hours/week | 16.7(22.5) | 17.0 (20.7) | 16.9(19.2) | 17.7 (24.8) |
| AHEI, scale 0–110 | 52.4(10.8) | 52.8 (10.7) | 52.8 (11.1) | 52.5 (10.9) |
| Family history of diabetes, % | 26.4 | 26.3 | 27.3 | 24.7 |
| Personal history of hypertension, % | 21.9 | 18.6 | 22.1 | 20.2 |
| Personal history of hypercholesterolaemia, % | 36.5 | 34.6 | 33.2 | 31.7 |
Based on the Stunkard scale of nine body shapes; the presented values were the mean body shapes at the age of 5 and 10 years
Among women who were postmenopausal at the time of blood draw
Among women who were parous at the time of blood draw
Categorical variables are presented as %, and continuous variables are presented as mean (SD), except for prolactin. Variables are age-adjusted, except for age and prolactin
After adjusting for risk factors and potential confounders, we observed an inverse association between total circulating prolactin levels and type 2 diabetes risk (Table 2 and Fig. 1a); the multivariable HRs (95% CIs) of type 2 diabetes comparing higher quartiles to the lowest quartile of prolactin concentrations were 0.95 (0.75, 1.19), 1.01 (0.80, 1.28) and 0.73 (0.55, 0.95), respectively (ptrend=0.02). This inverse association was observed in both premenopausal and postmenopausal women with comparable effect sizes; HRs (95% CIs) comparing extreme quartiles were 0.80 (0.52, 1.22) and 0.65 (0.43, 0.98), respectively; pdifference=0.74 (Table 2; Fig. 1b,c). The association between prolactin concentrations and type 2 diabetes risk was similar when we additionally adjusted for thyroid hormone use and thyroid function, and duration of breastfeeding, excluded incident cases of breast cancer, ovarian cancer, and rheumatoid arthritis diagnosed prior to type 2 diabetes, or excluded incident type 2 diabetes cases diagnosed within 1 year after blood collection (ESM Table 2). We did not observe evidence for effect modification by BMI, parity, diet quality, physical activity or smoking (pinteraction ≥0.74), although the inverse association between prolactin and type 2 diabetes risk was non-significantly stronger among individuals who were not obese, had higher diet quality or had never smoked (Fig. 2).
Table 2.
HRs (95% CI) of circulating prolactin concentrations with type 2 diabetes risk
| Quartiles of prolactin levels |
ptrenda | ||||
|---|---|---|---|---|---|
| Quartile 1 | Quartile 2 | Quartile 3 | Quartile 4 | ||
| All women | |||||
| No. of incident | |||||
| T2D cases | 204 | 173 | 186 | 136 | |
| Person-years | 38,507 | 39,378 | 38,893 | 39,362 | |
| Model 1 | 1 [reference] | 0.84 (0.68, 1.04) | 0.91 (0.74, 1.14) | 0.65 (0.50, 0.83) | <0. 01 |
| Model 2 | 1 [reference] | 0.95 (0.76, 1.19) | 1.01 (0.80, 1.28) | 0.74 (0.57, 0.97) | 0.03 |
| Model 3 | 1 [reference] | 0.95 (0.75, 1.19) | 1.01 (0.80, 1.28) | 0.73 (0.55, 0.95) | 0.02 |
| Premenopausal women | |||||
| No. of incident | 58 | 67 | 98 | 89 | |
| T2D cases | |||||
| Person-years | 11,711 | 17,109 | 22,598 | 28,099 | |
| Model 1 | 1 [reference] | 0.86 (0.59, 1.26) | 0.92 (0.65, 1.31) | 0.69 (0.47, 0.99) | 0.04 |
| Model 2 | 1 [reference] | 1.03 (0.67, 1.59) | 0.94 (0.63, 1.41) | 0.82 (0.54, 1.25) | 0.24 |
| Model 3 | 1 [reference] | 1.02 (0.66, 1.57) | 0.94 (0.63, 1.41) | 0.80 (0.52, 1.22) | 0.18 |
| Postmenopausal women | |||||
| No. of incident | 146 | 106 | 88 | 47 | |
| T2D cases | |||||
| Person-years | 26,795 | 22,269 | 16,295 | 11,263 | |
| Model 1 | 1 [reference] | 0.82 (0.62, 1.07) | 0.86 (0.64, 1.15) | 0.58 (0.39, 0.84) | <0. 01 |
| Model 2 | 1 [reference] | 0.90 (0.67, 1.20) | 1.01 (0.74, 1.38) | 0.64 (0.43, 0.97) | 0.07 |
| Model 3 | 1 [reference] | 0.92 (0.69, 1.23) | 1.00 (0.73, 1.37) | 0.65 (0.43, 0.98) | 0.07 |
ptrend was determined by assigning the median value of prolactin concentration within each quartile and modelling this variable continuously
The cut-off points of the prolactin quartiles are 347.8, 482.6 and 687.0 pmol/l
Model 1: Cox regression models to calculate HR and 95% CI, stratifying by age in months, follow-up period and cohort, and adjusting for fasting status of blood draw, time of day of blood draw, oral steroid use at blood draw, antidepressant use at blood draw, menopausal status and postmenopausal HT
Model 2: Based on model 1, additionally adjusted for BMI, physical activity, AHEI score, smoking status, childhood body size, MHI-5 score, parity, age at menarche, age at menopause, change in menopausal status and postmenopausal HT use compared with blood draw, family history of diabetes, history of hypertension and history of hypercholesterolaemia Model 3: Based on model 2, additionally adjusted for race and for incident cases of breast cancer, ovarian cancer and rheumatoid arthritis
pdifference between the NHS and NHSII was 0.88, and between premenopausal women and postmenopausal women was 0.74
T2D, type 2 diabetes
Fig. 1.
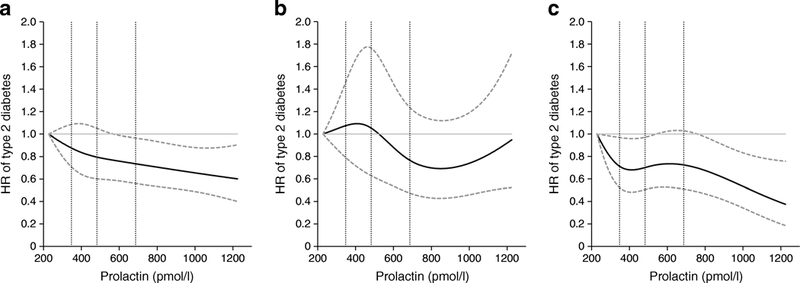
HR (95% CI) of incident type 2 diabetes risk by circulating prolactin levels. (a) All study participants (N=8615); test for non-linear relation: p=0.72. (b) Women who were premenopausal at blood collection (n=4558); test for non-linear relation: p=0.16. (c) Women who were postmenopausal at blood collection (n=4057); test for non-linear relation: p=0.19. Cubic splines were performed using medians of deciles of circulating prolactin concentrations and were adjusted for covariates noted in Table 2, Model 3. Solid curves are HRs and dashed lines are 95% CIs. The dotted vertical lines represent the cut-off points of the quartiles (i.e., 347.8, 482.6 and 687.0 pmol/l)
Fig. 2.
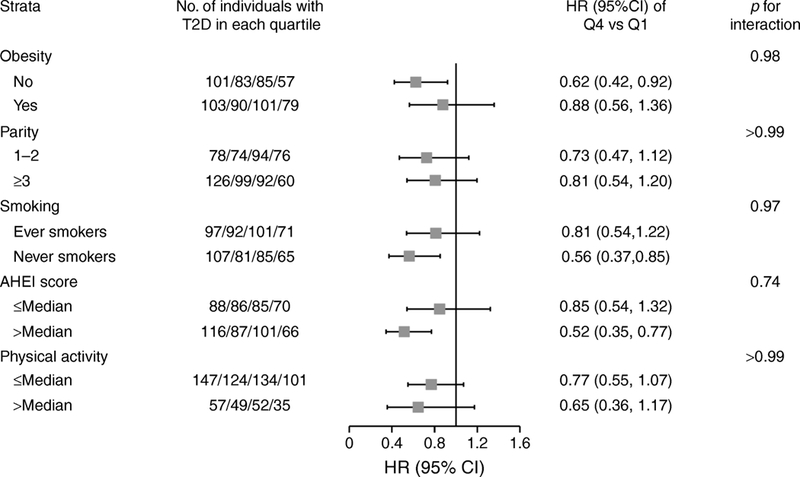
HR (95% CI) of incident type 2 diabetes risk in subgroups of risk factors, comparing extreme quartiles of prolactin concentration. As HRs of type 2 diabetes risk were only significant when comparing the highest to the lowest quartiles of prolactin concentration in the main analyses, we present HRs comparing extreme quartiles within specific subgroups in this stratification analysis. HRs and 95% CIs were calculated using Cox regression models, adjusting for covariates noted in Table 2, Model 3, and p values for interaction were calculated using the likelihood ratio test. Squares denote HRs and horizontal lines represent 95% CIs. T2D, type 2 diabetes
Total prolactin was positively correlated with testosterone, oestrone, oestradiol and IGF-1, and inversely correlated with IGFBP-3, adiponectin, hsCRP and C-peptide (p<0.05). Total prolactin was not significantly correlated with SHBG or insulin (Table 2). All biomarkers except for oestrone differed significantly between individuals with incident type 2 diabetes and those without (p<0.05) (ESM Table 1). Additional adjustment for individual biomarkers in the multivariable model did not significantly alter the association between prolactin and type 2 diabetes risk (pdifference≥0.49) (Table 3).
Table 3.
HRs (95% CI) for circulating prolactin concentrations with type 2 diabetes risk before and after adjusting for major sex and growth hormones, adiponectin, and inflammatory and insulin biomarkers
| Quartiles of prolactin levels |
ptrenda | Rb | pdifferencec | ||||
|---|---|---|---|---|---|---|---|
| Quartile 1 | Quartile 2 | Quartile 3 | Quartile 4 | ||||
| In 7144 participants with SHBG available | |||||||
| No. of incident T2D cases/person-years | 173/33,142 | 139/32,334 | 148/31,138 | 111/31,358 | 0.02 | 0.73 | |
| Model without SHBG | 1 [reference] | 0.90 (0.69, 1.16) | 1.01 (0.78, 1.32) | 0.72 (0.53, 0.98) | 0.06 | ||
| Model + SHBG | 1 [reference] | 0.91 (0.70, 1.19) | 1.07 (0.82, 1.39) | 0.77 (0.57, 1.05) | 0.15 | ||
| In 6609 participants with testosterone available | |||||||
| No. of incident T2D cases/person-years | 170/32,019 | 135/30,672 | 142/29,087 | 97/28,486 | 0.17* | 0.93 | |
| Model without testosterone | 1 [reference] | 0.90 (0.69, 1.17) | 1.01 (0.77, 1.32) | 0.71 (0.51, 0.97) | 0.05 | ||
| Model + testosterone | 1 [reference] | 0.90 (0.69, 1.18) | 1.02 (0.78, 1.34) | 0.72 (0.52, 0.99) | 0.07 | ||
| In 3450 participants with oestrone available | |||||||
| No. of incident T2D cases/person-years | 90/16,737 | 63/15,642 | 71/14,523 | 41/14,122 | 0.33* | 0.84 | |
| Model without oestrone | 1 [reference] | 0.90 (0.60, 1.36) | 1.23 (0.81, 1.86) | 0.62 (0.35, 1.10) | 0.23 | ||
| Model + oestrone | 1 [reference] | 0.86 (0.57, 1.31) | 1.15 (0.76, 1.75) | 0.61 (0.35, 1.08) | 0.14 | ||
| In 4496 participants with oestradiol available | |||||||
| No. of incident T2D cases/person-years | 124/22,890 | 83/20,783 | 88/18,479 | 61/17,916 | 0.37* | 0.94 | |
| Model without oestradiol | 1 [reference] | 0.85 (0.61, 1.18) | 1.11 (0.79, 1.57) | 0.68 (0.44, 1.05) | 0.17 | ||
| Model + oestradiol | 1 [reference] | 0.80 (0.57, 1.13) | 1.07 (0.76, 1.52) | 0.69 (0.44, 1.07) | 0.22 | ||
| In 4048 participants with IGF-1 available | |||||||
| No. of incident T2D cases/person-years | 106/16,527 | 102/18,534 | 114/18,453 | 77/19,698 | 0.11* | >0.99 | |
| Model without IGF-1 | 1 [reference] | 0.99 (0.70, 1.38) | 1.03 (0.73, 1.45) | 0.66 (0.44, 0.97) | 0.03 | ||
| Model + IGF-1 | 1 [reference] | 0.99 (0.71, 1.39) | 1.03 (0.73, 1.45) | 0.66 (0.45, 0.98) | 0.03 | ||
| In 4043 participants with IGFBP-3 available | |||||||
| No. of incident T2D cases/person-years | 106/16,525 | 103/18,512 | 115/18,446 | 77/19,639 | −0.07* | 0.99 | |
| Model without IGFBP-3 | 1 [reference] | 0.97 (0.69, 1.36) | 1.02 (0.73, 1.45) | 0.65 (0.44, 0.96) | 0.02 | ||
| Model + IGFBP-3 | 1 [reference] | 0.97 (0.69, 1.36) | 1.03 (0.73, 1.46) | 0.65 (0.44, 0.97) | 0.02 | ||
| In 4139 participants with adiponectin available | |||||||
| No. of incident T2D cases/person-years | 148/19,185 | 127/19,559 | 131/18,201 | 92/17,480 | −0.04* | 0.95 | |
| Model without adiponectin | 1 [reference] | 0.98 (0.74, 1.31) | 1.04 (0.77, 1.39) | 0.75 (0.53, 1.07) | 0.13 | ||
| Model + adiponectin | 1 [reference] | 1.11 (0.82, 1.50) | 1.11 (0.81, 1.51) | 0.79 (0.55, 1.13) | 0.16 | ||
| In 3844 participants with hsCRP available | |||||||
| No. of incident T2D cases/person-years | 138/20,949 | 113/18,780 | 111/17,271 | 72/15,167 | −0.09* | 0.95 | |
| Model without hsCRP | 1 [reference] | 1.02 (0.76, 1.37) | 1.00 (0.73, 1.36) | 0.76 (0.52, 1.10) | 0.14 | ||
| Model + hsCRP | 1 [reference] | 1.03 (0.76, 1.39) | 0.99 (0.72, 1.35) | 0.75 (0.52, 1.09) | 0.12 | ||
| In 2078 participants with insulin available | |||||||
| No. of incident T2D cases/person-years | 79/7945 | 78/8734 | 88/9869 | 63/10865 | −0.04 | 0.85 | |
| Model without insulin | 1 [reference] | 1.13 (0.72, 1.77) | 1.06 (0.69, 1.63) | 0.67 (0.41, 1.09) | 0.05 | ||
| Model + insulin | 1 [reference] | 1.30 (0.82, 2.06) | 1.06 (0.68, 1.64) | 0.67 (0.40, 1.09) | 0.03 | ||
| In 3243 participants with C-peptide available | |||||||
| No. of incident T2D cases/person-years | 86/13.858 | 76/15,081 | 82/14,914 | 55/14,217 | −0.09 * | 0.49 | |
| Model without C-peptide | 1 [reference] | 0.89 (0.60, 1.33) | 0.90 (0.60, 1.35) | 0.58 (0.35, 0.94) | 0.03 | ||
| Model + C-peptide | 1 [reference] | 0.91 (0.60, 1.37) | 0.98 (0.64, 1.49) | 0.74 (0.45, 1.21) | 0.23 | ||
The cut-off points of the prolactin quartiles are 347.8, 482.6 and 687.0 pmol/l
Cox regression models were stratified by age, follow-up period, and cohort, and adjusted for fasting status, time of day, oral steroid use and antidepressant use at blood draw, as well as menopausal status, postmenopausal HT use, BMI, physical activity, AHEI score, smoking status, childhood body size, MHI-5 score, parity, age at menarche, age at menopause, change in menopausal status and postmenopausal HT use since blood draw, family history of diabetes, history of hypertension, history of hypercholesterolaemia, race, and incident breast cancer, ovarian cancer and rheumatoid arthritis
ptrend was determined by assigning the median value of prolactin concentration within each quartile and modelling this variable continuously
R the was the Pearson correlation coefficient between natural-log transformed prolactin and the other biomarker at baseline;
indicates a correlation p value of less than 0.05
pdifference for difference was calculated using the heterogeneity test in a fixed-effect meta-analysis, using the association estimates from the trend analyses
T2D, type 2 diabetes
In secondary analyses, we observed a significant inverse association between bioactive prolactin levels and type 2 diabetes risk in multivariable model without adjustment for BMI (ESM Table 3); HRs (95% CI) of type 2 diabetes for higher quartiles compared with the lowest quartiles of bioactive prolactin were 0.62 (0.40, 0.96), 0.55 (0.34, 0.87) and 0.53 (0.32, 0.86), respectively (ptrend=0.01). This inverse association was non-significantly stronger than the association for total prolactin in the same subset of women (comparable HRs were 0.98, 0.90, and 0.81; ptrend=0.39; compared with the association of bioactive prolactin, pdifference=0.11). Sensitivity analyses with additional adjustment or exclusions (as described above) in general yielded similar associations with bioactive prolactin (ESM Fig. 3a,b). However, further adjustment for BMI and C-peptide substantially attenuated the association between bioactive prolactin and type 2 diabetes (ESM Table 3 and ESM Fig. 3b).
We assessed the HR (95% CI) of type 2 diabetes risk comparing the highest vs the lowest quartiles of prolactin over follow-up after blood draw. The inverse association between total prolactin and type 2 diabetes risk was stronger during the first 9 years after blood draw but waned linearly with longer follow-up time after approximately 9–10 years (Fig. 3a). This time-dependent attenuation in the association was similar among premenopausal and postmenopausal women (Fig. 3b,c). Analyses using the continuous prolactin concentrations as an exposure variable yielded similar, albeit weaker and less significant results (ESM Fig. 4). For bioactive prolactin, a strong inverse association with type 2 diabetes risk (HR<0.6) was observed during the early years of follow-up and remained constant with extended follow-up (ESM Fig. 3c).
Fig. 3.
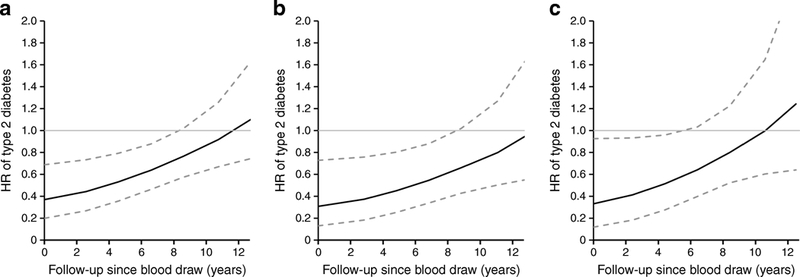
HR (95% CI) of type 2 diabetes risk at each follow-up time point since blood draw, comparing extreme quartiles of prolactin concentrations. (a) All study participants. (b) Women who were premenopausal at blood collection. (c) Women who were postmenopausal at blood collection. As HRs of type 2 diabetes risk were only significant when comparing the highest to the lowest quartiles of prolactin concentration in the main analyses, we presented HRs comparing extreme quartiles from blood draw through the first 13 years of follow-up. HRs and 95% CIs at different time points were calculated by including an interaction term of prolactin quartiles and follow-up time in the Cox regression models, adjusting for covariates noted in Table 2, Model 3. Solid lines are HRs and dashed lines are 95% CIs
Conclusions
In this prospective study of middle-aged women, circulating total prolactin concentrations were inversely associated with incident type 2 diabetes risk, independently of BMI, lifestyle and reproductive factors, as well as individual sex and growth hormones, adiponectin, and inflammatory and insulin biomarkers. This association did not differ by menopausal status, but appeared time-varying, with stronger associations observed within the first 9–10 years of follow-up after blood draw. Circulating bioactive prolactin showed a non-significantly stronger association with type 2 diabetes risk than total prolactin, but this association was substantially attenuated after further adjustment for BMI and C-peptide.
Our findings were consistent with prior prospective data in pregnant and postmenopausal women with short periods of follow-up [19, 20], and were in line with crosssectional observations that higher, but physiologically normal prolactin concentrations were associated with lower type 2 diabetes prevalence [17, 18]. Furthermore, our study demonstrated that the inverse association between prolactin and type 2 diabetes risk in women remained significant after adjustment for a variety of lifestyle and reproductive factors as well as other sex and growth hormones, suggesting that prolactin may be linked to type 2 diabetes through independent pathways. Two prospective studies of men and women combined reported null associations between prolactin and type 2 diabetes risk after multivariable adjustment [18, 21]. This lack of association might be due to the limited number of incident cases (n=163 and 78), especially among women (n=84 and 27), and a potentially different association by sex. In fact, several recent prospective studies suggested that the associations between prolactin and risk of type 2 diabetes and the metabolic syndrome were more likely to be beneficial in women but tended to be null or even detrimental in men [17–21]. The reason underlying this sex difference is unclear, as both beneficial and detrimental effects of prolactin on IR have been reported in men [12, 44]. Nevertheless, our data, coupled with prior evidence, suggest that prolactin may be related to pathogenic pathways leading to the development of type 2 diabetes in women.
It should be noted that our study focused on circulating prolactin within the physiologically normal range (i.e., <1291 pmol/l for non-pregnant women [45]; the 5th to 95th percentile of total prolactin in our data: 226–1244 pmol/l). By contrast, extremely high prolactin concentrations, such as pathological hyperprolactinaemia induced by prolactinoma (usually >8696 pmol/l), can exert an adverse effect on metabolism, including exacerbating IR, reducing glucose tolerance, promoting weight gain, and perturbing carbohydrate/lipid metabolism and the immune system [14, 46]. In women, prolactinoma and hyperprolactinaemia could alter the homeostasis of hormonal/growth factors, causing SHBG reduction, hypo-oestrogenism, hyperandrogenism, dysregulation of energy/glucose metabolism or even reduced muscle/bone mass [47].
Interestingly, our data showed that the association of prolactin concentrations with type 2 diabetes risk was most evident within the first 9–10 years after blood draw but waned linearly with increased follow-up time; this time-dependent attenuation in association was not observed for bioactive prolactin. A previous study reported a similar time-varying effect, with prolactin measured from blood collected within 10 years of diagnosis, but not after, associated with risk of postmenopausal breast cancer [26]. Total prolactin levels can be influenced by many factors and thus are biologically variable over time [5, 9]. The intra-class correlation coefficient (ICC) of total prolactin was 0.40–0.53 over 3 years and 0.39 over 10 years [26, 48]. Therefore, the attenuation in the association over longer follow-up may, in part, be explained by the fact that a single prolactin measurement at baseline might not accurately reflect the long-term exposure to prolactin during decades of follow-up. Bioactive prolactin had a somewhat higher ICC (i.e. 0.63–0.66 over 3 years [30]) and thus, a baseline measurement could be more representative over time. Another possibility is that impaired glucose tolerance may lower prolactin concentrations. However, our results are unlikely to be fully explained by reverse causation because the observed association remained significant for 9–10 years after blood draw, and the exclusion of type 2 diabetes cases diagnosed within 1 year after blood draw did not change the results. Mechanisms underlying such time-dependent attenuation in the association require further investigation with repeated prolactin measurement to accurately assess prolactin exposure over time.
While the immunoassay measures all prolactin isoforms, the Nb2 bioassay captures the somatolactogenic activity of prolactin and growth hormone, with a higher specificity to prolactin (78–95%) [49, 50]. In line with our hypothesis, we observed a stronger inverse association between bioactive prolactin and type 2 diabetes than total prolactin. However, while the association between total prolactin and type 2 diabetes was not altered by adjustment for risk factors/biomarkers, the association with bioactive prolactin was more sensitive to adjustment for BMI and C-peptide. While this may have been in part due to the smaller sample size in this analysis, there was a strong inverse correlation between bioactive prolactin (but not total prolactin) and BMI [30], which might be driven by the impact of growth hormone (which was inversely associated with BMI [51]) on the bioassay [30], or the reduced release of prolactin from adipose tissues in obese women [7]. The association was also attenuated by adjustment for C-peptide, which was more strongly correlated to bioactive than to total prolactin. It is possible that the bioassay may capture more biological, relevant aspects related to IR than total prolactin. More studies are warranted to understand the metabolic effects of the somatolactogenic activity of prolactin.
Accumulating experimental evidence suggests that prolactin can directly upregulate pancreatic islet function by promoting growth and suppressing apoptosis of beta cells and increasing glucose-stimulated insulin release [5, 10, 11, 52]. Prolactin is a principal determinant of prenatal/postnatal development of pancreatic islet cells, as well as islet adaptation during pregnancy [5, 14, 20, 53]. It is also involved in the regulation of hepatic/adipocytic insulin sensitivity [12, 13], and can indirectly affect hypothalamic dopamine release and energy/glucose homeostasis [54]. In our study, prolactin was inversely correlated with C-peptide and adjusting for C-peptide attenuated the association between prolactin and type 2 diabetes (particularly for bioactive prolactin). C-peptide is a robust indicator for endogenous insulin production and a potential marker of IR in individuals without type 1 diabetes [55]; it is less affected by haemolysis and hepatic insulin extraction compared with insulin [56]. Although we did not have fasting glucose data to derive HOMA- IR, C-peptide was significantly higher in individuals with incident type 2 diabetes than in those without, suggesting that it may be used as an alternative indicator of IR in our study population. Altogether, our findings suggest that prolactin may be linked to the development of type 2 diabetes through insulin-related pathways. Furthermore, prolactin is involved in regulating immune cells and cytokine secretion [15], and may act as an adipokine, suppressing the adipocyte production of adiponectin and IL-6, and influencing adipogenesis, energy balance, lipid metabolism and inflammatory response [5]. In our data, prolactin was inversely correlated with adiponectin and positively correlated with hsCRP; however, adjusting for these two biomarkers did not alter the association with type 2 diabetes risk, suggesting that adiponectin and inflammation may not be mediators of the observed association. In summary, substantial biological evidence supports an aetiological association of prolactin with type 2 diabetes risk (summarised in ESM Fig. 1), but the explicit mechanisms underlying this association require more detailed investigation.
Our study has several strengths. Notably, the primary analyses were conducted in over 8600 women with ~700 incident type 2 diabetes cases identified during up to 22 years of follow-up, providing us with sufficient statistical power and the ability to assess time- dependent associations. In addition, the well-characterised NHS/NHSII contain rich epidemiological and biomarker data, allowing us to adjust for multiple confounders, risk factors and potential mediators. Furthermore, the bioactive prolactin data from the Nb2 bioassay were unique in terms of examining the prolactin isoforms with somatolactogenic activity in relation to diabetes risk.
Several limitations of our study warrant discussion. First, because our study was based on middle-aged, mostly white women who were healthy at baseline, our results cannot be generalised to other age or ethnic groups, or to men. Second, our study was a secondary data analysis based on existing biomarkers from studies of different aims/outcomes; only a limited number of women had data on all the biomarkers we examined; therefore, we were unable to adjust for all biomarkers simultaneously in the same model. Nevertheless, by controlling for individual biomarkers one at a time, we assessed the potential influence of correlated biomarkers on the association with prolactin. Third, as prolactin concentrations in our analyses were measured primarily for nested case-control studies of other disease outcomes, sample selection and increased risk of primary diseases may bias our results. However, we corrected for batch effects and adjusted for primary diseases in the multivariable model; we also conducted a sensitivity analysis excluding incident cases of primary diseases diagnosed prior to type 2 diabetes. Furthermore, because we did not have data on fasting glucose, we were unable to assess the relationship between prolactin and IR. Finally, despite multivariable adjustment, residual confounding by adiposity and other hormonal factors is still possible. Future prospective studies in diverse populations with assessment of potential interactions with multiple hormonal, metabolic and inflammatory biomarkers will provide more insight into the mechanisms linking prolactin to metabolic outcomes.
In conclusion, in a large prospective cohort study of US women, total circulating prolactin concentrations within the physiological range were inversely associated with type 2 diabetes risk, especially during the first 9–10 years of follow-up after blood draw; the association was non-significantly stronger for bioactive prolactin. Our epidemiological observations, coupled with previous population data and emerging experimental evidence, support a potential protective role of prolactin (within the biologically normal range) in the pathogenesis of type 2 diabetes risk in women. Future studies are warranted to understand the biological mechanisms underlying this association, which may lead to the development of novel strategies for early prevention and treatment of type 2 diabetes.
Supplementary Material
Acknowledgement
This research was conducted using data and resources from the NHS and NHSII of the Channing Division of Network Medicine in the Department of Medicine at the Brigham and Women’s Hospital and Harvard Medical School. The authors thank the NHS and NHSII investigators for their important contributions in resource development and intellectual input.
Funding This study was funded by the National Cancer Institute grants UM1 CA186107, P01 CA87969, R01 CA49449, UM1 CA176726, R01 CA67262, R01 CA119139, R01 CA138580 and R01 CA163451; the National Institute of Arthritis and Musculoskeletal and Skin Diseases grant R01 AR049880; and the National Institute of Diabetes and Digestive and Kidney Diseases grants DK46200 and DK112940. Dr Jun Li is a recipient of the ADA-Pfizer New England Cardiovascular-Metabolic Fellowship Award (9–17-CMF-011). The funders had no role in study design, data collection, data analysis, data interpretation, the writing of the report or decision of publication of the results.
Abbreviations
- AHEI
Alternative Healthy Eating Index
- hsCRP
High-sensitivity C-reactive protein
- HT
Hormone therapy
- ICC
Intra-class correlation coefficient
- IGFBP-3
IGF binding protein-3
- IR
Insulin resistance
- MHI-5
Five-item Mental Health Inventory
- NHS
Nurses’ Health Study
- NHSII
Nurses’ Health Study II
- SHBG
Sex hormone binding globin
Footnotes
Duality of interest The authors declare that there is no duality of interest associated with this manuscript.
Data availability The datasets generated during and/or analysed for the current study are not publicly accessible but are available from the corresponding author on reasonable request.
Reference
- [1].International Diabetes Federation IDF (2017) Diabetes Atlas. Available from http://www.diabetesatlas.org/key-messages.html
- [2].Mathers CD, Loncar D (2006) Projections of global mortality and burden of disease from 2002 to 2030. PloS Med 3: e442. [DOI] [PMC free article] [PubMed] [Google Scholar]
- [3].Kahn SE, Cooper ME, Del Prato S (2014) Pathophysiology and treatment of type 2 diabetes: perspectives on the past, present, and future. Lancet 383: 1068–1083 [DOI] [PMC free article] [PubMed] [Google Scholar]
- [4].Huang Y, Chang Y (2014) Regulation of pancreatic islet beta-cell mass by growth factor and hormone signaling. Prog Mol Biol Transl Sci 121: 321–349 [DOI] [PubMed] [Google Scholar]
- [5].Ben-Jonathan N, Hugo ER, Brandebourg TD, LaPensee CR (2006) Focus on prolactin as a metabolic hormone. Trends Endocrinol Metab 17: 110–116 [DOI] [PubMed] [Google Scholar]
- [6].Bernard V, Young J, Chanson P, Binart N (2015) New insights in prolactin: pathological implications. Nat Rev Endocrinol 11: 265–275 [DOI] [PubMed] [Google Scholar]
- [7].Brandebourg T, Hugo E, Ben-Jonathan N (2007) Adipocyte prolactin: regulation of release and putative functions. Diabetes Obes Metab 9: 464–476 [DOI] [PubMed] [Google Scholar]
- [8].Cejkova P, Fojtikova M, Cerna M (2009) Immunomodulatory role of prolactin in diabetes development. Autoimmun Rev 9: 23–27 [DOI] [PubMed] [Google Scholar]
- [9].Freeman ME, Kanyicska B, Lerant A, Nagy G (2000) Prolactin: structure, function, and regulation of secretion. Physiol Rev 80: 1523–1631 [DOI] [PubMed] [Google Scholar]
- [10].Terra LF, Garay-Malpartida MH, Wailemann RA, Sogayar MC, Labriola L (2011) Recombinant human prolactin promotes human beta cell survival via inhibition of extrinsic and intrinsic apoptosis pathways. Diabetologia 54: 1388–1397 [DOI] [PubMed] [Google Scholar]
- [11].Weinhaus AJ, Stout LE, Bhagroo NV, Brelje TC, Sorenson RL (2007) Regulation of glucokinase in pancreatic islets by prolactin: a mechanism for increasing glucose- stimulated insulin secretion during pregnancy. J Endocrinol 193: 367–381 [DOI] [PubMed] [Google Scholar]
- [12].Ruiz-Herrera X, de Los Rios EA, Diaz JM et al. (2017) Prolactin promotes adipose tissue fitness and insulin sensitivity in obese males. Endocrinology 158: 56–68 [DOI] [PubMed] [Google Scholar]
- [13].Yu J, Xiao F, Zhang Q et al. (2013) PRLR regulates hepatic insulin sensitivity in mice via STAT5. Diabetes 62: 3103–3113 [DOI] [PMC free article] [PubMed] [Google Scholar]
- [14].Park S, Kim DS, Daily JW, Kim SH (2011) Serum prolactin concentrations determine whether they improve or impair beta-cell function and insulin sensitivity in diabetic rats. Diabetes Metab Res Rev 27: 564–574 [DOI] [PubMed] [Google Scholar]
- [15].Costanza M, Binart N, Steinman L, Pedotti R (2015) Prolactin: a versatile regulator of inflammation and autoimmune pathology. Autoimmun Rev 14: 223–230 [DOI] [PubMed] [Google Scholar]
- [16].Wagner R, Heni M, Linder K et al. (2014) Age-dependent association of serum prolactin with glycaemia and insulin sensitivity in humans. Acta Diabetol 51: 71–78 [DOI] [PubMed] [Google Scholar]
- [17].Wang T, Lu J, Xu Y et al. (2013) Circulating prolactin associates with diabetes and impaired glucose regulation: a population-based study. Diabetes Care 36: 1974–1980 [DOI] [PMC free article] [PubMed] [Google Scholar]
- [18].Balbach L, Wallaschofski H, Volzke H, Nauck M, Dorr M, Haring R (2013) Serum prolactin concentrations as risk factor of metabolic syndrome or type 2 diabetes? BMC Endocr Disord 13: 12. [DOI] [PMC free article] [PubMed] [Google Scholar]
- [19].Wang T, Xu Y, Xu M et al. (2016) Circulating prolactin and risk of type 2 diabetes: a prospective study. Am J Epidemiol 184: 295–301 [DOI] [PubMed] [Google Scholar]
- [20].Retnakaran R, Ye C, Kramer CK et al. (2016) Maternal serum prolactin and prediction of postpartum beta-cell function and risk of prediabetes/diabetes. Diabetes Care 39: 1250–1258 [DOI] [PubMed] [Google Scholar]
- [21].Therkelsen KE, Abraham TM, Pedley A et al. (2016) Association between prolactin and incidence of cardiovascular risk factors in the Framingham Heart Study. J Am Heart Assoc 5: pii: e002640. [DOI] [PMC free article] [PubMed] [Google Scholar]
- [22].Sinha YN (1995) Structural variants of prolactin: occurrence and physiological significance. Endocr Rev 16: 354–369 [DOI] [PubMed] [Google Scholar]
- [23].Hankinson SE, Willett WC, Manson JE et al. (1995) Alcohol, height, and adiposity in relation to estrogen and prolactin levels in postmenopausal women. J Natl Cancer Inst 87: 1297–1302 [DOI] [PubMed] [Google Scholar]
- [24].Zhang X, Tworoger SS, Eliassen AH, Hankinson SE (2013) Postmenopausal plasma sex hormone levels and breast cancer risk over 20 years of follow-up. Breast Cancer Res Treat 137: 883–892 [DOI] [PMC free article] [PubMed] [Google Scholar]
- [25].Tworoger SS, Sluss P, Hankinson SE (2006) Association between plasma prolactin concentrations and risk of breast cancer among predominately premenopausal women. Cancer Res 66: 2476–2482 [DOI] [PubMed] [Google Scholar]
- [26].Tworoger SS, Eliassen AH, Zhang X et al. (2013) A 20-year prospective study of plasma prolactin as a risk marker of breast cancer development. Cancer Res 73: 4810–4819 [DOI] [PMC free article] [PubMed] [Google Scholar]
- [27].Kotsopoulos J, Tworoger SS, Campos H et al. (2010) Reproducibility of plasma and urine biomarkers among premenopausal and postmenopausal women from the Nurses’ Health Studies. Cancer Epidemiol Biomarkers Prev 19: 938–946 [DOI] [PMC free article] [PubMed] [Google Scholar]
- [28].Tworoger SS, Eliassen AH, Rosner B, Sluss P, Hankinson SE (2004) Plasma prolactin concentrations and risk of postmenopausal breast cancer. Cancer Res 64: 6814–6819 [DOI] [PubMed] [Google Scholar]
- [29].Tworoger SS, Eliassen AH, Sluss P, Hankinson SE (2007) A prospective study of plasma prolactin concentrations and risk of premenopausal and postmenopausal breast cancer. J Clin Oncol 25: 1482–1488 [DOI] [PubMed] [Google Scholar]
- [30].Tworoger SS, Rice MS, Rosner BA, Feeney YB, Clevenger CV, Hankinson SE (2015) Bioactive prolactin levels and risk of breast cancer: a nested case-control study. Cancer Epidemiol Biomarkers Prev 24: 73–80 [DOI] [PMC free article] [PubMed] [Google Scholar]
- [31].Heidemann C, Sun Q, van Dam RM et al. (2008) Total and high-molecular-weight adiponectin and resistin in relation to the risk for type 2 diabetes in women. Ann Intern Med 149: 307–316 [DOI] [PMC free article] [PubMed] [Google Scholar]
- [32].Qi L, Rifai N, Hu FB (2009) Interleukin-6 receptor gene, plasma C-reactive protein, and diabetes risk in women. Diabetes 58: 275–278 [DOI] [PMC free article] [PubMed] [Google Scholar]
- [33].Rice MS, Tworoger SS, Rosner BA, Pollak MN, Hankinson SE, Tamimi RM (2012) Insulin-like growth factor-1, insulin-like growth factor-binding protein-3, growth hormone, and mammographic density in the Nurses’ Health Studies. Breast Cancer Res Treat 136: 805–812 [DOI] [PMC free article] [PubMed] [Google Scholar]
- [34].Schulze MB, Solomon CG, Rifai N et al. (2005) Hyperproinsulinaemia and risk of type 2 diabetes mellitus in women. Diabet Med 22: 1178–1184 [DOI] [PubMed] [Google Scholar]
- [35].Okereke OI, Pollak MN, Hu FB, Hankinson SE, Selkoe DJ, Grodstein F (2008) Plasma C-peptide levels and rates of cognitive decline in older, community-dwelling women without diabetes. Psychoneuroendocrinology 33: 455–461 [DOI] [PMC free article] [PubMed] [Google Scholar]
- [36].Arroyo C, Hu FB, Ryan LM et al. (2004) Depressive symptoms and risk of type 2 diabetes in women. Diabetes Care 27: 129–133 [DOI] [PMC free article] [PubMed] [Google Scholar]
- [37].Manson JE, Rimm EB, Stampfer MJ et al. (1991) Physical activity and incidence of noninsulin-dependent diabetes mellitus in women. Lancet 338: 774–778 [DOI] [PubMed] [Google Scholar]
- [38].National Diabetes Data Group (1979) Classification and diagnosis of diabetes mellitus and other categories of glucose intolerance. Diabetes 28: 1039–1057 [DOI] [PubMed] [Google Scholar]
- [39].Expert Committee on the Diagnosis and Classification of Diabetes Mellitus (2003) Report of the expert committee on the diagnosis and classification of diabetes mellitus. Diabetes Care 26(Suppl 1): S5–S20 [DOI] [PubMed] [Google Scholar]
- [40].McCullough ML, Feskanich D, Stampfer MJ et al. (2002) Diet quality and major chronic disease risk in men and women: moving toward improved dietary guidance. Am J Clin Nutr 76: 1261–1271 [DOI] [PubMed] [Google Scholar]
- [41].Song M, Hu FB, Wu K et al. (2016) Trajectory of body shape in early and middle life and all cause and cause specific mortality: results from two prospective US cohort studies. BMJ 353: i2195. [DOI] [PMC free article] [PubMed] [Google Scholar]
- [42].Rosner B (1983) Percentage points for a generalized ESD many-outlier procedure. Technometrics 25: 165–172 [Google Scholar]
- [43].Rosner B, Cook N, Portman R, Daniels S, Falkner B (2008) Determination of blood pressure percentiles in normal-weight children: some methodological issues. Am J Epidemiol 167: 653–666 [DOI] [PubMed] [Google Scholar]
- [44].Daimon M, Kamba A, Murakami H et al. (2017) Association between serum prolactin levels and insulin resistance in non-diabetic men. PloS One 12: e0175204. [DOI] [PMC free article] [PubMed] [Google Scholar]
- [45].Newey PJ, Gorvin CM, Cleland SJ et al. (2013) Mutant prolactin receptor and familial hyperprolactinemia. N Engl J Med 369: 2012–2020 [DOI] [PMC free article] [PubMed] [Google Scholar]
- [46].Berinder K, Nystrom T, Hoybye C, Hall K, Hulting AL (2011) Insulin sensitivity and lipid profile in prolactinoma patients before and after normalization of prolactin by dopamine agonist therapy. Pituitary 14: 199–207 [DOI] [PubMed] [Google Scholar]
- [47].Majumdar A, Mangal NS (2013) Hyperprolactinemia. J Hum Reprod Sci 6: 168–175 [DOI] [PMC free article] [PubMed] [Google Scholar]
- [48].Hankinson SE, Manson JE, Spiegelman D, Willett WC, Longcope C, Speizer FE (1995) Reproducibility of plasma hormone levels in postmenopausal women over a 2–3-year period. Cancer Epidemiol Biomarkers Prev 4: 649–654 [PubMed] [Google Scholar]
- [49].Lawson DM, Sensui N, Haisenleder DH, Gala RR (1982) Rat lymphoma cell bioassay for prolactin: observations on its use and comparison with radioimmunoassay. Life Sciences 31: 3063–3070 [DOI] [PubMed] [Google Scholar]
- [50].Tanaka T, Shiu RP, Gout PW, Beer CT, Noble RL, Friesen HG (1980) A new sensitive and specific bioassay for lactogenic hormones: measurement of prolactin and growth hormone in human serum. J Clin Endocrinol Metab 51: 1058–1063 [DOI] [PubMed] [Google Scholar]
- [51].Schernhammer ES, Tworoger SS, Eliassen AH et al. (2007) Body shape throughout life and correlations with IGFs and GH. Endocr Relat Cancer 14: 721–732 [DOI] [PubMed] [Google Scholar]
- [52].Moldrup A, Petersen ED, Nielsen JH (1993) Effects of sex and pregnancy hormones on growth hormone and prolactin receptor gene expression in insulin-producing cells. Endocrinology 133: 1165–1172 [DOI] [PubMed] [Google Scholar]
- [53].Sorenson RL, Brelje TC (1997) Adaptation of islets of Langerhans to pregnancy: beta cell growth, enhanced insulin secretion and the role of lactogenic hormones. Horm Metab Res 29: 301–307 [DOI] [PubMed] [Google Scholar]
- [54].Tovar S, Dieguez C (2014) Prolactin and energy homeostasis: pathophysiological mechanisms and therapeutic considerations. Endocrinology 155: 659–662 [DOI] [PubMed] [Google Scholar]
- [55].Jones AG, Hattersley AT (2013) The clinical utility of C-peptide measurement in the care of patients with diabetes. Diabet Med 30: 803–817 [DOI] [PMC free article] [PubMed] [Google Scholar]
- [56].Polonsky KS, Rubenstein AH (1984) C-Peptide as a measure of the secretion and hepatic extraction of insulin: pitfalls and limitations. Diabetes 33: 486–494 [DOI] [PubMed] [Google Scholar]
Associated Data
This section collects any data citations, data availability statements, or supplementary materials included in this article.