Abstract
Objectives
Excessive exposure to acetaminophen (APAP, paracetamol) can cause liver injury through formation of a reactive metabolite that depletes hepatic glutathione and causes hepatocellular oxidative stress and damage. Generation of this metabolite is mediated by Cytochrome-P450 (CYP) isoforms, mainly CYP2E1. A number of naturally occurring flavonoids can mitigate APAP-induced hepatotoxicity in experimental animal models. Our objective was to determine the mechanism of these protective effects and to evaluate possible human applicability.
Methods
Two flavonoids, luteolin and quercetin, were evaluated as potential inhibitors of eight human CYP isoforms, of six UDP-glucuronosyltransferase (UGT) isoforms and of APAP glucuronidation and sulfation. The experimental model was based on in-vitro metabolism by human liver microsomes, using isoform-specific substrates.
Key findings
Luteolin and quercetin inhibited human CYP isoforms to varying degrees, with greatest potency towards CYP1A2 and CYP2C8. However, 50% inhibitory concentrations (IC50 values) were generally in the micromolar range. UGT isoforms were minimally inhibited. Both luteolin and quercetin inhibited APAP sulfation but not glucuronidation.
Conclusions
Inhibition of human CYP activity by luteolin and quercetin occurred with IC50 values exceeding customary in-vivo human exposure with tolerable supplemental doses of these compounds. The findings indicate that luteolin and quercetin are not likely to be of clinical value for preventing or treating APAP-induced hepatotoxicity.
Keywords: acetaminophen, CYPs, drug interactions, flavonoids, UDP-glucuronosyltransferase
Introduction
Acetaminophen-induced hepatotoxicity is the leading cause of acute liver failure in the United States.[1] The key mechanism in APAP-induced hepatotoxicity is the CYP450-catalysed formation of the reactive metabolite, NAPQI, which depletes hepatic glutathione and accumulates to cause liver damage.[2] Approximately 5–9% of an orally administered APAP is metabolized by the CYP450-dependent oxidation pathways. CYP3A4,[3,4] CYP2E1,[3,5] CYP1A2,[6] CYP2D6[7] and CYP2A6[8] are involved in the formation of NAPQI. Parallel to the CYP450-dependent oxidation, the majority of an orally administered dose of APAP is metabolized by glucuronidation (about two-thirds) and sulfation (about one-third). Both of these metabolic pathways produce non-toxic conjugates. UGT1A1, UGT1A6, UGT1A9 and UGT2B15 are important UGTs involved in the glucuronidation of APAP.[9–12] SULT1A1, SULT1A3/4, SULT1E1 and SULT2A1 have been reported to be major contributors to APAP sulfation.[13]
A number of compounds have been studied for their possible protective effects against APAP-induced hepatotoxicity in animal models as well as clinically.[14,15] For an example, in a mouse study, simultaneous treatment of cimetidine at 75 mg/kg with APAP significantly increased the LD50 of APAP.[16] Cimetidine inhibits CYP1A2, CYP2C9, CYP2D6 and CYP3A4 both in vitro and clinically.[17] Cimetidine also inhibits APAP glucuronidation in vitro, but with a Ki value 10-fold higher than for CYP450-dependent oxidation.[18] Therefore, the protective effects of cimetidine in mouse[16] may be due to its greater inhibition of the CYP450-dependent oxidation compared to glucuronidation. However, cimetidine did not protect against APAP-induced hepatotoxicity in humans, as the required exposure could not be achieved with tolerable doses.[15]
Phytochemicals, such as flavonoids, in herbal extracts have protective effects on liver toxicity in experimental animals.[19–21] Although the protective effect is usually attributed to antioxidant activity, this has not been clearly established, in part because the diversity of phytochemicals in various herbs makes it difficult to identify the effective chemical components.[22]
Flavonoids are widely distributed in edible plants such as fruits and vegetables. Quercetin (a flavonoid) is beneficial in alleviating APAP-induced hepatotoxicity in experimental animals.[19,21] A study using a freshwater fish showed that the abnormalities associated with APAP exposure were reversed on treatment with celery extract, which contains flavonoids such as rutin, quercetin and luteolin.[20]
The main goal of this study was to examine in vitro the inhibitory effects of luteolin and quercetin on the metabolic pathways of APAP, namely CYP-mediated oxidation, glucuronidation and sulfation, to investigate whether the flavonoids of interest have possible beneficial effects against APAP-induced hepatotoxicity. The study has the further objective of evaluating the extent to which protective effects in animal models can be attributed to metabolic effects of the flavonoids.
Materials and Methods
Materials and chemicals
Chemicals and solvents were purchased from Sigma-Aldrich Corp (St. Louis, MO, USA) or Fisher Scientific (Pittsburgh, PA, USA). Water was purified with a Milli-Q system (Millipore, MA, USA). Pooled human liver S9 was purchased from Celsis (Chicago, IL, USA).
In-vitro inhibition studies on CYP450-mediated oxidation and on glucuronidation using HLMs
The pooled HLMs used in this study contained a mixture of 53 individual human liver microsomes. Individual HLMs were prepared as previously described.[23,24] Incubation procedures for the in-vitro inhibition studies on CYP-mediated oxidation[23,25,26] and on glucuronidation[27,28] were used, with modifications. Briefly, stock solutions of the index substrates were prepared in methanol at micromolar concentrations and stored at −20°C. The stock solutions were allowed to equilibrate to room temperature, and appropriate quantities were added to incubation tubes. Propofol (the UGT1A9 substrate) was prepared in DMSO and added directly to the incubation mixtures (1% DMSO v/v) due to its poor solubility in methanol. Luteolin (or quercetin) in concentrations of 0, 2, 10, 30, 60, 100, 200 and 600 μm was added to separate incubation tubes, except for CYP3A studies in which 14 concentration points for luteolin (0, 0.1, 0.2, 0.4, 0.8, 2, 4, 8, 10, 20, 30, 40, 60, 100 μm) were used to generate more defined kinetic curves. The solvent (methanol) was evaporated to dryness at 40°C under mild vacuum conditions. Methanol (1% v/v) was then added to reconstitute luteolin (or quercetin) before the addition of the incubation mixture. The incubation mixture for CYP450-mediated oxidation consisted of 50 mm phosphate buffer (pH 7.5), 5 mm MgCl2, 0.5 mm NADP, isocitrate with an isocitric dehydrogenase regenerating system and an appropriate amount of the pooled HLMs.[26]
To evaluate the possibility of time-dependent inhibition, luteolin (or quercetin) was preincubated with the HLM proteins in the incubation mixtures at 37°C for 20 min. The preincubated contents (250 μl) were then transferred into the incubation tubes containing the index substrates for another timed incubation. Parallel incubations without preincubation were also conducted for comparison, as identification of increased inhibitory potency of inhibitors when the inhibitors are preincubated with HLMs and cofactors is consistent with mechanism-based or time-dependent inhibition. The reactions were stopped by adding 100 μl of acetonitrile (or acidified acetonitrile with 85% H3PO4 for CYP2B6 and CYP2C9) with an appropriate internal standard. After centrifugation, the supernatant was transferred to HPLC vials for HPLC-UV or HPLC-fluorescence analysis.
For the glucuronidation studies, luteolin (or quercetin) in concentrations of 0, 0.5, 2.5, 10, 50, 100 and 250 μm was added to separate tubes before evaporation of the solvent (methanol). The incubation mixture for glucuronidation contained 50 mm phosphate buffer (pH 7.5), 5 mm MgCl2, alamethicin at 50 ng per mg protein and an appropriate amount of the pooled HLMs (50–500 μg/ml). Mixtures were kept on ice for 5 min before use. The solution of UDPGA was prepared separately in phosphate buffer (50 mm, pH 7.5). Reactions were started by addition of UDPGA at a final concentration of 10 mm in the 100 μl incubation mixture. The incubations were carried out with or without a 20-min preincubation to evaluate whether the inhibition was time-dependent inhibition; 40 μl of acetonitrile (or acidified acetonitrile with 85% H3PO4 for UGT2B7 and APAP glucuronidation) with internal standards was used to stop the reactions. After centrifugation, the supernatant was transferred to HPLC vials for HPLC-UV analysis.
Solvent effects of methanol and DMSO on human hepatic CYPs
The effects of methanol and DMSO on selected human CYP enzymes were investigated. Briefly, various percentages of methanol or DMSO (0, 0.05, 0.1, 0.5, 1 and 2% v/v) were introduced into the incubation mixtures containing specific index substrates. All incubations were performed in duplicate with pooled HLMs and without preincubation. Samples were incubated at 37°C for appropriate durations and stopped by an addition of 100 μl cold acetonitrile (in 250 μl of the incubation mixture) with internal standards. To minimize the solvent effects, controls containing the same percentages of methanol or DMSO as the incubation samples were used to normalize each sample.
In-vitro inhibition studies on APAP sulfation
The incubation procedures for APAP sulfation were based on previously published methods, with modifications.[29,30] Briefly, APAP as the substrate was added to incubation tubes, and the solvent (methanol) was evaporated to dryness at 40°C under mild vacuum conditions. The concentration of APAP was 0.6 mm in the final volume of 100 μl. Luteolin at concentrations of 0, 0.025, 0.05, 0.1, 0.25, 0.5, 1, 2.5 and 10 μm and quercetin at concentrations of 0, 0.1, 0.5, 1, 2.5, 10, 50 and 100 μm were added to separate incubation tubes, and the solvent (methanol) was evaporated to dryness. One percent (v/v) methanol was then added to reconstitute luteolin (or quercetin). The incubation mixture for APAP sulfation was prepared with 50 mm phosphate buffer (pH 7.5), 5 mm MgCl2 and 800 μg/ml pooled human S9. The PAPS cofactor solution (PAPS at 0.2 mm) was freshly prepared in water separately, prior to the incubation experiments. The reactions were started with an addition of the PAPS solution into the incubation mixture (100 μl). After 2-h incubation at 37°C, the reaction was stopped with 40 μl of acidified acetonitrile with 0.5% (v/v) of 85% H3PO4 and with 3-AAP as the internal standard. After centrifugation, the supernatant was transferred to HPLC vials for HPLC-UV.
Analytical methods
In-vitro samples were analysed using previously described methods.[25,26,28] Representative HPLC chromatograms are shown in Figures S1–S15. APAP glucuronide and sulfate generated from the in-vitro incubations of APAP were analysed as reported previously.[26,31] The software Chemstation (Agilent, Santa Clara, CA, USA) was used for integration and quantitation.
Statistical methods
IC50 values were determined by nonlinear regression analysis. The appropriate hyperbolic function was fitted to data points using SigmaPlot 11.0 (Systat Software, San Jose, CA, USA). These methods have been described in detail previously.[23,26] Goodness of fit was validated by visual analysis and by R-square values. Additional statistical analysis was not undertaken, as no quantitative inferential judgements related to statistical comparisons of IC50 values were needed in this study.
Results
IC50 values of luteolin and quercetin
The in-vitro IC50 values for luteolin and quercetin vs individual CYP and UGT enzymes in the pooled HLMs obtained from this study are summarized in Table 1. Both luteolin and quercetin inhibited human hepatic CYP1A2, CYP3A, CYP2B6, CYP2C8, CYP2C9, CYP2C19, CYP2D6 and CYP2E1 (Figures 1 and 2) as well as UGT1A1 and UGT1A4 (Figure 3), with various IC50 values. Up to the highest tested concentrations of luteolin and quercetin (600 μm for the CYP systems and 250 μm for the UGT systems), IC50s for luteolin and quercetin vs UGT1A6, UGT1A9, UGT2B7 and UGT2B15 could not be calculated due to <50% inhibition (Figure S16). For some of the substrate–inhibitor combinations, the preincubation procedure was associated with a reduction in the IC50 values (or increased inhibitory potency) (Figures 1 and 2). This indicates the possibility of time-dependent inhibition (mechanism-based inhibition).[32,33] However, the magnitude of reduction of IC50 was modest at most.
Table 1.
IC50 values for luteolin, quercetin, probenecid, MEOH and DMSO vs human hepatic CYPs and UGTs
| Luteolin | Quercetin | Probenecid | MEOH | DMSO | ||||
|---|---|---|---|---|---|---|---|---|
| Wa (μm) | W/Ob (μm) | W (μm) | W/O (μm) | W (mm) | W/O (mm) | W/O (%) | W/O (%) | |
| CYP1A2 | 1.6 | 3.5 | 4.5 | 5.2 | – | – | NC | NC |
| CYP3A | 6.1 | 12.4 | 7.5 | 10.4 | – | – | NC | NC |
| CYP2B6 | 37.8 | 103.4 | 41.7 | 89.2 | – | – | NC | NC |
| CYP2C8 | 0.61 | 2.50 | 4.72 | 2.40 | – | – | NC | NC |
| CYP2C9 | 13.8 | 28.9 | 21.7 | 72.1 | – | – | NC | 2.4 |
| CYP2C19 | 47.9 | NCc | 57.0 | 140.0 | – | – | NC | NC |
| CYP2D6 | 132.6 | 152.7 | 99.4 | 233.6 | – | – | NC | NC |
| CYP2E1 | 81.8 | 89.3 | 58 | 66.2 | – | – | 0.63 | 0.06 |
| UGT1A1 | 93 | 44 | 86 | 54 | – | – | – | – |
| UGT1A4 | –d | 41.0 | – | 35.0 | – | – | – | – |
| UGT1A6 | – | NC | – | NC | – | – | – | – |
| UGT1A9 | – | NC | – | NC | – | – | – | – |
| UGT2B7 | – | NC | – | g | – | – | – | – |
| UGT2B15 | – | NC | – | NC | – | – | – | – |
| APAP-Glucuronidatione | NC | NC | 281.1 | NC | 0.42 | 0.5 | – | – |
| APAP-sulfationf | – | 1.1 | – | 3.5 | – | – | – | – |
aIncubations with preincubation; bincubations without preincubation; cNC, not calculated (no IC50 values were obtained due to <50% inhibition at the highest tested concentrations: 600 μm of luteolin and quercetin for the CYP systems and 250 μm of luteolin and quercetin for the UGT systems, respectively. The highest tested percentage for methanol and DMSO was 2%); dnot tested; eAPAP glucuronidation is a mixed effect of several UGT isoforms including UGT1A6, 1A1, 1A9 and 2B15; fAPAP sulfation is a mixed effect of several SULT isoforms; g52% inhibition at 250 μm.
Figure 1.
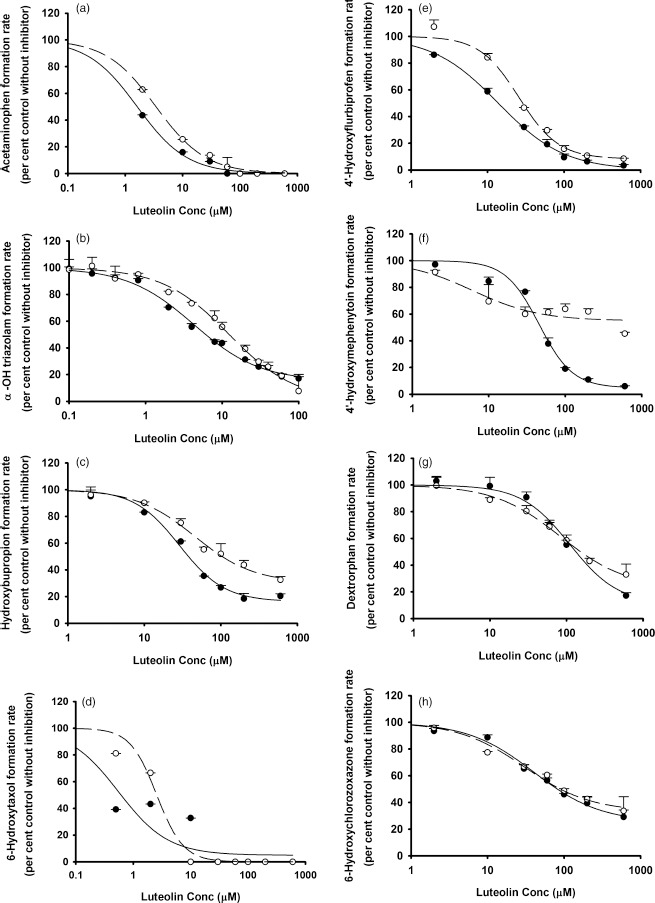
In vitro inhibitory effects of luteolin on (a) CYP1A2, (b) CYP3A, (c) CYP2B6, (d) CYP2C8, (e) CYP2C9, (f) CYP2C19, (g) CYP2D6 and (h) CYP2E1. Data points represent the means ± standard errors (SEM) of each concentration that was tested in duplicate. The dashed and solid lines represent the incubations without and with preincubation. IC50 values were determined by nonlinear regression and summarized in Table 1.
Figure 2.
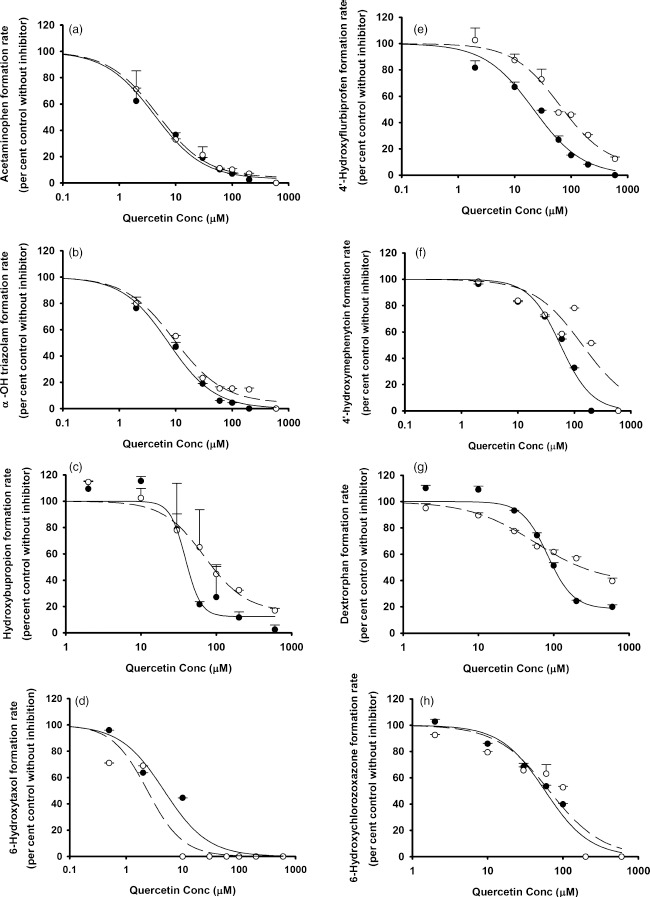
In vitro inhibitory effects of quercetin on (a) CYP1A2, (b) CYP3A, (c) CYP2B6, (d) CYP2C8, (e) CYP2C9, (f) CYP2C19, (g) CYP2D6 and (h) CYP2E1. Data points represent the means ± standard errors (SEM) of each concentration that was tested in duplicate. The dashed and solid lines represent the incubations without and with preincubation. IC50 values were determined by nonlinear regression and summarized in Table 1.
Figure 3.
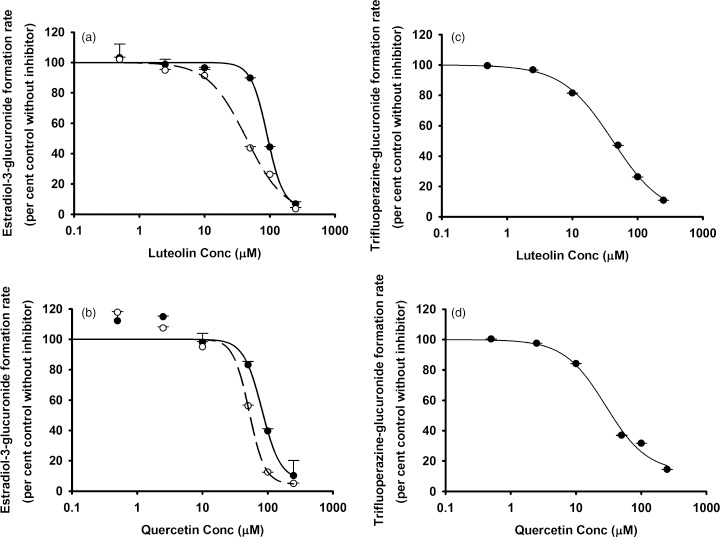
In vitro inhibitory effects of luteolin and quercetin on (a and b) UGT1A1 or (c and d) UGT1A4. Data points represent the means ± standard errors (SEM) of each concentration that was tested in duplicate. The dashed and solid lines represent the incubations without and with preincubation. IC50 values were determined by nonlinear regression and summarized in Table 1. UGT, UDP-glucuronosyltransferase.
In the studies using APAP as substrate, probenecid, the positive control inhibitor of APAP glucuronidation, yielded an IC50 value of 0.5 mm. Luteolin and quercetin produced minimal inhibition of APAP glucuronidation (Figure 4). Both luteolin and quercetin were strong inhibitors of APAP sulfation, with IC50 values of 1.1 and 3.5 μm, respectively (Figure 5).
Figure 4.
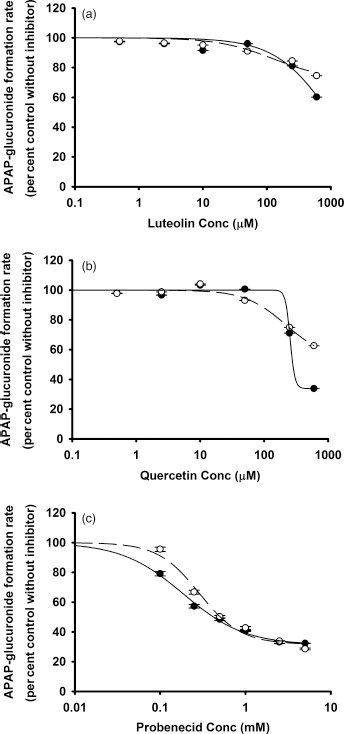
In vitro inhibitory effects of (a) luteolin, (b) quercetin and (c) probenecid on APAP glucuronidation with the pooled HLMs. The concentrations of probenecid are 0, 0.1, 0.25, 0.5, 1, 2.5 and 5 mm. Data points represent the means ± standard errors (SEM) of each drug concentration that was tested in duplicate. The dashed and solid lines represent the incubations without and with preincubation. IC50 values were determined by nonlinear regression and summarized in Table 1. HLM, human liver microsome.
Figure 5.
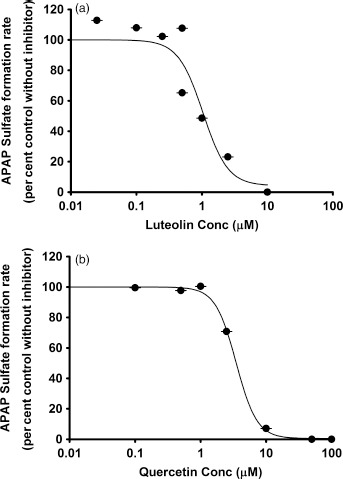
In vitro inhibitory effects of (a) luteolin and (b) quercetin on acetaminophen sulfation. Data points represent the means ± standard errors (SEM) of each drug concentration that was tested in duplicate. IC50 values were determined by nonlinear regression and summarized in Table 1.
Solvent effects of methanol and DMSO on human hepatic CYPs
Organic solvents, namely methanol and DMSO, were used to reconstitute the flavonoids. Their effects on selected human CYP enzymes were thus investigated. Among the tested human CYP450 isoforms, CYP2E1 was the most sensitive to both methanol and DMSO. The IC50 values for methanol and DMSO vs CYP2E1 were 0.63% and 0.06%, respectively. The IC50 value for DMSO on CYP2C9 was 2.4%. CYP2B6 was also partially inhibited by 1% methanol (Table 1, Figure 6 and Figure S17).
Figure 6.
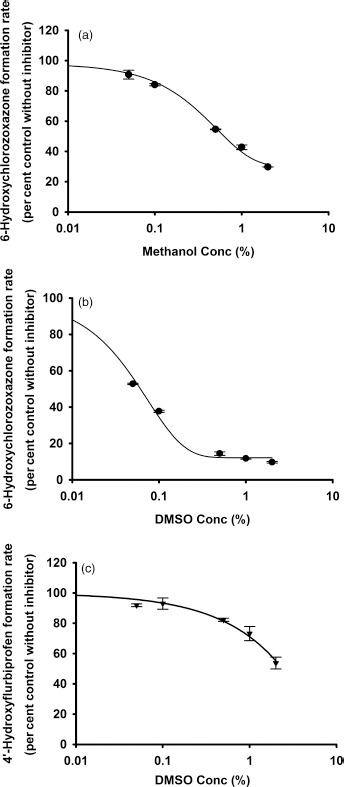
In vitro inhibition of CYP2E1 by (a) methanol and by (b) DMSO; and inhibition of CYP2C9 by (c) DMSO. Data points represent the means ± standard errors (SEM) of each solvent concentration that was tested in duplicate. IC50 values were determined by nonlinear regression and summarized in Table 1. DMSO, dimethyl sulfoxide.
Discussion
Flavonoids are important daily dietary constituents. Typical daily intake of five flavonoids in the United States, including quercetin, kaempferol, myricetin, apigenin and luteolin, was in the range of 20–22 mg.[34] In a Chinese university-campus population, the daily consumption of luteolin was reported as around 8 ± 6 mg/day (Mean ± SD), with plasma concentrations of 101 ± 99 nmol/l.[35] Consumption of dietary supplements containing flavonoids in some populations can substantially increase the systemic exposure to flavonoids. In a study of daily supplementation of quercetin, the median maximum plasma concentrations of quercetin, including its glucuronidated and sulfated metabolites, were 431 nmol/l at 3 h after ingestion of 150 mg quercetin.[36]
Concomitant administration of quercetin with APAP in rats (20 mg/kg, p.o. in normal saline, daily for 15 days) decreased the production of malondialdehyde, which is a by-product of lipid peroxidation indicating the presence of reactive oxygen species. Activity of antioxidant enzymes such as glutathione peroxidase, glutathione S-transferase, superoxide dismutase and catalase (in plasma, brain, lung, heart, liver, kidney and testes) and glutathione content (in lung, liver and kidney) was increased.[21] A study with freshwater fish showed that simultaneous exposure of celery leaf powder (500 mg/kg) with APAP for 24 h alleviated APAP-induced abnormities in tissue lipid peroxidation markers, tissue levels of enzymatic and non-enzymatic antioxidants, cellular thiol levels, the levels of hepatic electrolytes and abnormal liver histology.[20] Based on the outcome of these experimental animal studies, we conducted the in-vitro studies using human tissues (HLMs) in an attempt to evaluate the extent to which the findings could be applicable to humans.
Among CYP isoforms reported to be responsible for the NAPQI production, both luteolin and quercetin inhibited CYP1A2 and CYP3A in vitro, with IC50 values <10 μm (Table 1). It is likely that both luteolin and quercetin could inhibit some component of the CYP-mediated oxidation of APAP by inhibiting CYP1A2 and 3A4 in vivo if the necessary concentrations could be achieved.
Because APAP glucuronidation and sulfation are major pathways of APAP clearance, we also tested whether luteolin or quercetin affect these metabolic pathways. Even though luteolin or quercetin inhibited several individual human hepatic UGTs at levels of 50 μm, they did not inhibit overall APAP glucuronidation (Figure 4). We conclude that APAP glucuronidation is not likely to be inhibited by luteolin or quercetin at dietary levels. As for APAP sulfation, both luteolin and quercetin were strong inhibitors of that pathway (Figure 5).
The large discrepancy between low systemic exposures of flavonoids at dietary levels and the required high concentrations at the tissue sites to exert any potential effects leads to our conclusion in this study. Extrapolation of in-vitro findings to the in-vivo situation is not straightforward. Plasma concentrations of flavonoids are not equivalent to their concentrations at the sites of clinical activity.[37] For example, flavonoids such as luteolin and quercetin may be more concentrated in liver than in plasma.[38] Further, only the unconjugated forms of luteolin and quercetin were studied in the in-vitro systems in this study. However, luteolin and quercetin are extensively transformed to glucuronide and sulfate conjugates as well to as methylated metabolites[39] in vivo. The reported in-vivo plasma concentrations of luteolin or quercetin usually include the conjugated and unconjugated forms due to the enzymatic hydrolysis steps commonly used in the sample preparation. In addition, the inhibitory effects of those major metabolites on hepatic metabolic enzymes have not yet been investigated. In any case, the in-vitro IC50 values observed in this study in general are in the micromolar range, which is greater than reported in-vivo plasma concentrations which are in the nanomolar range.
The present study did not evaluate the selected flavonoids as a potential acute treatment for APAP-induced hepatotoxicity. Even if luteolin and quercetin did have hepatoprotective properties in cases of APAP overdose, the timing of the treatment relative to the time of overdose would be a critical factor. Most patients seek medical attenuation only after most of the drug is already metabolized, and the hepatotoxic damage cannot be reversed.[40,41] At this point, any intervention that only affects drug metabolizing enzymes is unlikely to be efficacious.
In short, we used HLMs to examine the effects of luteolin and quercetin on APAP metabolism in vitro. The findings that luteolin or quercetin could inhibit some component of the CYP-mediated oxidation of APAP, and did not inhibit the APAP glucuronidation pathway, could explain the beneficial effects of luteolin and quercetin against APAP-induced hepatotoxicity observed in experimental animals. However, the observed IC50 values for luteolin and quercetin in vitro substantially exceed usual systemic exposure in humans.
Conclusion
We investigated metabolic interactions between APAP and two flavonoids with in-vitro inhibition studies using HLMs and human liver S9. The inhibitory properties of the unconjugated and aglycone flavonoids, namely luteolin and quercetin, on common human hepatic CYP and UGT enzymes as well as on APAP metabolism were evaluated. In addition to antioxidant activity, we suggest that the beneficial effects of flavonoids (luteolin and quercetin) towards APAP-induced hepatotoxicity in experimental animals could also be explained by their inhibitory properties towards common human hepatic CYPs. However, we estimate that these protective effects in humans are not likely to occur at customary levels of exposure.
Declarations
Conflict of interest
The Author(s) declare(s) that they have no conflicts of interest to disclose.
Funding
This work was supported by Grant HD 071779 from the National Institutes of Health, USA.
Supplementary Material
Figure S1. HPLC chromatogram of phenacetin (a CYP1A2 specific index) and its metabolite generated using HLMs (a) acetaminophen, (b) 2-acetaminophenol as the internal standard and c) phenacetin.
Figure S2. HPLC chromatogram of triazolam (a CYP3A specific index) and its metabolites generated using HLMs (a, b) α-hydroxytriazolam and 4-hydroxytriazolam as the triazolam metabolites formed by HLMs, (c) triazolam.
Figure S3. HPLC chromatogram of bupropion (a CYP2B6 specific index) and its metabolite generated using HLMs (a) 2-acetaminophenol as the IS, b) hydroxybupropion as the bupropion metabolite formed by HLMs and c) bupropion.
Figure S4. HPLC chromatogram of taxol (a CYP2C8 specific index) and its metabolite generated using HLMs (a) phenacetin as the IS (b) 6-hydroxytaxol as the taxol metabolite formed by HLMs, (c) taxol.
Figure S5. HPLC chromatogram of flurbiprofen (a CYP2C9 specific index) and its metabolite generated using HLMs (a) 4′-hydroxyflurbiprofen as the flurbiprofen metabolite formed by HLMs, (b) naproxen as the IS and (c) flurbiprofen.
Figure S6. HPLC chromatogram of s-mephenytoin (a CYP2C19 specific index) and its metabolite generated using HLMs (a) 4′-hydroxymephenytoin as the s-mephenytoin metabolite formed by HLMs, (b) phenacetin as the IS, (c) s-mephenytoin and (d) a case-specific peak of quercetin washout in this particular study.
Figure S7. HPLC chromatograms of dextromethorphan (a CYP2D6 specific index) and its metabolite generated using HLMs (a) dextrorphan as the dextromethorphan metabolite formed by HLMs, (b) pronethalol as the IS, and (c) dextromethorphan.
Figure S8. HPLC chromatograms of chlorzoxazone (a CYP2E1 specific index) and its metabolite generated using HLMs (a) 6-hydroxychlorozoxazone as the chlorzoxazone metabolite formed by HLMs, (b) phenacetin as the IS, and (c) chlorzoxazone.
Figure S9. HPLC chromatogram of the metabolites of β-Estradiol (a UGT1A1 index) generated using HLMs (a, c) estradiol-3-glucuronide and estradiol-17-glucuronide as the β-Estradiol metabolite formed by HLMs, and (b) phenacetin as the IS.
Figure S10. HPLC chromatogram of trifluoperazine (a UGT1A4 specific index) and its metabolite generated using HLMs (a) phenacetin as the IS, (b) trifluoperazine-glucuronide as the trifluoperazine metabolite formed by HLMs, and c) trifluoperazine.
Figure S11. HPLC chromatogram of serotonin (a UGT1A6 index) and its metabolite generated using HLMs (a) serotonin-glucuronide as the serotonin metabolite formed by HLMs, and (b) serotonin.
Figure S12. HPLC chromatogram of the metabolites of propofol (a UGT1A9 index) and its metabolite generated using HLMs (a) 3-acetaminophenol (3-AAP) as the IS, and (b) propofol-glucuronide as the propofol metabolite formed by HLMs.
Figure S13. HPLC chromatogram of 3′-azidothymidine (AZT) (a UGT2B7 index) and its metabolite AZT-glucuronide generated using HLMs, and 3-acetaminophenol as the IS.
Figure S14. HPLC chromatogram of oxazepam (a UGT2B15 specific index) and its metabolites, R-oxazepam glucuronide and S-oxazepam glucuronide, generated using HLMs, and 3-acetaminophenol (3-AAP) as the IS.
Figure S15. HPLC chromatogram of APAP and its metabolites (a) APAP-glucuronide, (b) APAP-sulfate, (c) APAP and (d) 3-acetaminophenol (3AAP) as the IS.
Figure S16. In vitro inhibitory effects of luteolin and quercetin on human hepatic (a) UGT1A1, (b) UGT1A4, (c) UGT1A6, (d) UGT1A9, (e) UGT2B7 and (f) UGT2B15.
Figure S17. Inhibitory effects of (a) methanol and (b) DMSO on human hepatic CYP enzymes in HLMs.
Acknowledgements
In addition, Lei especially thanks Daniel J. Waldon for his scientific advice and encouragement in this study.
References
- Larson AM et al. Acetaminophen-induced acute liver failure: results of a United States multicenter, prospective study. Hepatology 2005; 42: 1364–1372. [DOI] [PubMed] [Google Scholar]
- Miner DJ, Kissinger PT. Evidence for the involvement of N-acetyl-p- quinoneimine in acetaminophen metabolism. Biochem Pharmacol 1979; 28: 3285–3290. [DOI] [PubMed] [Google Scholar]
- Laine JE et al. Acetaminophen bioactivation by human cytochrome P450 enzymes and animal microsomes. Xenobiotica 2009; 39: 11–21. [DOI] [PubMed] [Google Scholar]
- Thummel KE et al. Oxidation of acetaminophen to N-acetyl-p-aminobenzoquinone imine by human CYP3A4. Biochem Pharmacol 1993; 45: 1563–1569. [DOI] [PubMed] [Google Scholar]
- Manyike PT et al. Contribution of CYP2E1 and CYP3A to acetaminophen reactive metabolite formation. Clin Pharmacol Ther 2000; 67: 275–282. [DOI] [PubMed] [Google Scholar]
- Tonge RP et al. Role of CYP1A2 in the hepatotoxicity of acetaminophen: investigations using Cyp1a2 null mice. Toxicol Appl Pharmacol 1998; 153: 102–108. [DOI] [PubMed] [Google Scholar]
- Zhou L et al. Catalysis of the cysteine conjugation and protein binding of acetaminophen by microsomes from a human lymphoblast line transfected with the cDNAs of various forms of human cytochrome P450. J Pharmacol Exp Ther 1997; 281: 785–790. [PubMed] [Google Scholar]
- Chen W et al. Oxidation of acetaminophen to its toxic quinone imine and nontoxic catechol metabolites by baculovirus-expressed and purified human cytochromes P450 2E1 and 2A6. Chem Res Toxicol 1998; 11: 295–301. [DOI] [PubMed] [Google Scholar]
- Court MH, Greenblatt DJ. Molecular basis for deficient acetaminophen glucuronidation in cats. An interspecies comparison of enzyme kinetics in liver microsomes. Biochem Pharmacol 1997; 53: 1041–1047. [DOI] [PubMed] [Google Scholar]
- Court MH, Greenblatt DJ. Molecular genetic basis for deficient acetaminophen glucuronidation by cats: UGT1A6 is a pseudogene, and evidence for reduced diversity of expressed hepatic UGT1A isoforms. Pharmacogenetics 2000; 10: 355–369. [DOI] [PubMed] [Google Scholar]
- Court MH et al. Interindividual variability in acetaminophen glucuronidation by human liver microsomes: identification of relevant acetaminophen UDP-glucuronosyltransferase isoforms. J Pharmacol Exp Ther 2001; 299: 998–1006. [PubMed] [Google Scholar]
- Mutlib AE et al. Kinetics of acetaminophen glucuronidation by UDP-glucuronosyltransferases 1A1, 1A6, 1A9 and 2B15. Potential implications in acetaminophen-induced hepatotoxicity. Chem Res Toxicol 2006; 19: 701–709. [DOI] [PubMed] [Google Scholar]
- Adjei AA et al. Interindividual variability in acetaminophen sulfation by human fetal liver: implications for pharmacogenetic investigations of drug-induced birth defects. Birth Defects Res A Clin Mol Teratol 2008; 82: 155–165. [DOI] [PubMed] [Google Scholar]
- Tran A et al. Protective effect of stiripentol on acetaminophen-induced hepatotoxicity in rat. Toxicol Appl Pharmacol 2001; 170: 145–152. [DOI] [PubMed] [Google Scholar]
- Slattery JT et al. Lack of effect of cimetidine on acetaminophen disposition in humans. Clin Pharmacol Ther 1989; 46: 591–597. [DOI] [PubMed] [Google Scholar]
- Abernethy DR et al. Differential effect of cimetidine on drug oxidation (antipyrine and diazepam) vs. conjugation (acetaminophen and lorazepam): prevention of acetaminophen toxicity by cimetidine. J Pharmacol Exp Ther 1983; 224: 508–513. [PubMed] [Google Scholar]
- Martinez C et al. Comparative in vitro and in vivo inhibition of cytochrome P450 CYP1A2, CYP2D6, and CYP3A by H2-receptor antagonists. Clin Pharmacol Ther 1999; 65: 369–376. [DOI] [PubMed] [Google Scholar]
- Mitchell MC et al. Selective inhibition of acetaminophen oxidation and toxicity by cimetidine and other histamine H2-receptor antagonists in vivo and in vitro in the rat and in man. J Clin Invest 1984; 73: 383–391. [DOI] [PMC free article] [PubMed] [Google Scholar]
- Gilani AH et al. Quercetin exhibits hepatoprotective activity in rats. Biochem Soc Trans 1997; 25: S619. [DOI] [PubMed] [Google Scholar]
- Shivashri C et al. Hepatoprotective action of celery (Apium graveolens) leaves in acetaminophen-fed freshwater fish (Pangasius sutchi). Fish Physiol Biochem 2013; 39: 1057–1069. [DOI] [PubMed] [Google Scholar]
- Yousef MI et al. Potential protective effects of quercetin and curcumin on paracetamol-induced histological changes, oxidative stress, impaired liver and kidney functions and haematotoxicity in rat. Food Chem Toxicol 2010; 48: 3246–3261. [DOI] [PubMed] [Google Scholar]
- Jaeschke H et al. Models of drug-induced liver injury for evaluation of phytotherapeutics and other natural products. Food Chem Toxicol 2013; 55: 279–289. [DOI] [PMC free article] [PubMed] [Google Scholar]
- Greenblatt DJ et al. Mechanism of cytochrome P450-3A inhibition by ketoconazole. J Pharm Pharmacol 2011; 63: 214–221. [DOI] [PubMed] [Google Scholar]
- von Moltke LL et al. Alprazolam metabolism in vitro: studies of human, monkey, mouse, and rat liver microsomes. Pharmacology 1993; 47: 268–276. [DOI] [PubMed] [Google Scholar]
- von Moltke LL et al. Escitalopram (S-citalopram) and its metabolites in vitro: cytochromes mediating biotransformation, inhibitory effects, and comparison to R-citalopram. Drug Metab Dispos 2001; 29: 1102–1109. [PubMed] [Google Scholar]
- Cao L et al. Inhibitory effects of selected antituberculosis drugs on common human hepatic cytochrome P450 and UDP-glucuronosyltransferase enzymes. Drug Metab Dispos 2017; 45: 1035–1043. [DOI] [PMC free article] [PubMed] [Google Scholar]
- Court MH. Interindividual variability in hepatic drug glucuronidation: studies into the role of age, sex, enzyme inducers, and genetic polymorphism using the human liver bank as a model system. Drug Metab Rev 2010; 42: 209–224. [DOI] [PMC free article] [PubMed] [Google Scholar]
- Court MH. Isoform-selective probe substrates for in vitro studies of human UDP-glucuronosyltransferases. Methods Enzymol 2005; 400: 104–116. [DOI] [PubMed] [Google Scholar]
- Miksits M et al. In-vitro sulfation of piceatannol by human liver cytosol and recombinant sulfotransferases. J Pharm Pharmacol 2009; 61: 185–191. [DOI] [PubMed] [Google Scholar]
- Yang CH et al. Sulfation of selected mono-hydroxyflavones by sulfotransferases in vitro: a species and gender comparison. J Pharm Pharmacol 2011; 63: 967–970. [DOI] [PMC free article] [PubMed] [Google Scholar]
- Zhao Y et al. Favipiravir inhibits acetaminophen sulfate formation but minimally affects systemic pharmacokinetics of acetaminophen. Br J Clin Pharmacol 2015; 80: 1076–1085. [DOI] [PMC free article] [PubMed] [Google Scholar]
- Grimm SW et al. The conduct of in vitro studies to address time-dependent inhibition of drug-metabolizing enzymes: a perspective of the pharmaceutical research and manufacturers of America. Drug Metab Dispos 2009; 37: 1355–1370. [DOI] [PubMed] [Google Scholar]
- Bertelsen KM et al. Apparent mechanism-based inhibition of human CYP2D6 in vitro by paroxetine: comparison with fluoxetine and quinidine. Drug Metab Dispos 2003; 31: 289–293. [DOI] [PubMed] [Google Scholar]
- Chun OK et al. Estimated dietary flavonoid intake and major food sources of U.S. adults. J Nutr 2007; 137: 1244–1252. [DOI] [PubMed] [Google Scholar]
- Zhang Y et al. Reproducibility and relative validity of a food frequency questionnaire to assess intake of dietary flavonol and flavone in Chinese university campus population. Nutr Res 2010; 30: 520–526. [DOI] [PubMed] [Google Scholar]
- Egert S et al. Daily quercetin supplementation dose-dependently increases plasma quercetin concentrations in healthy humans. J Nutr 2008; 138: 1615–1621. [DOI] [PubMed] [Google Scholar]
- Moon YJ et al. Quercetin pharmacokinetics in humans. Biopharm Drug Dispos 2008; 29: 205–217. [DOI] [PubMed] [Google Scholar]
- Shimoi K et al. Deglucuronidation of a flavonoid, luteolin monoglucuronide, during inflammation. Drug Metab Dispos 2001; 29: 1521–1524. [PubMed] [Google Scholar]
- Spencer JP. Metabolism of tea flavonoids in the gastrointestinal tract. J Nutr 2003; 133: 3255S–3261S. [DOI] [PubMed] [Google Scholar]
- Larson AM. Acetaminophen hepatotoxicity. Clin Liver Dis 2007; 11: 525–548. [DOI] [PubMed] [Google Scholar]
- Xie Y et al. Time course of acetaminophen-protein adducts and acetaminophen metabolites in circulation of overdose patients and in HepaRG cells. Xenobiotica 2015; 45: 921–929. [DOI] [PMC free article] [PubMed] [Google Scholar]
Associated Data
This section collects any data citations, data availability statements, or supplementary materials included in this article.
Supplementary Materials
Figure S1. HPLC chromatogram of phenacetin (a CYP1A2 specific index) and its metabolite generated using HLMs (a) acetaminophen, (b) 2-acetaminophenol as the internal standard and c) phenacetin.
Figure S2. HPLC chromatogram of triazolam (a CYP3A specific index) and its metabolites generated using HLMs (a, b) α-hydroxytriazolam and 4-hydroxytriazolam as the triazolam metabolites formed by HLMs, (c) triazolam.
Figure S3. HPLC chromatogram of bupropion (a CYP2B6 specific index) and its metabolite generated using HLMs (a) 2-acetaminophenol as the IS, b) hydroxybupropion as the bupropion metabolite formed by HLMs and c) bupropion.
Figure S4. HPLC chromatogram of taxol (a CYP2C8 specific index) and its metabolite generated using HLMs (a) phenacetin as the IS (b) 6-hydroxytaxol as the taxol metabolite formed by HLMs, (c) taxol.
Figure S5. HPLC chromatogram of flurbiprofen (a CYP2C9 specific index) and its metabolite generated using HLMs (a) 4′-hydroxyflurbiprofen as the flurbiprofen metabolite formed by HLMs, (b) naproxen as the IS and (c) flurbiprofen.
Figure S6. HPLC chromatogram of s-mephenytoin (a CYP2C19 specific index) and its metabolite generated using HLMs (a) 4′-hydroxymephenytoin as the s-mephenytoin metabolite formed by HLMs, (b) phenacetin as the IS, (c) s-mephenytoin and (d) a case-specific peak of quercetin washout in this particular study.
Figure S7. HPLC chromatograms of dextromethorphan (a CYP2D6 specific index) and its metabolite generated using HLMs (a) dextrorphan as the dextromethorphan metabolite formed by HLMs, (b) pronethalol as the IS, and (c) dextromethorphan.
Figure S8. HPLC chromatograms of chlorzoxazone (a CYP2E1 specific index) and its metabolite generated using HLMs (a) 6-hydroxychlorozoxazone as the chlorzoxazone metabolite formed by HLMs, (b) phenacetin as the IS, and (c) chlorzoxazone.
Figure S9. HPLC chromatogram of the metabolites of β-Estradiol (a UGT1A1 index) generated using HLMs (a, c) estradiol-3-glucuronide and estradiol-17-glucuronide as the β-Estradiol metabolite formed by HLMs, and (b) phenacetin as the IS.
Figure S10. HPLC chromatogram of trifluoperazine (a UGT1A4 specific index) and its metabolite generated using HLMs (a) phenacetin as the IS, (b) trifluoperazine-glucuronide as the trifluoperazine metabolite formed by HLMs, and c) trifluoperazine.
Figure S11. HPLC chromatogram of serotonin (a UGT1A6 index) and its metabolite generated using HLMs (a) serotonin-glucuronide as the serotonin metabolite formed by HLMs, and (b) serotonin.
Figure S12. HPLC chromatogram of the metabolites of propofol (a UGT1A9 index) and its metabolite generated using HLMs (a) 3-acetaminophenol (3-AAP) as the IS, and (b) propofol-glucuronide as the propofol metabolite formed by HLMs.
Figure S13. HPLC chromatogram of 3′-azidothymidine (AZT) (a UGT2B7 index) and its metabolite AZT-glucuronide generated using HLMs, and 3-acetaminophenol as the IS.
Figure S14. HPLC chromatogram of oxazepam (a UGT2B15 specific index) and its metabolites, R-oxazepam glucuronide and S-oxazepam glucuronide, generated using HLMs, and 3-acetaminophenol (3-AAP) as the IS.
Figure S15. HPLC chromatogram of APAP and its metabolites (a) APAP-glucuronide, (b) APAP-sulfate, (c) APAP and (d) 3-acetaminophenol (3AAP) as the IS.
Figure S16. In vitro inhibitory effects of luteolin and quercetin on human hepatic (a) UGT1A1, (b) UGT1A4, (c) UGT1A6, (d) UGT1A9, (e) UGT2B7 and (f) UGT2B15.
Figure S17. Inhibitory effects of (a) methanol and (b) DMSO on human hepatic CYP enzymes in HLMs.


