

SUMMARY
Although chronic gastrointestinal dysmotility syndromes are a common worldwide health problem, underlying causes for these disorders are poorly understood. We show that flavivirus infection of enteric neurons leads to acute neuronal injury and cell death, inflammation, bowel dilation, and slowing of intestinal transit in mice. Flavivirus primed CD8+ T cells promote these phenotypes, as their absence diminished enteric neuron injury and intestinal transit delays, and their adoptive transfer reestablished dysmotility after flavivirus infection. Remarkably, mice surviving acute flavivirus infection developed chronic gastrointestinal dysmotility that was exacerbated by immunization with an unrelated alphavirus vaccine or exposure to a non-infectious inflammatory stimulus. This model of chronic post-infectious gastrointestinal dysmotility in mice suggests that viral infections with tropism for enteric neurons and the ensuing immune response might contribute to the development of bowel motility disorders in humans. These results suggest an opportunity for unique approaches to diagnosis and therapy of gastrointestinal dysmotility syndromes.
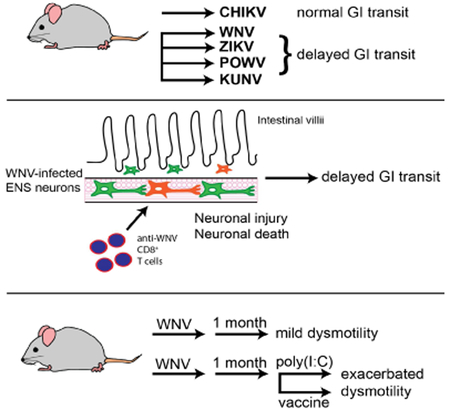
Graphical Abstract
eTOC
Damage caused to enteric neurons during acute flavivirus infections manifest in the form of gastrointestinal abnormalities in later life upon challenge with either infectious or non-infectious inflammatory stimuli
INTRODUCTION
The enteric nervous system (ENS) is comprised of complex neural and glial networks. The myenteric plexus is situated between inner circular and outer longitudinal muscle layers of the bowel (muscularis propria) and primarily controls gut motility. The submucosal plexus is located between the muscularis propria and the mucosa where it regulates intestinal epithelial function and repair, intestinal blood flow, and responses to sensory stimuli (Furness, 2012). ENS dysfunction or degeneration causes several intestinal dysmotility disorders, which present a considerable burden on human health. It is estimated that 10% to 30% of the population of Western countries suffers from some form of intestinal dysmotility (Knowles et al., 2013). One major diagnostic classification, irritable bowel syndrome (IBS), affects 10% of the population (Canavan et al., 2014) causing abdominal pain and diarrhea or constipation. Rare disorders, including chronic intestinal pseudo-obstructive syndrome, Hirschsprung disease, achalasia, and gastroparesis, also cause substantial morbidity and mortality. Dysmotility disorders with established organic causes like Hirschsprung disease typically manifest in childhood (Heuckeroth, 2018; Nurko, 2017), whereas acquired dysmotility disorders are idiopathic but often appear to follow infections or inflammatory events (reviewed in (Klem et al., 2017)).
West Nile virus (WNV) is a mosquito-transmitted flavivirus that causes an acute febrile illness with a subset of cases progressing to meningitis, encephalitis, and death (Suthar et al., 2013). WNV is neurotropic, and infection results in injury to neurons in the cerebral cortex, brain stem, and spinal cord (Samuel et al., 2007; Shrestha et al., 2003). WNV is related genetically to several other neurotropic flaviviruses, including Zika virus (ZIKV), which causes congenital malformations in developing fetuses during pregnancy (Miner and Diamond, 2017), and Powassan virus (POWV), an emerging tick-transmitted flavivirus that causes neuroinvasive disease and long-term neurological sequelae in 50% of survivors (Hermance and Thangamani, 2017).
Less is known about flavivirus infection of enteric neurons. Mice infected with some neurotropic flaviviruses develop gastrointestinal (GI) tract pathology (Kimura et al., 2010; Nagata et al., 2015). Analysis of selected GI tissues from infected rodents showed viral antigen by immunohistochemistry, viral RNA by qRT-PCR (Brown et al., 2007; Nagata et al., 2015), inflammatory lesions of the myenteric plexus, villus blunting, and enterocyte necrosis (Kimura et al., 2010; Nagata et al., 2015). Consistent with these findings, pathological lesions and WNV antigen have been observed in the GI tract of infected birds (Steele et al., 2000; Weingartl et al., 2004). Moreover, multiple human case reports describe GI symptoms (e.g., vomiting, diarrhea, and/or abdominal pain) in people acutely infected with WNV (Chowers et al., 2001; Weiss et al., 2001), and WNV antigen has been detected in the intestine (Armah et al., 2007). However, the consequences of WNV infection on GI tract function have not been explored.
Bacterial (Porter et al., 2013), protozoan (Araujo et al., 2015; Soyturk et al., 2007) and enteric viral (Marshall et al., 2007; Porter et al., 2012; Zanini et al., 2012) agents that cause infectious gastroenteritis have been implicated in the development of GI dysmotility disorders (Klem et al., 2017). Multiple herpesviruses (e.g., herpes simplex virus 1 (HSV-1), varicella-zoster virus, and Epstein Barr virus) also can infect the ENS of humans or experimentally infected animals (Brun et al., 2010; Chen et al., 2011; Debinski et al., 1997; Khoury-Hanold et al., 2016). Analysis of GI tract tissues from human patients with achalasia (Facco et al., 2008; Villanacci et al., 2010) and experimentally infected animals (Brun et al., 2010; Brun et al., 2018) showed infection-induced inflammation of enteric ganglia and immune cell infiltration of the myenteric plexus ganglia and muscularis propria, suggesting a possible immune-mediated pathogenesis of GI dysmotility disorders.
Given that neurotropic flaviviruses reportedly can target cells of the GI tract, we evaluated the consequences of infection. In mice, WNV, ZIKV, and POWV infection of the GI tract acutely resulted in dilation of segments of the small and large intestines. High levels of viral RNA were detected in these tissues, which persisted for weeks in surviving mice. Functional studies revealed that flavivirus-infected mice developed delayed GI transit during the acute phase of infection. Immunohistochemical and flow cytometry analysis of intestinal tissues from WNV-infected mice showed viral antigen localized to enteric ganglia and infiltration of CD3+ lymphocytes and monocytes into the myenteric plexus and muscularis propria within 6 days of infection. This phase of GI dysmotility was in part immune-mediated, as it was absent in WNV-infected mice lacking CD8+ T cells and could be re-established by adoptive transfer of WNV-primed but not naïve CD8+ T cells. Remarkably, survivors of WNV infection sustained chronic delayed GI transit for months, exhibited neuroplastic changes, and were vulnerable to exacerbations of GI dysmotility after immunization with an unrelated alphavirus vaccine or exposure to poly(I:C), a non-infectious inflammatory stimulus. These results suggest that systemic infection by neurotropic viruses can damage the ENS, which leads to an intestinal dysmotility disorder in mice that models features of acute intestinal pseudo-obstruction and chronic IBS in humans.
RESULTS
WNV and ZIKV induce segmental dilation of the mouse intestine.
To define the consequences of flavivirus infection in the GI tract, we inoculated wild-type (WT) C57BL/6 mice with WNV (New York, 1999) or ZIKV (Dakar, 1984). WNV infected mice displayed dilatation of intestinal segments that was readily apparent by day 8 and showed increased penetrance by day 10 (Fig 1A and B). Comparable penetrance of a similar intestinal phenotype occurred in ZIKV-infected mice that were additionally treated with anti-Ifnar1 monoclonal antibody (mAb) (Fig 1A and C); blockade of type I interferon (IFN) signaling was necessary to facilitate systemic ZIKV infection (Lazear et al., 2016; Miner et al., 2016). We noted some degree of regional specificity of intestinal dilation, as the greatest frequency of lesions occurred in the mid- and distal small intestines of WNV- (Fig S1A-E) and ZIKV- (Fig S1F-J) infected mice. None of the sham-infected littermate mice showed evidence of bowel dilation.
Figure 1. Flavivirus-induced GI tract pathology.

(A) Macroscopic GI tract pathology exhibited at day 10 after CHIKV, WNV, or ZIKV infection. GI tracts from naïve and uninfected anti-Ifnar1 mAb injected mice are shown as controls. Black and red arrows: regions of intestinal dilation and adjacent more normal appearing regions, respectively. Black boxes: regions magnified in images to the right. Data are representative of three experiments. (B-D) Proportions of mice with dilated bowel after WNV (B), ZIKV (C) or CHIKV (D) infection. Results are from three experiments with n = 10 (both day 8 and 10, sham), n = 13 and 12 (day 8 and day 10, WNV, respectively), n = and 13 (day 8 and day 10 isotype mAb, ZIKV), n = 15 (day 8 and day 10 anti-Ifnar1 mAb, ZIKV) and n = 10 (day 10 sham and CHIKV) mice per group. Proportions were compared to sham-infected or isotype control-treated animals (Chi-squared test; ****, P < 0.001). See also Fig S1.
Flaviviruses infect the GI tract and alter intestinal transit.
To determine if the GI pathology was a result of direct intestinal infection, defined segments of the GI tract were analyzed after infection to quantify flavivirus RNA (Fig 2A-E and Fig S2A-G). After extensive tissue perfusion, we measured viral RNA levels because infectious virus is inactivated by bile acids in the tissue homogenates. As early as day 2 after WNV infection, viral RNA was detected in regions of the GI tract of a subset of animals and by day 4, all mice showed WNV infection in virtually all regions (Fig 2A-E). Viral RNA levels peaked at days 6 to 8 days post-infection (dpi), with the highest viral titers observed in the mid and distal small intestine before declining at 21 dpi. Viral RNA remained detectable through 56 dpi in all segments of the GI tract, but was more prevalent in the colon at this time. We also inoculated mice with Kunjin virus (KUNV), a naturally attenuated variant of WNV (Scherret et al., 2002), and found more variable infection of the GI tract at day 6, although viral RNA was present in the small intestine in most animals (Fig S2A).
Figure 2. Flavivirus infection and motility of the GI tract.

Sections of (A) stomach, (B) proximal, (C) mid, (D) distal small intestine and (E) proximal colon were collected after WNV infection. Viral RNA was quantified by qRT-PCR from tissue homogenates. Dotted lines: limit of detection of assay. (F-I) GI tract motility in WNV-infected (F), isotype- and anti-Ifnar1-mAb treated, ZIKV-infected (G), POWV-infected (H), and KUNV-infected (I) WT mice was measured by FITC-dextran fluorescence transit 2 h post-oral gavage on 6 or 10 dpi. Data are mean ± standard deviation (SD) of FITC-dextran distribution (see STAR Methods). Results are from three experiments with n = 11 to 20 animals per time point (A-E) and with n = 10 (day 6, sham), n = 15 (day 6, WNV), n = 10 (day 10, sham) and n = 14 (day 10, WNV) (F); n = 12 (day 6 isotype mAb + ZIKV), n = 14 (day 6 anti-Ifnar1 mAb + ZIKV), n = 8 (day 10 isotype mAb + ZIKV), n = 14 (day 10 anti-Ifnar1 mAb + ZIKV) and n = 15 (day 10 anti-Ifnar1 mAb only) (G); n = 7 (day 6, sham), n = 8 (day 6, POWV), n = 9 (day 10, sham) and n = 11 (day 10, POWV) (H); and n = 10 (day 6, sham), n = 20 (day 6, KUNV), n = 12 (day 10, sham) and n = 13 (day 10, KUNV) (I). Motility was compared using a Kruskal-Wallis one-way ANOVA with Dunn’s test (F-I) (ns, P > 0.05; *, P < 0.05; **, P < 0.01). See also Fig S2.
We next assessed infection of the GI tract with other neurotropic flaviviruses. Mice treated with anti-Ifnar1 blocking mAb and inoculated with ZIKV had viral RNA detected in all sections of the GI tract in the majority of animals (Fig S2B-F). WT mice inoculated with POWV, a tick-borne flavivirus, also sustained high levels of viral RNA in all GI tract tissues tested by 6 dpi (Fig S2G).
As some flavivirus infections are associated acutely with GI symptoms (Sejvar, 2014) and delayed gastric emptying (Wang et al., 2011), we hypothesized that the dilated bowel observed after WNV infection might occur because of defects in bowel motility. To test this hypothesis, we measured the luminal transit of 70 kilodalton (kDa) FITC-labeled dextran during the acute phase of WNV (Fig 2F), ZIKV (Fig 2G), POWV (Fig 2H), and KUNV (Fig 2I) infections. Since 70 kDa FITC-dextran is poorly absorbed by the intact intestine, luminal concentrations in each bowel region after oral gavage provide a measure of GI transit. FITC-dextran transit was slowed in many of the WNV-infected mice compared to sham-infected controls at 6 and 10 dpi (Fig 2F). Analogous results were obtained in WT mice treated with anti-Ifnar1 mAb and inoculated with ZIKV (Fig 2G) or in WT mice infected with POWV (Fig 2H), although the effect was delayed compared to WNV-infected animals. In comparison, mice administered anti-Ifnar1 mAb alone or isotype control mAb and ZIKV showed no evidence of delayed GI transit (Fig 2G). Even mice infected with the attenuated KUNV variant displayed delays in GI transit time that were comparable to those observed in WNV-infected animals at 6 dpi, although the effect waned in most mice by 10 dpi (Fig 2I).
To test whether systemic viral infections more generally cause changes in GI transit, we inoculated five-week old WT mice with a pathogenic strain of chikungunya virus (La Reunion, 2006), an unrelated arthritogenic alphavirus that rarely can spread to the central nervous system (CNS) (Das et al., 2010; Inglis et al., 2016). We then measured viral RNA levels and GI transit after FITC-dextran gavage at 6 dpi. CHIKV accumulated in the spleen (Fig S2H) on 8 and 10 dpi as expected (Hawman et al., 2013), but levels in GI tract tissues were much lower (Fig S2I-M). Moreover, CHIKV-infected mice did not develop intestinal dilation at 6 or 10 dpi (Fig 1A and 1D). Consistent with this observation, FITC-dextran transit was not altered at 6 dpi in CHIKV-infected as compared to sham-infected mice (Fig S2N). Thus, systemic RNA virus infections do not generally dysregulate GI tract motility.
WNV infection alters neuronal structure in the muscularis propria.
To determine the cellular targets of flavivirus infection in the intestine, we analyzed WNV tropism in the mid- and distal small intestines, the areas of highest penetrance of the phenotype. Intestinal sections of WNV- or sham-infected mice were stained for viral antigen and the marker Tuj1 (an antibody to neuron-specific beta-3 tubulin). We detected WNV antigen that was confined to the ganglia of the myenteric plexus of the distal small intestine (Fig 3A; white arrow) and throughout the remainder of the small intestine (Fig S3A-B; white arrows), as well as in isolated neurons of the submucosal plexus (Fig S3B; white arrowhead) on 6 dpi. WNV and Tuj1 double-positive myenteric ganglia were quantified in a blinded manner from tissues collected at 6 dpi (Fig 3B). Sections of myenteric ganglia contained detectable WNV antigen throughout the small intestine. We did not observe viral antigen in the GI tract epithelium. These data support the conclusion that WNV preferentially infects enteric neurons of the myenteric and submucosal plexus.
Figure 3. Microscopic analysis of WNV-infected distal small intestine.

Sections of paraffin embedded bowel (A-B) and muscularis propria whole mount preparations (C) from distal small intestine were analyzed by immunofluorescence microscopy for WNV antigen or stained with hematoxylin and eosin (H & E) (D). (A) Sham and WNV-infected sections from distal small intestine at 6 dpi were stained for neuronal cell bodies and nerve fibers (Tuj1; green), WNV antigen (red), and cell nuclei (Hoechst; blue). White boxes: areas shown at higher magnification in panels beneath each image. White arrows: representative WNV-infected ganglia. (B) Total and WNV antigen-positive myenteric ganglia were quantified in indicated tissue sections for a distance of 100 crypt units and expressed as percentage of ganglia infected with WNV. (C) Whole mount preparations of distal small intestine muscularis propria were stained for neurons and nerve fibers (Tuj1; green), enteric glial cells (GFAP; magenta) and WNV antigen (red). (D) H & E stained sections from naïve, day 6, day 10, or day 28 after WNV infection. Black boxes: areas shown at higher magnification in panels beneath. Dashed lines: muscularis propria; Solid lines: myenteric ganglia. Images are from three experiments with n = 8 (day 6, sham), n = 11 (day 6, WNV), n = 7 (day 10, sham), n = 14 (day 10, WNV), two experiments with n = 4 (day 28, sham) and n = 8 (day 28, WNV) (A and D) and three experiments with n = 6 (sham) and n = 5 (day 6, WNV) (C) mice per group. Scale bars: 100 μm (A, top row and C) 50 μm (A, bottom row and D, top row), and 20 μm (D, bottom row). Results in B are from three experiments (Mann-Whitney test: *, P < 0.05; **, P < 0.01; ***, P < 0.001). See also Fig S3.
As histological sections sample only a portion of a ganglion, we stained whole mount preparations of the distal small intestinal muscularis propria collected on 6 dpi for Tuj1, GFAP (glial fibrillary acidic protein), and WNV antigen (Fig 3C). While no WNV antigen staining was detected in sham-infected mice (Fig 3C, top row), we observed co-staining for WNV antigen and Tuj1+ enteric neurons with a range of viral antigen-positive cells among infected animals. Some ganglia showed dispersed clusters of infected neurons (Fig 3C, middle row, white arrows) whereas others had WNV infection in most neuronal bodies within the ganglia (Fig 3C, bottom row, white arrows) and in their axons (Fig 3C, bottom row, white arrow heads). However, WNV antigen staining did not co-localize with glial cell or macrophage markers (Fig 3C and data not shown).
Despite the severe phenotype in the muscularis propria, high levels of viral RNA, and altered GI transit, WNV infection at 6 and 10 dpi did not result in villus blunting, gross or microscopic hemorrhage, or increased cell death of the epithelium (Fig 3D and S3C) compared to naive mice. However, leukocyte infiltration of the muscularis propria and myenteric plexus ganglia was apparent in sections from WNV-infected but not sham-infected animals. Immune cell infiltration was most pronounced at 6 dpi (Fig 3D and S3C; dashed lines, muscularis propria; solid lines, myenteric ganglia) with reduced numbers of immune cells seen at 10 and 28 dpi (Fig 3D and S3C; dashed lines, muscularis propria; solid lines, myenteric ganglia). Neurons within the myenteric ganglia displayed nuclear hypertrophy (Fig S3D) at 28 dpi, suggesting a compensatory response to viral- or immune-mediated damage to the ENS (Adad et al., 2001; Ekblad et al., 1998).
Leukocyte infiltration of WNV-infected muscularis propria and myenteric ganglia.
We evaluated the composition of the immune cell infiltrate in the intestine associated with WNV infection in more detail. Immunohistochemical staining showed CD3+ T cell infiltration of the muscularis and myenteric ganglia of the proximal, mid, and distal small intestine (Fig 4A, S4A and S4C; white arrows). At 6 dpi, the numbers of muscularis-infiltrating (Fig 4C) and ganglia-associated (Fig 4F) CD3+ T cells were higher throughout the length of the GI tract compared to sections from sham-infected animals and was statistically significant in the mid and distal small intestine. By 10 and 28 dpi, the numbers of CD3+ T cells were diminished in the muscularis and myenteric plexus ganglia (Fig 4B and S4B and D) of all intestinal segments (Fig 4D-E and 4G-H), and this finding correlated with decreased levels of WNV RNA (Fig 2).
Figure 4. Immune cell infiltrate of the myenteric plexus in WNV-infected distal small intestine.

Sections of the distal small intestine from sham- and WNV-infected mice were stained for enteric glia (GFAP; green), infiltrating T cells (CD3; red), and cell nuclei (Hoechst; blue) at 6 and 10 dpi (A) and 28 dpi (B). The number of CD3+ T cells within the muscularis layer (C-E) or GFAP+ myenteric ganglia (F-H) was quantified along a length of indicated GI tissues of 100 crypts. I-N. Flow cytometry quantification of cells per gram of tissue (I-K) and proportions (L-N) of CD8+ T cells, WNV NS4B-specific CD8+ T cells, and Ly6Chi Ly6G− monocytes per gram of small intestinal tissue from sham, 6 dpi, and 28 dpi. (C-H) Data are from three experiments with n = 8 (day 6 sham), n = 11 (6 dpi), n = 7 (day 10 sham), n = 14 (10 dpi), n = 4 (day 28 sham) and n = 8 (28 dpi) mice per group. White arrows (A): CD3+ T cells; Scale bars: 100 μm and 50 μm (A-B; top and bottom rows, respectively). Flow cytometry data (I-N) is from three experiments with n = 6 (day 6 sham), n = 9 (6 dpi), n = 6 (day 28 sham) and n = 8 (28 dpi). Data in C-N were analyzed by Mann-Whitney test (ns, P > 0.05; *, P < 0.05; **, P < 0.01; ***, P < 0.001). See also Fig S4.
Flow cytometry of muscularis propria cells obtained from tissue during the acute (6 dpi) and chronic (28 dpi) phases of WNV infection (Fig S4E) did not show significant increases in the total number of CD45+ or CD8+ cells (Fig 4I and S4F). However, the proportion of CD8+ T cells was elevated in infected mice at 6 dpi (Fig 4L). Moreover, the number of WNV-specific, Db-NS4B peptide tetramer+ CD8+ T cells was elevated at 6 dpi (Fig 4J) and represented a significant proportion of CD8+ T cells in the muscularis layer at both time points (Fig 4M). Similar to the T cell data, numbers of CD11b+ F4/80+ CD64+ CX3CR1+ macrophages in the muscular layer were not different between sham and WNV-infected mice at either time point (data not shown), although the proportion of monocytes (CD11b+ Ly6Chi Ly6G−) was higher on 6 dpi (Fig 4N). We did not observe differences in proportions or numbers of CD4+ T cells or neutrophils (CD11b+ Ly6C+ Ly6G+) at either time point post-infection (data not shown). These data show that WNV infection of the GI tract induces an immune cell infiltration that includes an influx of antigen-specific CD8+ T cells.
WNV-infection induces cell death in enteric ganglion cells.
To determine if WNV infection of the myenteric plexus resulted in death of ENS ganglion cells, we performed TUNEL staining on sections of distal small intestine collected at 6 and 10 dpi (Fig 5A). We observed TUNEL-positive cells in the muscularis layer (Fig 5B) and enteric ganglia of the intestines of WNV-infected mice on both days (Fig 5A; white arrow and Fig 5C). Blinded quantification showed a significant fraction of myenteric ganglia was TUNEL-positive after WNV infection (Fig S5A). Additionally, whole mount preparations of the distal small intestine at 6 dpi showed colocalization of WNV antigen and cleaved caspase 3 in enteric ganglia (Fig 5D). In comparison, staining for cleaved caspase 3 in sham-infected animals was not observed. By 28 dpi, the density of Phox2b+ neurons in whole mount sections of the distal small intestine was reduced compared to sham-infected controls (Fig S5B-C). Thus, WNV infection of the GI tract results in structural modification of the ENS including death of myenteric neurons.
Figure 5. WNV infection induces cell death in the GI tract.

(A) Sections of distal small intestine from sham and WNV-infected mice (6 and 10 dpi) were stained with TUNEL (red), for neurons and nerve fibers (Tuj1; green) and cell nuclei (Hoechst; blue). White boxes: areas shown at higher magnification in panels beneath each image; White arrows: ganglia-associated apoptotic cells. Total number of TUNEL-positive (B) and ganglia-associated TUNEL-positive cells (C) were quantified in distal small intestine tissue sections for a distance of 100 crypts. (D) Whole mount preparations of muscularis propria were stained for enteric glial cells (GFAP; magenta), WNV antigen (red), and cleaved caspase 3 (Cas3; green). Images are representative of three experiments with n = 8 (day 6, sham), n = 11 (day 6, WNV), n = 7 (day 10, sham), n = 14 (day 10, WNV) (A-C) and n = 6 (sham) and n = 5 (day 6, WNV) (D) mice per group. Scale bars: 100 μm (A, top row and D) and 50 μm (A, bottom row). Results in B and C are from three experiments (Mann-Whitney test: *, P < 0.05; **, P < 0.01; ***, P < 0.001). See also Fig S5.
CD8+ T cells are required for acute WNV-induced GI dysmotility.
We hypothesized that infiltrating WNV-specific CD8+ T cells caused immune-mediated injury of enteric ganglia that led to bowel dilation and delayed GI transit. To test this hypothesis, we inoculated Rag1−/−, Tcrβtm−/−, and CD8a−/− mice, which respectively lack B and T cells, αβ and γδ T cells, or only CD8+ T cells. At day 6 after WNV infection, all three mouse strains had FITC-dextran transit patterns that were comparable to sham-infected controls (Fig 6A), even though viral RNA levels in their GI tract were equivalent to or higher than WT mice (Fig S5D-H). To confirm their contribution to WNV-induced acute GI dysmotility, we adoptively transferred CD8+ T cells (5 × 10⁶ cells per mouse) harvested from lymphoid tissues (Fig S5I) of sham (naïve) and WNV-infected (day +7) donor mice to WNV-infected recipient CD8a−/− mice (Fig 6B) and analyzed FITC-dextran transit. Animals injected with PBS or administered naïve T cells did not display delayed GI transit, whereas those given CD8+ T cells from WNV-infected donors exhibited delayed GI transit (Fig 6C).
Figure 6. CD8+ T cells are required for acute GI transit delays after WNV infection.

FITC-dextran fluorescence GI transit measurements in (A) Rag1−/−, Tcrβtm−/−, and CD8a−/− or in (B and C) recipient CD8a−/− mice that were adoptively transferred at 2 dpi CD8+ T cells from sham (naïve) or WNV-infected WT donors harvested at day 7. Data are mean ± SD. (D-E) Sections of distal small intestine were collected on 6 dpi from CD8a−/− mice and stained with H & E (D) or with TUNEL and Tuj1 antibody (E). Total number of TUNEL-positive (F) and ganglia-associated TUNEL-positive cells (G) were quantified for a distance of 100 crypts. Black boxes (D): areas shown at higher magnification in panels beneath each image. Dashed lines: muscularis propria; Solid lines: myenteric ganglia. Scale bars: 100 μm (E, top row), 50 μm (D, top row and E, bottom row), and 20 μm (D, bottom row). The results are from three experiments with n = 11 (Rag1−/− sham), n = 11 (Rag1−/− + WNV), n = 17 (Tcrβtm−/− sham), n = 11 (Tcrβtm−/− + WNV), n = 9 (CD8a−/− sham) and n = 11 (CD8a−/− + WNV) (A); n = 8 (CD8a−/− mock), n = 9 (CD8a−/− + sham naïve donor) and n = 12 (CD8a−/− + WNV donor) (C); and n = 5 (CD8a−/− sham) and n = 8 (CD8a−/− WNV) (D-G) mice per group. Motility in infected mice was compared to sham-infected mice using a Kruskal-Wallis one-way ANOVA test, and total numbers of muscularis and ganglia-associated TUNEL-positive cells were compared by Mann-Whitney test (ns, P > 0.05; *, P < 0.05). See also Fig S5.
Analysis of the distal small intestine from CD8a−/− mice at 6 dpi showed an absence of cellular infiltration of the myenteric ganglia (Fig 6D; dashed lines: muscularis propria; solid lines: myenteric ganglia) and few detectable muscularis and ganglia-associated TUNEL-positive cells (Fig 6E). Blinded quantitation of the muscularis and myenteric ganglia revealed no differences between sham and WNV-infected CD8a−/− mice at 6 dpi in the number of TUNEL-positive cells (Fig 6F) or proportion of TUNEL-positive myenteric ganglia (Fig 6G). These data support the hypothesis that CD8+ T cells contribute to the early phase of GI dysmotility in WNV-infected mice. We did not evaluate whether CD8+ T cells modulated the later phase of acute GI transit dysfunction in WNV- or ZIKV-infected mice because by that time greater than 95% of CD8a−/− mice succumb to uncontrolled infection in the brain and spinal cord (Elong Ngono et al., 2017; Shrestha and Diamond, 2004).
WNV infection causes persistently delayed GI transit that is exacerbated by unrelated immune stimuli.
We performed longitudinal studies of GI transit on cohorts of WNV- and sham-infected mice using passage of carmine red dye in feces at multiple times post-infection. A defect in GI transit secondary to KUNV and WNV infection was maintained as far out as 4 and 7 weeks post-infection, respectively (Fig 7A-B). Most WNV-infected mice showed delayed transit of dye during the acute stages of infection. Animals surviving WNV infection sustained persistent dysmotility in the convalescent phase (days 21 to 49). Mice that ultimately succumbed to WNV developed the most severe delays in GI transit during the acute phase of infection (transit time > 5 h post-gavage) (Fig 7A, blue symbols). We tested if this clinical phenotype could be mitigated by treating WNV-infected mice with hE16, a humanized anti-WNV mAb (Oliphant et al., 2005). Therapy was initiated at 4 dpi when high levels of WNV RNA already were present in all segments of the GI tract (see Fig 2A-E). Compared to isotype control mAb-treated mice, hE16-treated animals did not develop GI dysmotility by 10 dpi (Fig S6A) or succumb to infection through 21 dpi (Fig S6B).
Figure 7. Delayed GI transit in WNV-infected mice during the chronic phase.

GI tract transit was evaluated by oral gavage of carmine red dye prior to and during the acute and convalescent phases of WNV (A) and KUNV (B) infection. Blue data points represent individual mice that succumbed to WNV infection. Surviving mice were monitored for GI tract dysmotility on 28 and 56 dpi (C, scheme) and subsequently immunized subcutaneously with live-attenuated VEEV TC-83 vaccine at 32 dpi (D) or administered via an intraperitoneal route 100 μg of poly(I:C) at 60 dpi (E). Black lines: median time when carmine red appears in fecal pellets. Total numbers and proportions of CD8+ T cells (F and I), WNV-specific CD8+ T cells (NS4B tetramer+; G and J) and Ly6Chi Ly6G− monocytes (H and K) were assessed by flow cytometry from the distal small intestines of mice at 11 dpi with VEEV TC-83 or PBS treatment. Data are presented as total (F-H), percent of CD45+ cells (I and K) and percent of CD8+ T cells (J). Results are from three (panels A, B, E and F-K) or five (panel D) experiments with n = 15 (sham), n = 25 (WNV) (A); n = 13 (day 28 sham) and n = 14 (28 dpi, KUNV) (B); n = 15 (day 28 sham + VEEV TC-83), n = 15 (28 dpi, WNV + VEEV TC-83) (D); n = 15 (day 56 sham + poly(I:C)) and n = 16 (57 dpi, WNV + poly(I:C)) (E); and n = 5 (sham + PBS), n = 8 (WNV + PBS), n = 6 (sham + VEEV TC-83) and n = 9 (WNV + VEEV TC-83) (F-K) mice per group. (A-B, D-E) Dotted lines correspond to twice the baseline transit time; if no fecal pellets were produced, the experiment was stopped at 360 min. Infected mice were compared to sham-infected controls by a one-way ANOVA Kruskal-Wallis with Dunn’s test (ns, P > 0.05; *, P < 0.05; **, P < 0.01; ***, P < 0.001, ****, P < 0.0001). See also Fig S6.
A hallmark of some GI dysmotility disorders in humans is the intermittent nature of symptoms with diarrhea and/or constipation and abdominal pain occurring episodically (Cashman et al., 2016). Moreover, symptom exacerbation may be associated with intercurrent infection or inflammation (Liebregts et al., 2007; O'Malley et al., 2011). We tested if mice surviving WNV infection were sensitized to inflammation-induced bowel dysmotility using stimuli that do not slow transit in sham-infected mice (Fig 7C). We inoculated mice in the convalescent stage with either a live-attenuated viral vaccine (Venezuelan equine encephalitis [VEEV], TC-83 strain (Phillpotts and Wright, 1999), Fig 7D) at 4 weeks post-WNV infection or a non-infectious immune stimulus (poly(I:C), Fig 7E) at 8 weeks post-WNV infection. Bowel transit was assessed by gavage of carmine red dye on days 3 and 10 after VEEV TC-83 infection or poly(I:C) treatment. Remarkably, at both 4 and 8 weeks post-infection, surviving WNV-infected mice showed slower GI transit in response to VEEV TC-83 or poly(I:C). In comparison, sham-infected mice administered VEEV TC-83 or poly(I:C) did not show altered GI transit times. Analysis of intestinal tissues collected on day 3 after VEEV TC-83 infection showed VEEV RNA levels that were predominantly below the limit of detection (Fig S6C), suggesting that delayed transit did not result from infection of the GI tract by this attenuated virus. Thus, systemic infection by WNV induces chronically delayed GI transit that is exacerbated by unrelated inflammatory stimuli.
To determine if the secondary inflammatory stimulus resulted in immune cell infiltration of the muscularis propria, we performed flow cytometry analysis of T cell and myeloid cell populations (Fig 7F-K) on mid and distal small intestine tissue 11 dpi with VEEV TC-83. Despite confirming that GI transit was still delayed 10 days after VEEV TC-83 infection in mice previously infected with WNV (Fig S6D), we did not observe an increase in number of CD45+ leukocytes, CD8+ T cells, WNV-specific CD8+ T cells, or Ly6C+ monocytes compared to age-matched, sham-infected controls (Fig S6E and Fig 7F-K). This suggests that the exacerbated slowing of GI transit induced by VEEV TC-83 in the chronic phase after WNV infection is not caused by new immune cell infiltration.
DISCUSSION
GI motility disorders in humans often occur following episodes of acute protozoan, bacterial, and viral gastroenteritis, termed post-infectious IBS (Klem et al., 2017). Prior studies have demonstrated that viruses can infect the cells of the ENS and induce immune cell infiltration into the myenteric plexus (Brun et al., 2010; Facco et al., 2008; Khoury-Hanold et al., 2016). Although viral infection is a postulated cause of human dysmotility disorders, causality has not been proven. Our findings are consistent with recent studies in mice (Brun et al., 2018; Khoury-Hanold et al., 2016) demonstrating that infection of the ENS by HSV can induce acute GI dysmotility, although Khoury-Hanold et al. described toxic megacolon and Brun et al. showed intestinal dysmotility was due to infiltrating macrophages. In comparison, WNV RNA persisted in the bowel of surviving animals, and this was associated with chronic delays in GI transit times. WNV infection of neurons of the ENS induced CD3+ T cell infiltration of the myenteric plexus, which occurred throughout the length of the small intestine, but was more prominent in the mid and distal segments, and correlated with increased cell death within the muscularis propria and ganglia of the myenteric plexus.
The dysregulated GI transit that we observed following multiple flavivirus infections in mice shares features of acquired intestinal dysmotility syndromes in humans including post-infectious IBS (Klem et al., 2017). Animals developed a chronic motility disorder that lasted for weeks to months after acute infection with WNV or even the attenuated variant, KUNV. Remarkably, WNV-infected animals became vulnerable to exacerbated delays in GI transit time in response to unrelated secondary systemic inflammatory stimuli including administration of a live-attenuated vaccine or non-infectious poly(I:C). Thus, infections by WNV and possibly other neurotropic viruses targeting the ENS can induce an acute, chronic, and potentially relapsing motility disorder, which might serve as a model for study and evaluation of therapies for acquired human GI disorders including IBS. Indeed, treatment of WNV-infected mice at 4 dpi with a single dose of hE16 mAb prevented the acute dysmotility syndrome. As several neurotropic flaviviruses can infect non-human primates productively, confirmatory studies are planned to test whether similar GI transit disorders occur in animals more closely related to humans.
Our experiments in immune deficient mice suggest that CD8+ T cells contribute to the acute phase of GI tract dysmotility. At 6 dpi, when transit defects were seen in WT WNV-infected mice, intestinal transit was normal in WNV-infected Rag1−/−, Tcrβtm−/−, and CD8a−/− mice, all of which lack CD8+ T cells. Consistent with this data, adoptive transfer of WNV-primed, but not naïve, CD8+ T cells into recipient CD8a−/− mice resulted in delayed GI transit in the context of WNV infection. WNV-infected CD8a−/− mice did not show increased TUNEL-positive staining within the muscularis propria and myenteric ganglia of the distal small intestine, indicating that CD8+ T cell-mediated cell death of ENS neurons correlates with development of acute GI tract dysmotility. The specific CD8+ T cell effector functions (e.g., perforin and granzyme secretion, Fas ligand expression, or cytokine production) required to mediate ENS damage remain to be elucidated. We were unable to evaluate the impact of CD8+ T cells on the chronic phase of GI tract transit dysfunction because mice lacking CD8+ T cells succumb too rapidly to WNV and ZIKV (Elong Ngono et al., 2017; Shrestha and Diamond, 2004).
High levels of WNV RNA were measured within all GI tract regions tested during the acute phase, and this was associated with bowel dilation, injury to ENS neurons, and infiltration of antigen-specific CD8+ T cells. Gradual clearance of WNV RNA from the intestines in surviving animals correlated with improved GI transit times and diminished immune cell infiltration. Notwithstanding this improvement, surviving mice still exhibited delayed GI tract transit 49 days after infection and did not return to baseline relative to sham-infected animals. As some of these animals had persistent WNV RNA throughout their intestines even at these late time points, the long-term presence of viral pathogen-associated molecular patterns (PAMPs), antigen, or immunogenic peptides could sustain inflammation and chronic GI dysmotility. Although we did not observe persistent T cell infiltration of the muscularis or myenteric plexus in surviving animals at 28 dpi by microscopy, we did detect WNV-specific CD8+ T cells within the small intestine by flow cytometry. However, upon administration of secondary, systemic inflammatory stimulus that exacerbated GI transit delays, the number and proportion of WNV-specific CD8+ T cells remained comparable to control animals, suggesting that the secondary bouts of GI dysmotility may not be caused by further CD8+ T cell infiltration of the myenteric plexus. The possible role of WNV persistence in maintenance of chronic GI dysfunction remains unclear. Viral- and T cell-mediated structural changes to the ENS also could lead to a distinct response by myenteric neurons to inflammatory or neuroendocrine signals that exacerbate GI dysfunction even after viral infection is cleared.
Flavivirus infection in the GI tract of mice provides a possible model for defining mechanisms that cause persistent and relapsing GI motility disorders in humans. Whereas microbial agents that cause acute viral gastroenteritis (e.g., noroviruses and rotaviruses) infect cells in the mucosa of the GI tract, systemic infection with neurotropic viruses that target the neurons of the ENS may be a source of acute and persistent GI pathology and dysmotility. We wish to highlight that neurotropic flaviviruses are unlikely to be the major cause of common GI dysmotility syndromes in humans like irritable bowel syndrome because of their low incidence. Rather, our data suggests that systemic infection by viruses (e.g. enteroviruses, herpesviruses, astroviruses, and flaviviruses) targeting neurons of the ENS may be an underappreciated cause of acquired bowel motility disorders or could cause some cases of more serious, but less common GI motility disorders. A limitation of the current study is the exclusive reliance of experiments in mice. Ultimately, establishing the roles of neurotropic viral infections in the development of human GI transit disorders will require a rigorous, multi-institutional, and likely large serological study with well characterized affected cohorts and matched controls.
STAR METHODS
CONTACT FOR REAGENT AND RESOURCE SHARING
Further information and requests for resources and reagents should be directed to and will be fulfilled by the Lead Contact author Michael S. Diamond (diamond@wusm.wustl.edu).
EXPERIMENTAL MODEL AND SUBJECT DETAILS
Viruses.
WNV New York 1999 (clone 382-99 (Beasley et al., 2005)), KUNV (cDNA of FLSDX clone (Liu et al., 2003)) and VEEV vaccine strain (cDNA of TC-83 clone (Petrakova et al., 2005)) were produced by electroporation of in vitro transcribed RNA into BHK21-15 cells (Anishchenko et al., 2004; Liljestrom et al., 1991). Mouse-adapted ZIKV (Dakar clone 41525) was produced as described (Govero et al., 2016; Platt et al., 2018), and CHIKV (strain La Reunion OPY1 p142) and POWV (Spooner strain (Ebel et al., 1999)) were propagated on Vero cells (Fox et al., 2015; Platt et al., 2018). To generate viral stocks (passage 1) for infections, Vero cells were inoculated at a multiplicity of infection (MOI) of 0.01, and culture supernatants were collected at 48 h, clarified by centrifugation (1,500 × g, 5 min) and aliquotted for storage at −80° C. Viral stocks were titrated by focus forming assays on Vero cells (Lazear et al., 2013).
Ethics statement.
This study was carried out in strict accordance with the recommendations in the Guide for Care and Use of Laboratory Animals of the National Institutes of Health. The protocols were approved by the Institutional Animal Care and Use Committee at Washington University School of Medicine (Assurance number: A3381-01). All dissections and inoculations were carried out under anesthesia induced and maintained by ketamine hydrochloride and xylazine, and all efforts were made to minimize suffering.
Mouse infection studies.
Wild type C57BL/6J and congenic Rag1−/−, Tcrβtm−/−, and CD8a−/− mice were obtained commercially (Jackson Laboratories: 000664, 002216, 002122, and 002665, respectively) and bred under pathogen-free conditions at Washington University. Nine to ten-week mice were inoculated with 102 focus-forming units (FFU) of WNV or POWV or 103 FFU of ZIKV in 50 μl of PBS by subcutaneous injection in the footpad. Four and a half to five week mice were inoculated with 104 FFU of KUNV in 100 μl PBS by intraperitoneal injection. For ZIKV infections, mice were treated one day before with 1 mg of isotype control or anti-Ifnar1 mAbs (MAR1-5A3 (Sheehan et al., 2006)) by intraperitoneal injection. In some experiments, mice were treated with a single 500 μg dose of isotype control (human IgG1, Bio X Cell) mAb or hE16 anti-WNV mAb (Oliphant et al., 2005) by intraperitoneal injection at 4 dpi. In other experiments, naïve or surviving WNV-infected mice were inoculated with 106 FFU of attenuated VEEV TC-83 vaccine strain by subcutaneous injection in 50 μl PBS in the footpad. Other mice were injected at five weeks of age with 105 FFU of CHIKV in 50 μl PBS subcutaneously in the footpad. For adoptive T cell transfer experiments, spleens and mesenteric lymph nodes were collected from donor naïve mice or at 7 dpi from WNV-infected WT mice. CD8+ T cells were enriched using the CD8+ T cell isolation kit (Miltenyi Biotec) according to the manufacturer’s instructions. At least 5 × 10⁶ cells were injected intravenously by retro orbital injection into recipient WNV-infected CD8a−/− mice at 2 dpi, and GI motility was assessed four days later as described below. At indicated times post-infection, mice were anesthetized, perfused extensively with 15 ml of PBS, and specified organs were collected, weighed and stored at −80°C.
METHOD DETAILS
Viral RNA extraction and titration.
Frozen sections of GI tract tissue were homogenized in 1 ml of DMEM supplemented with 2% FBS containing ceramic beads using a MagNA Lyser tissue homogenizer (Roche). RNA was extracted from 100 μl of homogenate using RNeasy 96 well RNA isolation kits (Qiagen) according to the manufacturer’s instructions. Absolute levels of WNV, ZIKV KUNV, and POWV genomic RNA were quantified using E protein sequence-specific TaqMan primers and probes and compared to a standard curve of purified viral genomic RNA (Daffis et al., 2011; Govero et al., 2016; Miner et al., 2016; Platt et al., 2018). All viral RNA titrations were performed using one-step qRT-PCR on a 7500 Fast Real Time-PCR system (Applied Biosystems). Genome copies were normalized by tissue weight and expressed as log10 genome copies of RNA or FFU equivalents per gram of tissue.
Immunohistochemistry and whole mount staining.
Sections of GI tract tissue were removed at indicated times after infection, opened along the mesenteric border, pinned to Sylgard® silicon plates, and fixed in 10% neutral buffered formalin overnight at 4°C. Following three washes with 70% ethanol, the tissues were blocked in 2% agar and stored in 70% ethanol at 4°C until paraffin embeddi ng, sectioning, and staining with H & E (Histology Core Facility, Washington University School of Medicine). For analysis of WNV antigen and immune cell infiltration, tissue sections were deparaffinized by three sequential incubations in xylene followed by three sequential washes in isopropanol. Antigen retrieval was performed by boiling sections in Dako Target Retrieval Solution (Dako) or Trilogy antigen retrieval solution (Cell Marque) for 20 min followed by a 10-min incubation at room temperature. Slides were blocked for 30 min at room temperature in Tris-HCl (25 mM, pH 7.4) or PBS buffered solutions containing 1% bovine serum albumin (BSA), 5% normal donkey serum, and 0.05% Tween 20. Sections were incubated overnight at 4°C with rat anti-WNV hyperimmune serum (1:400, (Diamond et al., 2003)), rabbit anti-CD3 polyclonal serum (1:100, Abcam), rabbit anti-Tuj1 polyclonal serum (1:500, Sigma Aldrich), and goat anti-GFAP polyclonal serum (1:100, Abcam) diluted in blocking buffer. Primary antibodies were detected with Cy3-conjugated donkey anti-rat or anti-rabbit antibodies and FITC-conjugated donkey anti-goat antibody (1:500, Jackson Laboratories) diluted in blocking buffer for 60 min at room temperature. Following counter-staining with Hoechst 33342 dye (Thermo Fisher), tissue sections were mounted in ProLong Gold anti-fade (Thermo Fisher) and stored at 4°C until imaging. For cell death quantification, antigen retrieval and permeabilization was performed as described above prior to TUNEL staining using In Situ Cell Death Detection kit (Roche) according to the manufacturer’s instructions followed by Tuj1 staining as described above. H & E and fluorescence-stained slides were imaged on a Zeiss Observer.D1 and Imager M2 microscope, respectively, and analyzed using Zeiss Zen software suite.
For whole mount staining, pinned tissues were fixed in Zamboni’s fixative (American Master Tech) at 4°C overnight. Following three washes in 70% ethanol and three washes in PBS, the muscularis propria was dissected from the mucosa under a dissecting microscope and stored at 4°C in PBS + 0. 02% NaN3. Tissue sections were incubated with 0.001% trypsin (Sigma Aldrich) at room temperature for 2 min, blocked for 2 h at room temperature (Blocking buffer: 25 mM Tris, pH 7.4 + 5% donkey serum + 1% BSA + 1% Triton X-100 + 0.02% NaN3) and incubated overnight with primary antibodies (Tuj1, GFAP, anti-WNV polyclonal serum listed above, cleaved caspase 3 (1:400; Cell Signaling) and Phox2b (1:30; R&D Biosystems)) at 4°C. Following three washes in PBS + 1% Triton X-100, the tissues were incubated overnight with secondary antibodies (listed above) at 4°C, washed three times in PBS + 1% Triton X-100 and mounted in ProLong Gold anti-fade reagent with DAPI (Invitrogen) before imaging with a Zeiss LSM880 Laser Scanning Confocal microscope. 8-10 μM thick Z-stacks were processed using Zen2 Blue Edition (Zeiss) to produce maximum intensity projections and adjust the brightness and contrast of images.
Flow cytometry analysis.
The distal small intestine from mid-jejunum to the ileocecal junction was removed at day 6 (acute) or days 28-35 (chronic) after WNV infection and placed in ice cold PBS. Mesenteric fat was dissected away, and the tissue was cut into approximately two-inch pieces, flushed with PBS, and opened along the mesenteric border. Tissue sections were pinned to Sylgard® plates, and the mucosa and lamina propria were removed mechanically from the muscularis, which was placed in ice cold DMEM + 2% FBS until weighing and processing. Single cell suspensions were produced by mincing the tissues and transferring to 10 ml of digestion media (RPMI supplemented with 8% FBS, 10 mM HEPES, 100 μg/ml kanamycin, glutamine, sodium pyruvate and NEAA) supplemented with 100 U/ml collagenase IV (Sigma Aldrich) and 10 μg/ml DNase I and incubated at 37°C for 1 h with agitation. Digested tissues were filtered through a 100 μm filter, washed with 10 ml of digestion buffer, and the resulting cells were pelleted, washed with 10 ml HBSS supplemented with 15 mM HEPES, and resuspended in 7 ml of 30% Percoll (GE Healthcare), and pelleted by centrifugation at 1,200 × g for 30 min. Cells were split into two equal volumes and stained with panels for T cell and myeloid cell population analysis (see Key Resources Table) using a FoxP3 intracellular staining kit (ThermoScientific). Stained cells were analyzed on a Fortessa X-20 (BD Biosciences), and the data was analyzed using FlowJo (FlowJo) software suite.
KEY RESOURCE TABLE
| REAGENT or RESOURCE | SOURCE | IDENTIFIER |
|---|---|---|
| Antibodies | ||
| Tuj1 (β-tubulin III) | Sigma | Cat # T2200 |
| Glial fibrillary acidic protein (GFAP) | Abcam | Cat #Ab53554 |
| Phox2b | R&D Biosystems | Cat #AF4940 |
| Control rat serum | Diamond Lab | Diamond et al, 2003 |
| Rat anti-WNV polyclonal serum | Diamond Lab | Diamond et al, 2003 |
| CD3 | Abcam | Cat # Ab5690 |
| Cleaved caspase 3 | Cell Signaling | Cat # 9661 |
| Anti-mouse Ifnar1 monclonal | Leinco Technologies | Cat # MAR1-5A3 |
| Human IgG1 isotype | BioXCell | Cat # BE0297 |
| Humanized E16 | Macrogenics | Oliphant et al, 2005 |
| Donkey anti-rabbit Alexa Fluor 488 | Invitrogen | Cat # A21206 |
| Donkey anti-rat Cy3 | Jackson Laboratories | Cat # 712-165-153 |
| Donkey anti-goat Alexa Fluor 647 | Invitrogen | Cat # A21447 |
| Alexa Fluor 700 anti-CD45 | BioLegend | Cat # 103128 |
| PE/Cy7 anti-CD3e | BioLegend | Cat # 100319 |
| PerCP/Cy5.5 anti-CD8a | BioLegend | Cat # 100733 |
| Brilliant Violet 605 anti-CD4 | BioLegend | Cat # 100451 |
| Db-NS4B tetramer | NIH tetramer core | |
| Brilliant Violet 605 anti-CD11b | BioLegend | Cat # 101237 |
| APC/Cy7 anti-CD11c | BioLegend | Cat # 117323 |
| PE/Cy7 anti-Ly6G | BioLegend | Cat # 127617 |
| PE anti-Ly6C | BioLegend | Cat # 128007 |
| Pacific Blue anti-MHC class II (I-A/E) | BioLegend | Cat # 107620 |
| Alexa Fluor 647 anti-F4/80 | BioLegend | Cat # 123122 |
| Brilliant Violet 650 anti-CX3CR1 | BioLegend | Cat # 149033 |
| PE/Dazzle594 anti-CD64 | BioLegend | Cat # 139319 |
| Anti-mouse CD16/32 | BioLegend | Cat # 101310 |
| Bacterial and Virus Strains | ||
| West Nile virus NY99 clone 382-99 | Beasley et al, 2005 | N/A |
| VEEV TC-83 | Petrakova et al, 2005 | N/A |
| Zika virus Dakar clone 41525-mouse adapted | Gorman et al, 2018 | N/A |
| Chikungunya virus La Reunion clone OPY1 p142 | Fox et al, 2015 | N/A |
| POWV, lineage 2, Spooner strain | Ebel et al, 1999 | N/A |
| Kunjin FLSDX | Liu et al, 2003 | N/A |
| Biological Samples | ||
| Chemicals, Peptides, and Recombinant Proteins | ||
| Carmine powder | Sigma | Cat # C1022-25G |
| Fluorescein isothiocyanate- dextran, 70,000 KDa | Sigma | Cat # 46945 |
| agar | Sigma | Cat # A7921 |
| Collagenase IV from Clostridium histolyticum | Sigma | Cat # C5138-1G |
| DNaseI | Sigma | Cat # D5025 |
| Dako Target Retrieval solution | Agilent | Cat # S2369 |
| Trilogy Target Retrieval solution | Cell Marque | Cat # 920P-09 |
| ProLong Gold antifade mounting media | Invitrogen | Cat # P36930 |
| Percoll Plus | GE Healthcare | Cat # 17-5445-02 |
| Poly I:C | InvivoGen | tlrl-pic |
| Critical Commercial Assays | ||
| In Situ Cell Death Detection Kit-TMR red | Roche | Cat # 12156792910 |
| FoxP3/Transcription factor staining kit | Invitrogen | Cat # 00-5523-00 |
| RNeasy 96 kit | Qiagen | Cat # 74182 |
| TaqMan RNA-to-CT 1 step kit | Applied Biosystems | Cat # 4392938 |
| CD8a+ T cell isolation Kit | Miltenyi | Cat # 130-104-075 |
| Deposited Data | ||
| Experimental Models: Cell Lines | ||
| African green monkey kidney (Vero) cells | WHO reference cell bank | WHO Vero cells |
| Baby hamster kidney (BHK)-21 cells | ATCC | Cat # CCL-10 |
| Experimental Models: Organisms/Strains | ||
| Mouse: C57BL/6J | Jackson Laboratory | Cat # 000664 |
| Mouse: B6.129S7-Rag1tm1Mom/J | Jackson Laboratory | Cat # 002216 |
| Mouse: B6.129P2-Tcrbtm1MomTcrdtm1Mom/J | Jackson Laboratory | Cat # 002122 |
| Mouse: B6.129S2-Cd8atm1Mak/J | Jackson Laboratory | Cat # 002665 |
| Oligonucleotides | ||
| WNV NY99 titering primers | Lazear et al, 2013 | See table S2 |
| ZIKV-Dakar titering primers | Gorman et al, 2018 | See table S2 |
| CHIK La Reunion titering primers | Fox et al, 2015 | See table S2 |
| VEEV TC-83 titering primers | This paper | See table S2 |
| Recombinant DNA | ||
| Software and Algorithms | ||
| Prism | GraphPad | Version 6.0h |
| FlowJo | FlowJo | Version 10.4.2 |
| Other | ||
GI motility measurements.
In vivo bowel motility was assessed by two methods as described (Avetisyan et al., 2015). Whole bowel transit time was determined by administration of 300 μl of 6% (w/v) carmine red dye (Sigma-Aldrich) dissolved in distilled water containing 0.5% methyl cellulose (Sigma-Aldrich) by oral gavage. Gavaged mice were placed in individual containers with white bottoms and checked at 10-min intervals through 6 h for the passage of carmine-containing, red fecal pellets. In separate studies, proximal intestinal motility was measured by oral gavage administration of 100 μl of non-absorbable, high molecular weight fluorescein isothiocyanate-dextran (FITC-dextran, average molecular weight 70,000; Sigma-Aldrich) dissolved in distilled water containing 2% methylcellulose. Gavaged mice were sacrificed after 120 min and segments of the GI tract were collected without removal of luminal contents; the small intestine was divided into eight sections, and the cecum and the colon into two sections each. GI tract tissues were frozen at −80°C. For analysis of FITC-dextran distribution within the GI tract, thawed sections were placed in 1 ml of PBS, minced with surgical scissors, and vortexed extensively to release luminal contents. Following clarification by centrifugation (10,000 × g for 5 min), 100 μl of FITC-dextran-containing supernatant was transferred to a 96-well plate and heat-treated for 30 min at 56°C to inactivate residual WNV. Samples were diluted 1:100 and 1:1000 in PBS, and 100 μl of each dilution was used for fluorescence quantification on a SynergyH1 plate reader (BioTek). Bowel transit of luminal contents was determined by calculating the geometric center (geometric center = ((Σ fluorescence × segment number)/total fluorescence) of FITC-dextran in the GI tract. To test mice for susceptibility to recurrent GI dysfunction, mice were treated with 100 μg of high molecular weight poly(I:C) (InvivoGen) administered by intraperitoneal injection once daily for three days or inoculated with VEEV TC-83 (as described above) three days prior to assessment of GI motility on indicated days post initial WNV infection.
QUANTIFICATION AND STATISTICAL ANALYSIS
Data analysis.
The proportion of animals displaying GI disease was analyzed by Chi squared test. Differences in WNV antigen-positive ganglia, TUNEL-positive cells, myenteric neuron nuclear volume and density, infiltrating CD3+ T cells, CD8+ T cells, NS4B tetramer+ T cells, and monocytes were analyzed by Mann-Whitney test. GI motility differences in FITC-dextran motility and carmine red dye transit assays were analyzed by one-way ANOVA with Kruskal-Wallis multiple comparison correction. Differences in WNV titers in GI tissues in different mouse strains were analyzed by an ordinary one-way ANOVA. All statistical analysis was conducted using GraphPad6 software. For quantification of WNV-positive myenteric ganglia, apoptotic cells, CD3+ cellular infiltration, myenteric neuron cell size and neuron density, slides were blinded for both imaging and counting.
DATA AND SOFTWARE AVAILABILITY
All data is available upon request to the lead contact author. No proprietary software was used in the data analysis.
Supplementary Material
Figure S1. Flavivirus-induced GI pathology localizes preferentially to the distal small intestine. Related to Figure 1.
Figure S2. ZIKV and CHIKV infection of the GI tract. Related to Figure 2.
Figure S3. WNV-antigen staining and histological analysis of proximal and mid small intestinal tissues. Related to Figure 3.
Figure S4. T cell infiltration of the myenteric plexus in WNV-infected GI tract. Related to Figure 4.
Figure S6. VEEV TC-83 infection and effects on GI transit. Related to Figure 7.
HIGHLIGHTS.
Infection with multiple flaviviruses causes delayed gastrointestinal transit
Dysmotility and neuronal death are caused by infiltrating antiviral CD8+ T cells
Surviving animals exhibit long term chronic dysmotility
Chronic dysmotility is exacerbated by exposure to unrelated inflammatory stimuli
ACKNOWLEDGEMENTS
This work was supported by National Institutes of Health (NIH) grant R01 (U19AI106772 and AI07375 for M.S.D.), Ruth L. Kirschstein National Research Service Award (NRSA) F32AI112274 (J.P.W.), Irma and Norman Braman Endowment (R.O.H), the Suzi and Scott Lustgarten Center Endowment (R.O.H), and the Children’s Hospital of Philadelphia Research Institute (R.O.H). The authors thank A. Iwasaki, J. Bando and W. Beatty for discussions and assistance and S. Nair for blinded quantification of microscopy results.
Footnotes
Publisher's Disclaimer: This is a PDF file of an unedited manuscript that has been accepted for publication. As a service to our customers we are providing this early version of the manuscript. The manuscript will undergo copyediting, typesetting, and review of the resulting proof before it is published in its final citable form. Please note that during the production process errors may be discovered which could affect the content, and all legal disclaimers that apply to the journal pertain.
DECLARATION OF INTEREST
M.S.D. is a consultant for Inbios and on the Scientific Advisory Board of Moderna.
REFERENCES
- Adad SJ, Cancado CG, Etchebehere RM, Teixeira VP, Gomes UA, Chapadeiro E, and Lopes ER (2001). Neuron count reevaluation in the myenteric plexus of chagasic megacolon after morphometric neuron analysis. Virchows Arch 438, 254–258. [DOI] [PubMed] [Google Scholar]
- Anishchenko M, Paessler S, Greene IP, Aguilar PV, Carrara AS, and Weaver SC (2004). Generation and characterization of closely related epizootic and enzootic infectious cDNA clones for studying interferon sensitivity and emergence mechanisms of Venezuelan equine encephalitis virus. J Virol 78, 1–8. [DOI] [PMC free article] [PubMed] [Google Scholar]
- Araujo EJ, Zaniolo LM, Vicentino SL, Gois MB, Zanoni JN, da Silva AV, and Sant'Ana Dde M (2015). Toxoplasma gondii causes death and plastic alteration in the jejunal myenteric plexus. World J Gastroenterol 21, 4829–4839. [DOI] [PMC free article] [PubMed] [Google Scholar]
- Armah HB, Wang G, Omalu BI, Tesh RB, Gyure KA, Chute DJ, Smith RD, Dulai P, Vinters HV, Kleinschmidt-DeMasters BK, et al. (2007). Systemic distribution of West Nile virus infection: postmortem immunohistochemical study of six cases. Brain Pathol 17, 354–362. [DOI] [PMC free article] [PubMed] [Google Scholar]
- Avetisyan M, Wang H, Schill EM, Bery S, Grider JR, Hassell JA, Stappenbeck T, and Heuckeroth RO (2015). Hepatocyte Growth Factor and MET Support Mouse Enteric Nervous System Development, the Peristaltic Response, and Intestinal Epithelial Proliferation in Response to Injury. J Neurosci 35, 11543–11558. [DOI] [PMC free article] [PubMed] [Google Scholar]
- Beasley DW, Whiteman MC, Zhang S, Huang CY, Schneider BS, Smith DR, Gromowski GD, Higgs S, Kinney RM, and Barrett AD (2005). Envelope protein glycosylation status influences mouse neuroinvasion phenotype of genetic lineage 1 West Nile virus strains. J Virol 79, 8339–8347. [DOI] [PMC free article] [PubMed] [Google Scholar]
- Brown AN, Kent KA, Bennett CJ, and Bernard KA (2007). Tissue tropism and neuroinvasion of West Nile virus do not differ for two mouse strains with different survival rates. Virology 368, 422–430. [DOI] [PMC free article] [PubMed] [Google Scholar]
- Brun P, Giron MC, Zoppellaro C, Bin A, Porzionato A, De Caro R, Barbara G, Stanghellini V, Corinaldesi R, Zaninotto G, et al. (2010). Herpes simplex virus type 1 infection of the rat enteric nervous system evokes small-bowel neuromuscular abnormalities. Gastroenterology 138, 1790–1801. [DOI] [PubMed] [Google Scholar]
- Brun P, Qesari M, Marconi PC, Kotsafti A, Porzionato A, Macchi V, Schwendener RA, Scarpa M, Giron MC, Palu G, et al. (2018). Herpes Simplex Virus Type 1 Infects Enteric Neurons and Triggers Gut Dysfunction via Macrophage Recruitment. Front Cell Infect Microbiol 8, 74. [DOI] [PMC free article] [PubMed] [Google Scholar]
- Canavan C, West J, and Card T (2014). The epidemiology of irritable bowel syndrome. Clin Epidemiol 6, 71–80. [DOI] [PMC free article] [PubMed] [Google Scholar]
- Cashman MD, Martin DK, Dhillon S, and Puli SR (2016). Irritable Bowel Syndrome: A Clinical Review. Curr Rheumatol Rev 12, 13–26. [DOI] [PubMed] [Google Scholar]
- Chen JJ, Gershon AA, Li Z, Cowles RA, and Gershon MD (2011). Varicella zoster virus (VZV) infects and establishes latency in enteric neurons. J Neurovirol 17, 578–589. [DOI] [PMC free article] [PubMed] [Google Scholar]
- Chowers MY, Lang R, Nassar F, Ben-David D, Giladi M, Rubinshtein E, Itzhaki A, Mishal J, Siegman-Igra Y, Kitzes R, et al. (2001). Clinical characteristics of the West Nile fever outbreak, Israel, 2000. Emerg Infect Dis 7, 675–678. [DOI] [PMC free article] [PubMed] [Google Scholar]
- Daffis S, Lazear HM, Liu WJ, Audsley M, Engle M, Khromykh AA, and Diamond MS (2011). The naturally attenuated Kunjin strain of West Nile virus shows enhanced sensitivity to the host type I interferon response. J Virol 85, 5664–5668. [DOI] [PMC free article] [PubMed] [Google Scholar]
- Das T, Jaffar-Bandjee MC, Hoarau JJ, Krejbich Trotot P, Denizot M, Lee-Pat-Yuen G, Sahoo R, Guiraud P, Ramful D, Robin S, et al. (2010). Chikungunya fever: CNS infection and pathologies of a re-emerging arbovirus. Prog Neurobiol 91, 121–129. [DOI] [PubMed] [Google Scholar]
- Debinski HS, Kamm MA, Talbot IC, Khan G, Kangro HO, and Jeffries DJ (1997). DNA viruses in the pathogenesis of sporadic chronic idiopathic intestinal pseudo-obstruction. Gut 41, 100–106. [DOI] [PMC free article] [PubMed] [Google Scholar]
- Diamond MS, Shrestha B, Marri A, Mahan D, and Engle M (2003). B cells and antibody play critical roles in the immediate defense of disseminated infection by West Nile encephalitis virus. J Virol 77, 2578–2586. [DOI] [PMC free article] [PubMed] [Google Scholar]
- Ebel GD, Foppa I, Spielman A, and Telford SR 2nd (1999). A focus of deer tick virus transmission in the northcentral United States. Emerg Infect Dis 5, 570–574. [DOI] [PMC free article] [PubMed] [Google Scholar]
- Ekblad E, Sjuve R, Arner A, and Sundler F (1998). Enteric neuronal plasticity and a reduced number of interstitial cells of Cajal in hypertrophic rat ileum. Gut 42, 836–844. [DOI] [PMC free article] [PubMed] [Google Scholar]
- Elong Ngono A, Vizcarra EA, Tang WW, Sheets N, Joo Y, Kim K, Gorman MJ, Diamond MS, and Shresta S (2017). Mapping and Role of the CD8+ T Cell Response During Primary Zika Virus Infection in Mice. Cell Host Microbe 21, 35–46. [DOI] [PMC free article] [PubMed] [Google Scholar]
- Facco M, Brun P, Baesso I, Costantini M, Rizzetto C, Berto A, Baldan N, Palu G, Semenzato G, Castagliuolo I, et al. (2008). T cells in the myenteric plexus of achalasia patients show a skewed TCR repertoire and react to HSV-1 antigens. Am J Gastroenterol 103, 1598–1609. [DOI] [PubMed] [Google Scholar]
- Fox JM, Long F, Edeling MA, Lin H, van Duijl-Richter MK, Fong RH, Kahle KM, Smit JM, Jin J, Simmons G, et al. (2015). Broadly Neutralizing Alphavirus Antibodies Bind an Epitope on E2 and Inhibit Entry and Egress. Cell 163, 1095–1107. [DOI] [PMC free article] [PubMed] [Google Scholar]
- Furness JB (2012). The enteric nervous system and neurogastroenterology. Nat Rev Gastroenterol Hepatol 9, 286–294. [DOI] [PubMed] [Google Scholar]
- Govero J, Esakky P, Scheaffer SM, Fernandez E, Drury A, Platt DJ, Gorman MJ, Richner JM, Caine EA, Salazar V, et al. (2016). Zika virus infection damages the testes in mice. Nature 540, 438–442. [DOI] [PMC free article] [PubMed] [Google Scholar]
- Hawman DW, Stoermer KA, Montgomery SA, Pal P, Oko L, Diamond MS, and Morrison TE (2013). Chronic joint disease caused by persistent Chikungunya virus infection is controlled by the adaptive immune response. J Virol 87, 13878–13888. [DOI] [PMC free article] [PubMed] [Google Scholar]
- Hermance ME, and Thangamani S (2017). Powassan Virus: An Emerging Arbovirus of Public Health Concern in North America. Vector Borne Zoonotic Dis 17, 453–462. [DOI] [PMC free article] [PubMed] [Google Scholar]
- Heuckeroth RO (2018). Hirschsprung disease - integrating basic science and clinical medicine to improve outcomes. Nat Rev Gastroenterol Hepatol 15, 152–167. [DOI] [PubMed] [Google Scholar]
- Inglis FM, Lee KM, Chiu KB, Purcell OM, Didier PJ, Russell-Lodrigue K, Weaver SC, Roy CJ, and MacLean AG (2016). Neuropathogenesis of Chikungunya infection: astrogliosis and innate immune activation. J Neurovirol 22, 140–148. [DOI] [PMC free article] [PubMed] [Google Scholar]
- Khoury-Hanold W, Yordy B, Kong P, Kong Y, Ge W, Szigeti-Buck K, Ralevski A, Horvath TL, and Iwasaki A (2016). Viral Spread to Enteric Neurons Links Genital HSV-1 Infection to Toxic Megacolon and Lethality. Cell Host Microbe 19, 788–799. [DOI] [PMC free article] [PubMed] [Google Scholar]
- Kimura T, Sasaki M, Okumura M, Kim E, and Sawa H (2010). Flavivirus encephalitis: pathological aspects of mouse and other animal models. Vet Pathol 47, 806–818. [DOI] [PubMed] [Google Scholar]
- Klem F, Wadhwa A, Prokop LJ, Sundt WJ, Farrugia G, Camilleri M, Singh S, and Grover M (2017). Prevalence, Risk Factors, and Outcomes of Irritable Bowel Syndrome After Infectious Enteritis: A Systematic Review and Meta-analysis. Gastroenterology 152, 1042–1054.e1041. [DOI] [PMC free article] [PubMed] [Google Scholar]
- Knowles CH, Lindberg G, Panza E, and De Giorgio R (2013). New perspectives in the diagnosis and management of enteric neuropathies. Nat Rev Gastroenterol Hepatol 10, 206–218. [DOI] [PubMed] [Google Scholar]
- Lazear HM, Govero J, Smith AM, Platt DJ, Fernandez E, Miner JJ, and Diamond MS (2016). A Mouse Model of Zika Virus Pathogenesis. Cell Host Microbe 19, 720–730. [DOI] [PMC free article] [PubMed] [Google Scholar]
- Lazear HM, Lancaster A, Wilkins C, Suthar MS, Huang A, Vick SC, Clepper L, Thackray L, Brassil MM, Virgin HW, et al. (2013). IRF-3, IRF-5, and IRF-7 coordinately regulate the type I IFN response in myeloid dendritic cells downstream of MAVS signaling. PLoS Pathog 9, e1003118. [DOI] [PMC free article] [PubMed] [Google Scholar]
- Liebregts T, Adam B, Bredack C, Roth A, Heinzel S, Lester S, Downie-Doyle S, Smith E, Drew P, Talley NJ, et al. (2007). Immune activation in patients with irritable bowel syndrome. Gastroenterology 132, 913–920. [DOI] [PubMed] [Google Scholar]
- Liljestrom P, Lusa S, Huylebroeck D, and Garoff H (1991). In vitro mutagenesis of a full-length cDNA clone of Semliki Forest virus: the small 6,000-molecular-weight membrane protein modulates virus release. J Virol 65, 4107–4113. [DOI] [PMC free article] [PubMed] [Google Scholar]
- Liu WJ, Chen HB, and Khromykh AA (2003). Molecular and functional analyses of Kunjin virus infectious cDNA clones demonstrate the essential roles for NS2A in virus assembly and for a nonconservative residue in NS3 in RNA replication. J Virol 77, 7804–7813. [DOI] [PMC free article] [PubMed] [Google Scholar]
- Marshall JK, Thabane M, Borgaonkar MR, and James C (2007). Postinfectious irritable bowel syndrome after a food-borne outbreak of acute gastroenteritis attributed to a viral pathogen. Clin Gastroenterol Hepatol 5, 457–460. [DOI] [PubMed] [Google Scholar]
- Miner JJ, Cao B, Govero J, Smith AM, Fernandez E, Cabrera OH, Garber C, Noll M, Klein RS, Noguchi KK, et al. (2016). Zika Virus Infection during Pregnancy in Mice Causes Placental Damage and Fetal Demise. Cell 165, 1081–1091. [DOI] [PMC free article] [PubMed] [Google Scholar]
- Miner JJ, and Diamond MS (2017). Zika Virus Pathogenesis and Tissue Tropism. Cell Host Microbe 21, 134–142. [DOI] [PMC free article] [PubMed] [Google Scholar]
- Nagata N, Iwata-Yoshikawa N, Hayasaka D, Sato Y, Kojima A, Kariwa H, Takashima I, Takasaki T, Kurane I, Sata T, et al. (2015). The pathogenesis of 3 neurotropic flaviviruses in a mouse model depends on the route of neuroinvasion after viremia. J Neuropathol Exp Neurol 74, 250–260. [DOI] [PubMed] [Google Scholar]
- Nurko S (2017). Motility Disorders in Children. Pediatric clinics of North America 64, 593–612. [DOI] [PubMed] [Google Scholar]
- O'Malley D, Quigley EM, Dinan TG, and Cryan JF (2011). Do interactions between stress and immune responses lead to symptom exacerbations in irritable bowel syndrome? Brain Behav Immun 25, 1333–1341. [DOI] [PubMed] [Google Scholar]
- Oliphant T, Engle M, Nybakken GE, Doane C, Johnson S, Huang L, Gorlatov S, Mehlhop E, Marri A, Chung KM, et al. (2005). Development of a humanized monoclonal antibody with therapeutic potential against West Nile virus. Nat Med 11, 522–530. [DOI] [PMC free article] [PubMed] [Google Scholar]
- Petrakova O, Volkova E, Gorchakov R, Paessler S, Kinney RM, and Frolov I (2005). Noncytopathic replication of Venezuelan equine encephalitis virus and eastern equine encephalitis virus replicons in Mammalian cells. J Virol 79, 7597–7608. [DOI] [PMC free article] [PubMed] [Google Scholar]
- Phillpotts RJ, and Wright AJ (1999). TC-83 vaccine protects against airborne or subcutaneous challenge with heterologous mouse-virulent strains of Venezuelan equine encephalitis virus. Vaccine 17, 982–988. [DOI] [PubMed] [Google Scholar]
- Platt DJ, Smith AM, Arora N, Diamond MS, Coyne CB, and Miner JJ (2018). Zika virus-related neurotropic flaviviruses infect human placental explants and cause fetal demise in mice. Sci Transl Med 10. [DOI] [PMC free article] [PubMed] [Google Scholar]
- Porter CK, Choi D, Cash B, Pimentel M, Murray J, May L, and Riddle MS (2013). Pathogen-specific risk of chronic gastrointestinal disorders following bacterial causes of foodborne illness. BMC Gastroenterol 13, 46. [DOI] [PMC free article] [PubMed] [Google Scholar]
- Porter CK, Faix DJ, Shiau D, Espiritu J, Espinosa BJ, and Riddle MS (2012). Postinfectious gastrointestinal disorders following norovirus outbreaks. Clin Infect Dis 55, 915–922. [DOI] [PubMed] [Google Scholar]
- Samuel MA, Wang H, Siddharthan V, Morrey JD, and Diamond MS (2007). Axonal transport mediates West Nile virus entry into the central nervous system and induces acute flaccid paralysis. Proc Natl Acad Sci U S A 104, 17140–17145. [DOI] [PMC free article] [PubMed] [Google Scholar]
- Scherret JH, Mackenzie JS, Hall RA, Deubel V, and Gould EA (2002). Phylogeny and molecular epidemiology of West Nile and Kunjin viruses. Curr Top Microbiol Immunol 267, 373–390. [DOI] [PubMed] [Google Scholar]
- Sejvar JJ (2014). Clinical manifestations and outcomes of West Nile virus infection. Viruses 6, 606–623. [DOI] [PMC free article] [PubMed] [Google Scholar]
- Sheehan KC, Lai KS, Dunn GP, Bruce AT, Diamond MS, Heutel JD, Dungo-Arthur C, Carrero JA, White JM, Hertzog PJ, et al. (2006). Blocking monoclonal antibodies specific for mouse IFN-alpha/beta receptor subunit 1 (IFNAR-1) from mice immunized by in vivo hydrodynamic transfection. J Interferon Cytokine Res 26, 804–819. [DOI] [PubMed] [Google Scholar]
- Shrestha B, and Diamond MS (2004). Role of CD8+ T cells in control of West Nile virus infection. J Virol 78, 8312–8321. [DOI] [PMC free article] [PubMed] [Google Scholar]
- Shrestha B, Gottlieb D, and Diamond MS (2003). Infection and Injury of Neurons by West Nile Encephalitis Virus. J Virol 77, 13203–13213. [DOI] [PMC free article] [PubMed] [Google Scholar]
- Soyturk M, Akpinar H, Gurler O, Pozio E, Sari I, Akar S, Akarsu M, Birlik M, Onen F, and Akkoc N (2007). Irritable bowel syndrome in persons who acquired trichinellosis. Am J Gastroenterol 102, 1064–1069. [DOI] [PubMed] [Google Scholar]
- Steele KE, Linn MJ, Schoepp RJ, Komar N, Geisbert TW, Manduca RM, Calle PP, Raphael BL, Clippinger TL, Larsen T, et al. (2000). Pathology of fatal West Nile virus infections in native and exotic birds during the 1999 outbreak in New York City, New York. Vet Pathol 37, 208–224. [DOI] [PubMed] [Google Scholar]
- Suthar MS, Diamond MS, and Gale M Jr. (2013). West Nile virus infection and immunity. Nat Rev Microbiol 11, 115–128. [DOI] [PubMed] [Google Scholar]
- Villanacci V, Annese V, Cuttitta A, Fisogni S, Scaramuzzi G, De Santo E, Corazzi N, and Bassotti G (2010). An immunohistochemical study of the myenteric plexus in idiopathic achalasia. J Clin Gastroenterol 44, 407–410. [DOI] [PubMed] [Google Scholar]
- Wang H, Siddharthan V, Hall JO, and Morrey JD (2011). Autonomic nervous dysfunction in hamsters infected with West Nile virus. PLoS One 6, e19575. [DOI] [PMC free article] [PubMed] [Google Scholar]
- Weingartl HM, Neufeld JL, Copps J, and Marszal P (2004). Experimental West Nile virus infection in blue jays (Cyanocitta cristata) and crows (Corvus brachyrhynchos). Vet Pathol 41, 362–370. [DOI] [PubMed] [Google Scholar]
- Weiss D, Carr D, Kellachan J, Tan C, Phillips M, Bresnitz E, Layton M, and West Nile Virus Outbreak Response Working, G. (2001). Clinical findings of West Nile virus infection in hospitalized patients, New York and New Jersey, 2000. Emerg Infect Dis 7, 654–658. [DOI] [PMC free article] [PubMed] [Google Scholar]
- Zanini B, Ricci C, Bandera F, Caselani F, Magni A, Laronga AM, Lanzini A, and San Felice del Benaco Study, I. (2012). Incidence of post-infectious irritable bowel syndrome and functional intestinal disorders following a water-borne viral gastroenteritis outbreak. Am J Gastroenterol 107, 891–899. [DOI] [PubMed] [Google Scholar]
Associated Data
This section collects any data citations, data availability statements, or supplementary materials included in this article.
Supplementary Materials
Figure S1. Flavivirus-induced GI pathology localizes preferentially to the distal small intestine. Related to Figure 1.
Figure S2. ZIKV and CHIKV infection of the GI tract. Related to Figure 2.
Figure S3. WNV-antigen staining and histological analysis of proximal and mid small intestinal tissues. Related to Figure 3.
Figure S4. T cell infiltration of the myenteric plexus in WNV-infected GI tract. Related to Figure 4.
Figure S6. VEEV TC-83 infection and effects on GI transit. Related to Figure 7.