Abstract
Objective:
Shorter electrode arrays and soft surgical techniques allow for preservation of acoustic hearing in many cochlear implant (CI) users. Recently, we developed a method of using the Neural Response Telemetry (NRT) system built in Custom Sound EP clinical software to record acoustically evoked electrocochleography (ECoG) responses from an intracochlear electrode in Nucleus Hybrid CI users (Abbas, et al., 2017). We recorded responses dominated by the hair cells (cochlear microphonic, CM/DIF) and the auditory nerve (auditory nerve neurophonic, ANN/SUM). Unfortunately, the recording procedure was time consuming, limiting potential clinical applications. This report describes a modified method to record the ECoG response more efficiently. We refer to this modified technique as the “short window” method, while our previous technique (Abbas, et al., 2017) is referred as the “long window” method. In this report, our goal was to 1) evaluate the feasibility of the short window method to record the CM/DIF and ANN/SUM responses, 2) characterize the reliability and sensitivity of the measures recorded using the short window method, and 3) evaluate the relationship between the CM/DIF and ANN/SUM measures recorded using the modified method and audiometric thresholds.
Method:
Thirty-four postlingually deafened adult Hybrid CI users participated in this study. Acoustic tone bursts were presented at four frequencies (250, 500, 750, and 1000 Hz) at various stimulation levels via an insert earphone in both condensation and rarefaction polarities. Acoustically evoked ECoG responses were recorded from the most apical electrode in the intracochlear array. These two responses were subtracted to emphasize the CM/DIF responses and added to emphasize the ANN/SUM responses. Response thresholds were determined based on visual inspection of time waveforms, and trough-to-peak analysis technique was used to quantify response amplitudes. Within-subject comparison of responses measured using both short and long window methods were obtained from seven subjects. We also assessed the reliability and sensitivity of the short window method by comparing repeated measures from 19 subjects at different times. Correlations between CM/DIF and ANN/SUM measures using the short window recording method and audiometric thresholds were also assessed.
Results:
Regardless of the recording method, CM/DIF responses were larger than ANN/SUM responses. Responses obtained using the short window method were positively correlated to those obtained using the conventional long window method. Subjects who had stable acoustic hearing at two different time points had similar ECoG responses at those points, confirming high test-retest reliability of the short window method. Subjects who lost hearing between two different time points showed increases in ECoG thresholds, suggesting that physiologic ECoG responses are sensitive to audiometric changes. Correlations between CM/DIF and ANN/SUM thresholds and audiometric thresholds at all tested frequencies were significant.
Conclusion:
This study compares two different recording methods. Intracochlear ECoG measures recorded using the short window technique were efficient, reliable, and repeatable. We were able to collect more frequency specific data with the short window method, and observed similar results between the long window and short window methods. Correlations between physiological thresholds and audiometric thresholds were similar to those reported previously using the long window method (Abbas, et al., 2017). This is an important finding because it demonstrates that clinically-available software can be used to measure frequency-specific ECoG responses with enhanced efficiency, increasing the odds that this technique might move from the laboratory into clinical practice.
Keywords: Cochlear Implant, Hybrid, Electrocochleography, Cochlear Microphonic, Auditory Nerve Neurophonic, Neural Response Telemetry, Hearing Preservation
Introduction
The Centers for Disease Control and Prevention (CDC) and the National Center for Health Statistics (NCHS) estimate that 61.1 million American adults between the ages of 20 and 69 suffer from some degree of high-frequency hearing loss which makes speech recognition difficult, especially in noisy situations (2011–2012 U.S. National Health and Nutrition Examination Survey, CDC & NCHS, 2014; Hoffman, et al., 2017). Individuals with good low-frequency hearing but substantial bilateral, high-frequency hearing loss often receive limited benefits from hearing aids (Turner, 2006 for review). For this population, combined electro-acoustic stimulation (EAS) can offer some relief. EAS systems provide both electric and acoustic stimulation to the same ear. Intracochlear electrode arrays are implanted via soft surgical techniques meant to preserve residual low-frequency acoustic hearing. The electrode array provides high-frequency electric stimulation, while an integrated hearing aid provides acoustic amplification in the low frequencies.
This report focuses on patients who use one of several different Cochlear Nucleus Hybrid electrode arrays. The S8 Hybrid array has 6 electrodes and an insertion depth of 10 mm. The S12 Hybrid has 10 electrodes that are inserted to a depth of 10mm. The L24 Hybrid has 22 electrodes with a 17.5–18 mm insertion depth. The CI422/522 electrode also has 22 electrodes with a 20–25 mm insertion depth, but features a structural lateral wall placement. Although not marketed as hearing preservation arrays, the CI422/522 arrays are intended for preservation of cochlear structures. Several investigators have reported that it is possible to preserve hearing with these lateral wall arrays as well as with the Hybrid electrode arrays (Jurawitz, et al., 2014; Skarzynski, et al., 2014; van Abel, et al., 2015).
Hearing preservation has been shown to enhance music perception and speech perception in background noise. Individuals who use an EAS device generally enjoy better outcomes than individuals who use a conventional cochlear implant (Gantz, et al., 2016; Gfeller, et al., 2006; Lenarz, et al., 2013; Roland, et al., 2016; Turner, et al., 2004). A U.S. multicenter clinical trial of the Nucleus Hybrid L24 CI system (Cochlear Ltd., NSW, Australia) revealed significant improvements in speech understanding in quiet (CNC words) and noise (AzBio sentences) among more than 90% of subjects with the Hybrid CI over a hearing aid preoperatively (Roland, et al., 2016). Similarly, a U.S. multicenter clinical trial with the MED-EL EAS system with the FLEX24 electrode array (MED-EL GmbH, Innsbruck, Austria) showed more than 90% of subjects performed similarly to or better on CUNY sentences in noise and CNC words in quiet at 12 months post CI activation compared to their preoperative performance (Pillsbury, et al., 2018).
It is widely assumed that the number, distribution, and viability of neuronal survival play an important role in cochlear implant performance (Fayad, et al., 2006; Kawano, et al. 1998; Khan, et al., 2005a, b; Kim, et al., 2010; Nadol, et al., 2001). In addition, the amount of preserved residual hearing may relate to post-operative speech recognition. Patients with better acoustic hearing post-operatively show better speech recognition performance in noise (Gifford, et al, 2013; Turner, et al, 2008). Similarly, for standard CI patients, preoperative audiometric threshold showed small but significant correlations with post-operative speech perception outcomes in quiet in the pediatric population (PB-K words, r2 = 0.37; Formeister, et al., 2015) and adults (CNC words, r2 = 0.19; Fitzpatrick, et al., 2014).
Despite efforts to preserve cochlear structures and residual hearing via soft surgical techniques and the use of specially designed intracochlear electrode arrays, those implanted with hearing preservation electrode arrays often experience 10–15 dB of acoustic hearing loss in the implanted ear immediately after the surgery (Gantz, et al., 2009, 2016; Gifford, et al., 2008; Podskarbi-Fayette, et al., 2010). The assumption is that this initial loss of acoustic hearing is due to insertion trauma. There have also been reports of delayed-onset hearing loss that occurs within the first year of CI use in a small population of Hybrid CI users. For example, 20% of Hybrid S8 users experienced an average of 24 dB of hearing loss several months after surgery in addition to hearing loss documented at initial activation (Kopelovich, et al., 2015). A retrospective chart review of patients implanted with hearing preservation arrays at the University of Iowa also revealed that 38% of adults implanted with hearing preservation electrode arrays presented with delayed-onset hearing loss of various degrees and rates, though approximately 80% of all patients in that study still retained useful acoustic hearing in the implanted ear (Scheperle, et al., 2017).
Many investigators have used audiometric thresholds to quantify the post-operative acoustic hearing of Hybrid CI users (Gifford, et al., 2008; Gantz, et al., 2009, 2016, 2017; Podskarbi-Fayette, et al., 2010; Kopelovich, et al., 2015). Audiometric thresholds do not provide detailed information about the status of the peripheral auditory system. More importantly, declines in audiometric thresholds for EAS CI users with delayed hearing loss will not necessarily reflect the underlying hair cell or neural damage. For example, animal studies of noise-induced hearing loss in mice show that shifts in audiometric thresholds and otoacoustic emissions were ultimately reversible, while neuronal damage was still present, including swelling of cochlear nerve terminals in the inner hair cells and spiral ganglion cell degeneration (Kujawa and Liberman, 2006; Liberman and Mulroy, 1982; Robertson, 1983). Threshold recovery despite neuronal loss or damage implies that behavioral threshold is insensitive to the affected neurons and neuronal degeneration while hair cell function is intact (Kujawa and Liberman, 2009). Therefore, audiometric thresholds alone do not provide a comprehensive picture of the functional status of peripheral auditory system.
An alternative approach to measure cochlear health may be to use acoustic stimuli and electrophysiological measures of hearing function. Electrocochleography (ECoG) is a technique used to record acoustically evoked electrical potentials containing complex signals from hair cells and auditory nerve fibers. The ECoG is a composite response that consists of four different components. The cochlear microphonic (CM), a hair cell response, is mostly derived from the outer hair cells but with some contributions from the inner hair cells. It represents the current flow through the mechanoelectric transducer channels in the stereocilia of hair cells (Patuzzi, et al., 1989; Verpy, et al., 2008). The summating potential (SP) is the DC stimulus-evoked potentials recorded during sound presentation. It likely reflects mixed contributions from both inner and outer hair cells, as well as neural components (Durrant, et al., 1998; Zheng, et al., 1997; Forgues, et al., 2014). Signals from auditory nerve fibers include the compound action potential (CAP) that occurs at the onset and offset of sounds, and the auditory nerve neurophonic (ANN) which is the result of phase-locked activity of auditory nerve fibers to sinusoidal stimuli (Fitzpatrick, et al., 2014; Portmann, et al., 1983; Ruth, et al., 1988; Schoonhoven, et al., 1995). This complex response provides a rich source of information about the survival of functional cochlear elements which would be important for Hybrid CI users.
Previous studies have recorded ECoG responses intraoperatively using a recording electrode placed on the round window before or after electrode insertion. Intraoperative round window ECoG responses have shown small, but significant correlations with postoperative speech scores in quiet both in pediatric and adult users of standard CI arrays (Choudhury, et al., 2012; Fitzpatrick, et al., 2014; Formeister, et al., 2015). Besides extracochlear ECoG recordings, intracochlear ECoG measures obtained from one of the intracochlear electrode arrays have been monitored during and/or after the electrode insertion, and correlated with postoperative residual hearing outcomes. Mixed results have been reported regarding the prognostic value of intraoperative ECoG measures on hearing preservation. Some studies suggest correlations between intraoperative ECoG recordings and postoperative hearing loss (Campbell, et al., 2016; Dalbert, et al., 2018), while others found a limited relationship between intraoperative ECoG changes and increase in the postoperative hearing thresholds (Adunka, et al., 2016; O’Connell, et al., 2017). Beyond the intraoperative ECoG studies, other investigators have recorded the intracochlear ECoG responses postoperatively using acoustic stimuli, using specialized research software. These studies showed that postoperative ECoG thresholds significantly correlated with preserved acoustic hearing at low frequencies (Campbell, et al., 2014; Koka, et al., 2017; O’Connell, et al., 2017).
Recently, we developed a method of using standard clinical software (Custom Sound EP) to record acoustically evoked ECoG responses from an intracochlear electrode in Nucleus Hybrid CI users (Abbas, et al., 2017). ECoG responses were recorded using both positive and negative leading low-frequency tone bursts. We then added the two recordings to emphasize the response from the auditory nerve (e.g. the CAP and the ANN) and subtracted the two recordings to emphasize the cochlear microphonic (e.g. the CM). Recognizing that this difference and summation technique does not completely isolate the CM and ANN/CAP, we will refer to the composite waveforms as the CM/DIF and ANN/SUM waveforms for the remainder of this report. In our prior study, both the CM/DIF and ANN/SUM components were identified for most subjects, and a significant correlation between electrophysiological responses and behavioral thresholds was obtained (Abbas, et al., 2017). Furthermore, changes over time in behavioral audiometric thresholds were mirrored by changes in the acoustically evoked potentials. Unfortunately, the procedure we used to measure the acoustically evoked ECoG response was time-consuming, limiting data collection to a single frequency (500 Hz).
This report describes a method that we have developed to more efficiently record the ECoG response. We refer to the original recording technique used in Abbas, et al. (2017) study as the “long window” method. The modified paradigm described in this report is referred to as the “short window” method. The goals of this study were 1) to evaluate the feasibility of the short window recording technique to record the CM/DIF and ANN/SUM responses, 2) to characterize the general reliability and stability of the measures recorded using the short window recording method, and 3) evaluate the relationship between the CM/DIF and ANN/SUM measures and audiometric threshold.
Methods
Participants
Thirty-four postlingually deafened Nucleus Hybrid CI users participated in this study. They were implanted at the University of Iowa Hospitals and Clinics (UIHC) between 2008 and 2017. Twenty-six used the Hybrid L24; five used the Hybrid S12; one used the Hybrid S8; two used the standard lateral wall CI422/522 electrode arrays. The study participants ranged in age from 16 to 90 years at the time of testing. All 34 study participants had been using their CIs for at least two weeks at the time of testing. Some individuals were tested more than once as indicated in Table 1.
Table 1.
Demographic information of study participants
| Subject ID | Electrode | Ear | Gender | DOB | Implant Activation | Age at CI activation (years) | Test dates (Months post-op) |
|---|---|---|---|---|---|---|---|
| CL5R | L24 | L | F | 4/7/2000 | 5/22/2012 | 12 | 46 |
| L2 | L24 | L | F | 12/6/1947 | 12/1/2008 | 73 | 60 |
| L18R | L24 | R | F | 9/19/1977 | 4/7/2014 | 36 | 24 |
| L19R | L24 | R | F | 10/22/1957 | 6/4/2014 | 56 | 21 |
| L31L | L24 | L | M | 9/26/1957 | 4/23/2015 | 57 | 12 |
| L32R | L24 | R | F | 5/20/1964 | 4/24/2015 | 50 | 10, 17 |
| L34L | L24 | L | F | 8/29/1957 | 10/14/2015 | 58 | 5 |
| L36R | L24 | R | M | 4/26/1950 | 12/10/2015 | 65 | 6, 12 |
| L37R | L24 | R | M | 3/14/1977 | 1/11/2016 | 38 | 3, 7 |
| L39L | L24 | L | F | 7/24/1951 | 3/31/2016 | 64 | 0.5, 12 |
| L41R | L24 | R | F | 2/22/1946 | 4/26/2016 | 70 | 1, 6 |
| L42R | L24 | R | M | 3/20/1941 | 4/14/2016 | 75 | 0.5, 6 |
| L43R | L24 | R | F | 9/6/1939 | 7/19/2016 | 76 | 1, 3 |
| L44R | L24 | R | M | 11/14/1963 | 12/31/2015 | 52 | 12 |
| L45L | L24 | L | M | 11/4/1954 | 7/1/2016 | 61 | 3, 6 |
| L46R | L24 | R | M | 5/24/1934 | 7/5/2016 | 82 | 3, 12 |
| L48R | L24 | R | M | 2/13/1946 | 4/21/2016 | 70 | 3 |
| L49R | L24 | R | M | 8/17/1950 | 7/6/2016 | 65 | 6 |
| L50R | L24 | R | M | 8/9/1951 | 9/22/2016 | 65 | 0.5, 1 |
| L51R | L24 | R | F | 3/11/1941 | 10/21/2016 | 75 | 1, 3 |
| L54R | L24 | R | F | 6/21/1941 | 9/23/2016 | 75 | 0.5, 6 |
| L55R | L24 | R | M | 9/11/1941 | 9/15/2016 | 75 | 0.5, 6 |
| L58L | L24 | L | M | 6/13/1933 | 12/8/2016 | 83 | 0.5 |
| L59R | L24 | R | M | 8/29/1942 | 12/7/2016 | 74 | 0.5, 3 |
| L62L | L24 | L | M | 2/26/1946 | 3/2/2017 | 71 | 0.5, 3 |
| L63L | L24 | L | M | 5/14/1953 | 3/3/2017 | 63 | 0.5 |
| S14R | 422 | R | M | 5/7/1929 | 4/26/2013 | 83 | 35 |
| 522–3R | 522 | R | M | 12/16/1925 | 12/8/2016 | 90 | 0.5, 1 |
| A12 | S8 | R | F | 6/28/1953 | 1/10/2007 | 53 | 113 |
| T6 | S12 | L | F | 5/9/1946 | 4/28/2009 | 62 | 83 |
| T10L | S12 | L | F | 10/28/1969 | 1/10/2011 | 41 | 73 |
| S12RW-1R | S12 | R | M | 2/10/1953 | 3/24/2016 | 63 | 1, 3 |
| S12RW-2R | S12 | R | M | 8/31/1951 | 6/3/2016 | 64 | 0.5, 3 |
| S12RW-3L | S12 | L | F | 2/13/1952 | 12/14/2016 | 64 | 1, 3 |
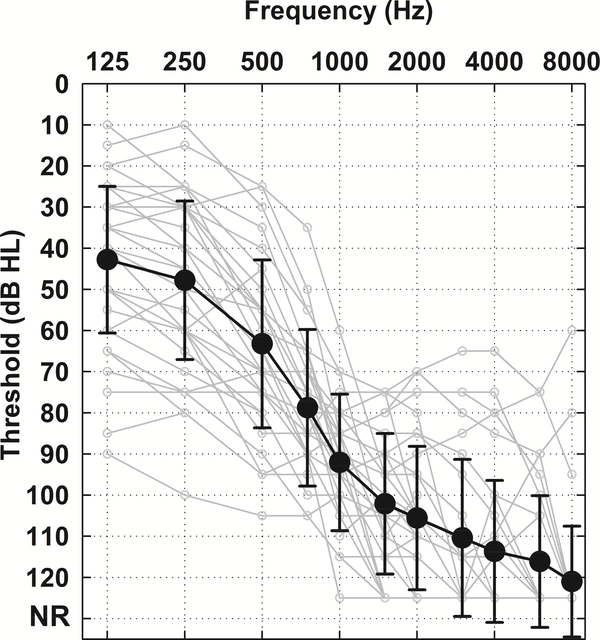
Figure 1 shows averaged postoperative unaided audiograms obtained at the time of ECoG testing for all 34 subjects. For those subjects who underwent repeated testing (including subjects who lost acoustic hearing over the repeated sessions), only the audiogram from the first test session is included. Clearly, hearing preservation was achieved for most subjects.
Figure 1.
Postoperative unaided audiogram of all study participants (n = 34). Solid black line indicates the grand mean with error bars of ± 1 standard deviation (SD). Light grey lines represent individual audiograms. No audiometric responses at the limits of the audiometer were coded as 125 dB HL.
This study was approved by the University of Iowa Institutional Review Board. All subjects signed an informed consent document prior to participating in this study.
Stimulation and Recording Procedures
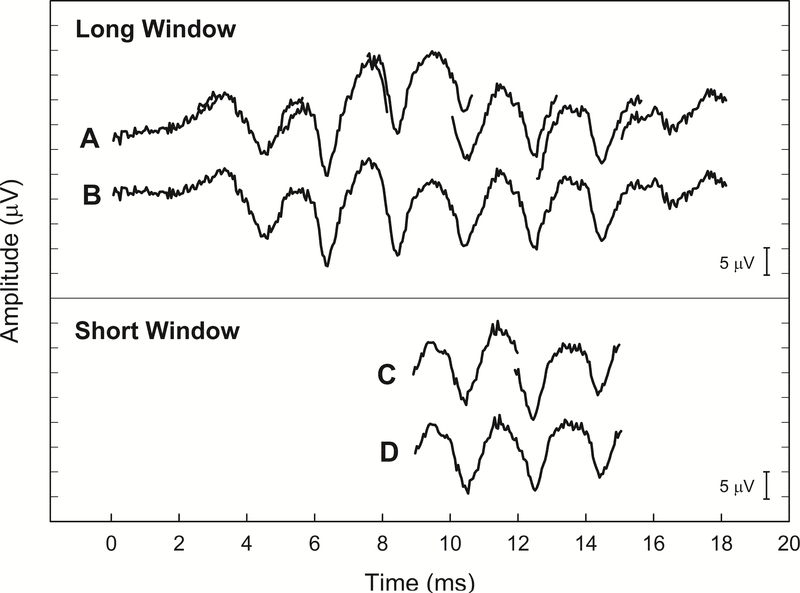
The long window recording method has been detailed previously (Abbas, et al., 2017). This technique is illustrated in Figure 2. Briefly, we utilized Neural Response Telemetry (NRT) available within Custom Sound EP version 3.2 to make these recordings. A research patch provided by Cochlear Ltd. allowed us to trigger an external acoustic stimulus generator, and an acoustic signal was then routed to the subject via an ER-3A insert earphone (Etymotic Research, Inc.).
Figure 2.
Recorded waveforms using the long window method (A and B) versus short window method (C and D) were compared. Recordings were obtained from a single subject (L58L) using 500Hz tone bursts presented at 95 dB SPL in positive polarity. Note the similarity in the recorded waveforms for the long and short window methods. Seven consecutive recordings (A) were made, then concatenated to produce a composite waveform (B) using the long window method. Similarly, two consecutive recordings (C) were made and the concatenated waveform (D) was obtained using the short window method.
The major limitation of using the clinical software to record ECoG is that the recording window is not long enough to capture long-latency and long-duration acoustically evoked potentials. The maximum recording window available with Custom Sound EP was 3.2 milliseconds. To overcome this limitation, we made a series of recordings, where the onset of recording was progressively delayed. Traditionally, the NRT system built in the Custom Sound EP software is used to record electrically evoked compound action potentials (ECAPs) via a “two-pulse paradigm”, in which a “masker” and “probe” biphasic current pulse is presented sequentially. These two pulses are separated by a brief masker-probe interval (MPI). To record the acoustically evoked ECoG responses, the masker and probe current level set to zero to make it inaudible. The research patch for the Custom Sound EP software allowed the generation of a trigger which occurred simultaneously with the masker presentation (stimulus onset), while the recording began after presentation of the probe pulse (recording onset). Multiple recordings were performed, in which the MPI was progressively lengthened. By lengthening the MPI, we effectively delayed the onset of the recording window. A total of seven recordings were collected. Responses were then concatenated offline to create an effectively longer time window. The final length of the long recording window was 18 milliseconds (Figure 2, Panels A and B). While successful, this procedure was time-intensive since seven recordings were necessary to record a response to one stimulus (Abbas, et al., 2017).
In the short window method, we only recorded two responses using recording delays such that the recordings were temporarily aligned with the center of the stimulus (Figure 2, Panels C and D). The MPIs for these selected windows were 9 and 12 ms, respectively. The total length of the short recording window was 6 ms. This modification significantly sped up data collection, allowing us to use a wider range of acoustic stimuli and presentation levels.
Similar stimulation and recording procedures in Abbas, et al. (2017) with minor modifications were used in this study. An external trigger generated by Custom Sound EP software was used to initiate acoustic stimuli externally at four different frequencies (250, 500, 750, 1000 Hz). The external trigger was synchronized to the onset of the acoustic stimuli and used to control the timing of the recordings via the Custom Sound EP software. Tone bursts were digitally generated using LabVIEW (version 2010, National Instruments) at a sampling rate of 44100 Hz. Tone bursts were 20 milliseconds in duration, which was longer than the 12 ms stimulus used in our previous study (Abbas, et al., 2017). Tone burst stimuli were routed through an audiometer (GSI 61) and presented to the implanted ear via an insert earphone at a 10 Hz stimulation rate.
Before the actual stimulation and recording started, loudness scaling was performed to identify each participant’s threshold and the most uncomfortable level for acoustic stimulation. For the actual recordings, acoustic stimuli were presented at different stimulation levels ranging from threshold to below their uncomfortable levels, in 5 dB steps. Responses were obtained using positive and negative polarity stimuli. We also obtained a “no stimulus” condition, in which stimuli were presented at the highest presentation level used for each subject, but the insert earphone was removed. This was done to verify that recordings were not contaminated by electrical artifacts from the transducer. This “no stimulus” condition also represented the artifact that resulted from the stimulus and/or artifact resulting from switching on the internal amplifier, and was subtracted from raw recordings prior to data analysis (Abbas, et al, 2017).
Data Analysis
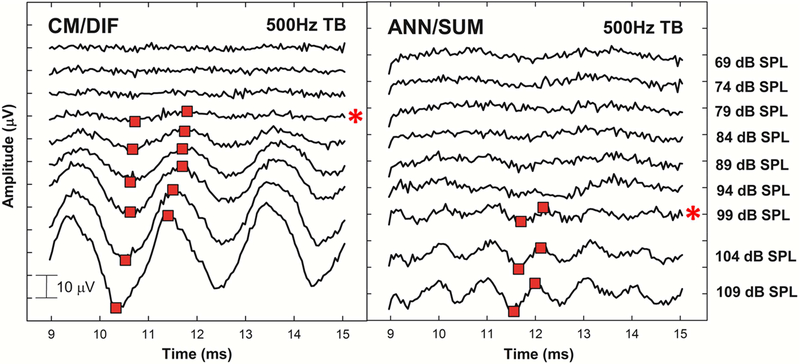
In our previous study, we used a Fast Fourier Transform analysis (FFT) to characterize the CM/DIF and ANN/SUM magnitude (Abbas, et al., 2017). When the short window method was used in the present report, reducing the length of the recording window also resulted in loss of frequency resolution in the FFT (160 Hz/bin for the short window method, 55 Hz/bin for the long window method). Therefore, results collected using the short window method were analyzed in the time domain. Trough-to-peak analysis of time waveforms was used to quantify amplitudes of CM/DIF and ANN/SUM responses. As presented in Figure 3, the most robust troughs and following peaks located around the middle of the recording window were selected by visual inspection. By using a custom MATLAB peak-picking program, we placed two markers on troughs and following peaks of our interest at the highest stimulation level, and measured amplitudes between two points and tracked down across levels to identify thresholds. Troughs and peaks occurring at the similar time period across different stimulation levels were carefully chosen for consistent and reliable analysis within each tested frequency. During the peak-picking process, we verified that the period of the resulting acoustic response corresponded to the expected frequency. For example, a 500 Hz tone burst should elicit a CM/DIF sinusoidal response with a 2 ms period and an ANN/SUM sinusoidal response with a 1 ms period (Figure 3). We used the periodicity at the highest stimulation level as a guide throughout the peak-picking process across levels down to threshold. This verification process ensured that the peaks and troughs picked appropriately corresponded to the stimulus frequency.
Figure 3.
Example of the trough-to-peak analysis on CM/DIF and ANN/SUM waveforms. Responses obtained to 500Hz tone bursts presented at various stimulation levels from a single subject (L58L). By using a custom MATLAB peak-picking program, red markers were placed at the most robust troughs and peaks by visual inspection to identify thresholds and quantify amplitudes between the two points. Asterisks on the right indicate CM/DIF and ANN/SUM thresholds.
In order to evaluate the reliability of the short window method, ECoG responses using short window method were compared to those using the long window method for seven subjects. We also assessed the stability of responses recorded using the short window by comparing repeated measures from nineteen subjects at different times. Twelve subjects had no change over time in their acoustic hearing thresholds, while other seven subjects lost some acoustic hearing over time. Changes in threshold of the CM/DIF and ANN/SUM recordings at test and retest sessions were calculated and compared to changes in audiometric thresholds between the same test sessions. Lastly, in order to assess sensitivity of the short window method, physiologic thresholds of the CM/DIF and ANN/SUM components were correlated with audiometric thresholds in all participants.
Results
Morphology of ECoG Responses
Figure 4 shows examples of raw ECoG waveforms recorded in opposite polarities and the extracted CM/DIF and ANN/SUM responses obtained using both long and short window methods from a single subject. These recordings were obtained using a 500 Hz tone burst presented at 95 dB SPL. The phase inversion is apparent in the raw waveforms (Figure 4, Panel A). By adding the two responses in opposite polarities together, we were able to minimize the CM/DIF potential and at least partially isolate the response from the auditory nerve (the ANN/SUM). By subtracting the two waveforms, we minimize neural components and enhance the CM/DIF potential (Figure 4, Panel B). Note that the ANN/SUM response has a frequency that is twice that of the CM/DIF response.
Figure 4.
(A) Raw time waveforms recorded in opposite polarities to 500 Hz tone bursts presented at 95 dB SPL from a single subject (L58L), (B) CM/DIF and ANN/SUM responses using the long versus short window methods. Responses using the long window method are marked in black, while overlaid waveforms in red show responses using the short window method.
The CM/DIF response follows the polarity of the stimulus, as expected. The primary component of the ANN/SUM response oscillates at twice the frequency of the stimulus. Neural responses are phase-locked to the depolarizing phase of the acoustic stimulation. Since response latencies to opposite polarity stimuli are ½ cycle relative to one another, summing responses recorded in response to opposite polarity stimuli results in doubling the frequency of the ANN/SUM responses. Hence, these neural waveforms contribute to the clear periodicity at the second harmonic (i.e. 1000Hz for the ANN/SUM response to a 500Hz tone burst, Figure 4). Both CM/DIF and ANN/SUM components were also apparent using the short window method, overlapping the long window responses (Figure 4, Panel B). A compound action potential (CAP) was also observed at the stimulus onset using the long window method as shown in ANN/SUM responses, whereas the short window method did not capture this onset response due to the location of the recording windows.
ECoG Growth Functions
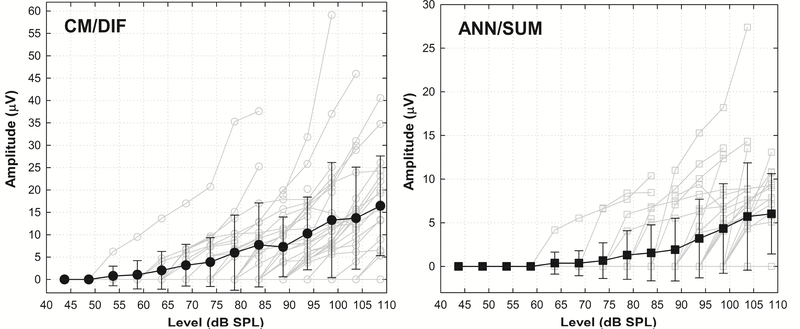
We measured ECoG amplitude growth functions using the short window method from all 34 subjects. The level of the tone burst was varied from close to behavioral threshold to slightly below uncomfortable levels. Responses recorded using opposite polarity stimuli were combined, and the CM/DIF and ANN/SUM waveforms for all stimulation levels computed. Figure 5 shows amplitude growth functions of all participants, as a function of stimulation level at 500Hz. Amplitudes are based on the trough-to-peak analysis as previously described. Amplitudes of CM/DIF responses are generally greater than ANN/SUM responses for a given stimulus level.
Figure 5.
Amplitude growth functions of CM/DIF and ANN/SUM responses to 500Hz tone bursts from all participants. Solid black lines with filled symbols show the grand mean ± 1 SD. Light grey lines with empty symbols indicate individual subject data. Notice the different scales applied to ordinates of CM/DIF and ANN/SUM responses.
Comparison of the Short and Long Window Methods
ECoG responses using both short and long window methods were compared for seven subjects. Regardless of the recording method, responses were analyzed by the trough-to-peak analysis to ensure consistent and reliable within-subject comparison between the two methods.
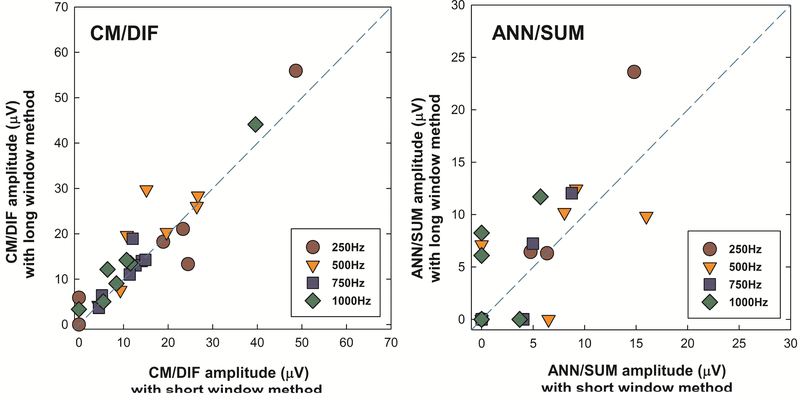
Figure 6 shows scatter plots describing a relationship between the suprathreshold CM/DIF and ANN/SUM amplitudes recorded using two different methods. No matter what method was used, CM/DIF responses tended to be larger than ANN/SUM responses. More importantly, we note CM/DIF amplitudes were close to the dashed reference line, suggesting a near 1:1 correspondence between results obtained using the short window method and the long window method. ANN/SUM amplitudes showed more variance, presumably due to reduced amplitudes of ANN/SUM responses. ANN/SUM responses are likely more affected by the noise floor of the recording system (approximately 5–6 μV, Patrick, et al., 2006) and the greater proportion of “no responses” added more variability between two methods.
Figure 6.
Scatter plots of suprathreshold CM/DIF and ANN/SUM amplitudes recorded using the long and short window methods. The abscissa represents physiological responses using the short window method, while the ordinate shows those with the long window method. The dashed line is a reference line indicating equal amplitude of the short and long window results. Notice the different scales applied to ordinates of CM/DIF and ANN/SUM responses.
The linear mixed effects model (LME) analysis was conducted to evaluate whether there was significant difference between the ECoG responses measured using the short window and the long window methods. The LME analysis was performed separately for CM/DIF and ANN/SUM responses. We included the different recording methods (i.e. the long window vs. the short window methods) and testing frequencies as fixed effects in the model, and a random intercept for subjects as a random effect. In this analysis, we focused on testing the main effect of the different recording methods to evaluate the reliability of the modified technique compared to the conventional method. No significant main effect of the different methods was observed at the .05 significance level (CM/DIF: F(1, 42) = 0.131, p = 0.719, ANN/SUM: F(1, 18) = 1.941, p = 0.180). These results suggest that the ECoG recordings obtained using the short window method are roughly equivalent to those obtained using the long window method, at least for levels that evoke a robust response.
Reliability and Sensitivity of the Modified Recording Method
Test-retest reliability of the short window method was analyzed for a subset of subjects who underwent repeated ECoG measurements. Nineteen subjects were assigned to two groups according to the stability of their residual hearing after surgery. The stable hearing group consisted of twelve subjects whose 4-frequency PTA (250–1000 Hz) were within 5 dB between test and retest sessions, while seven subjects in the delayed-onset hearing group had experienced changes in acoustic hearing exceeding 5 dB PTA between test and retest.
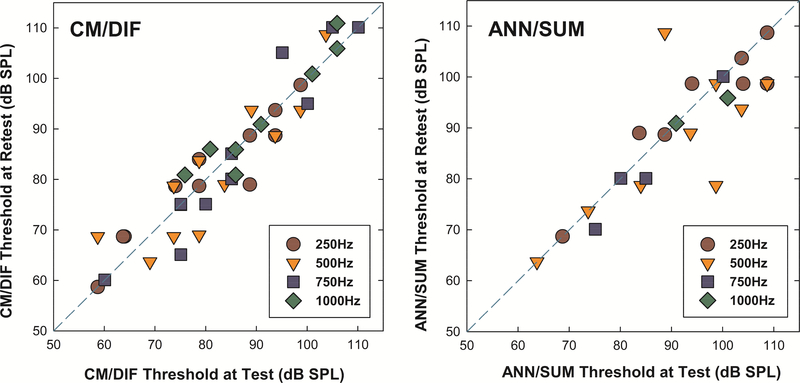
Figure 7 shows scatter plots describing a relationship between the CM/DIF and ANN/SUM thresholds at test and retest for the stable hearing group. The average interval between test and retest sessions for this stable hearing group was 3.2 months (range 0.5 – 5.5 months). CM/DIF thresholds at test and retest fell close to the dashed reference line, suggesting a near 1:1 correspondence between results obtained at two different testing sessions. We note that more variability in ANN/SUM thresholds which is suspected be from the lower amplitude of ANN/SUM responses in general (e.g. Abbas, et al., 2017), which can make peak-picking more difficult and variable.
Figure 7.
Scatter plots of CM/DIF and ANN/SUM thresholds at test and retest for the stable hearing group. The abscissa represents physiological thresholds at test, while the ordinate shows those at retest session. The dashed line is a reference line indicating equal CM/DIF and ANN/SUM thresholds at test and retest.
A linear mixed effects model (LME) analysis was implemented to evaluate whether there was significant difference in ECoG thresholds between test and retest sessions. We included the different testing sessions (i.e. test vs. retest) and test frequencies as fixed effects in the model, and a random intercept for subjects as a random effect. Similar to our previous analysis, we focused on the main effects of the different testing sessions to evaluate the test-retest reliability of the modified recording technique. No statistically significant differences between test and retest sessions were observed for both CM/DIF and ANN/SUM thresholds at the .05 significance level (CM/DIF: F(1, 74) = 0.016, p = 0.901, ANN/SUM: F(1, 29) = 1.069, p = 0.310). These results indicate good stability of the responses over time using the short window method for those with stable hearing.
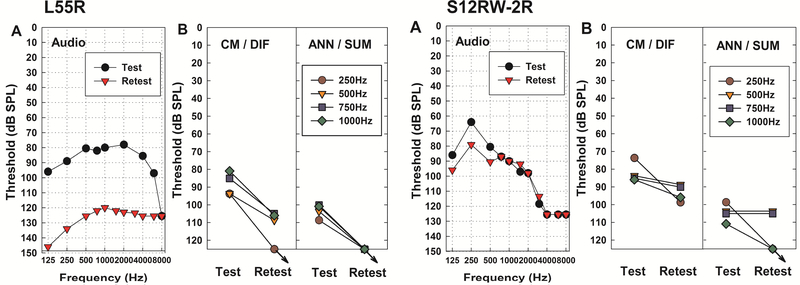
While more than half of this subset of subjects retained stable hearing, seven subjects lost some residual hearing over time. The average interval between test and retest sessions for this delayed-onset hearing group was 5.7 months (range 2 – 11.5 months). Figure 8 presents examples of two subjects who experienced changes in audiometric threshold, with the trajectory of CM/DIF and ANN/SUM thresholds between two testing sessions. Subject L55R, who had a significant hearing drop between test and retest (42.5 dB change in 4-frequency PTA), showed an increase in physiologic thresholds at the retest session. The other subject, S12RW-2R, experienced less hearing loss (6.25 dB change in 4-frequency PTA) but also showed an increase in CM/DIF and ANN/SUM thresholds from test to retest, despite the small amount of change in PTA. Besides these two subjects, the other five who lost their acoustic hearing presented with similarly elevated CM/DIF and ANN/SUM thresholds as their acoustic hearing changed over time. ECoG recordings obtained using the short window method appear to mirror the pattern of residual hearing changes.
Figure 8.
Examples from two subjects who experienced hearing loss over time. (A) Audiometric thresholds between test and retest. Note that the threshold values have been converted into dB SPL to facilitate comparison with physiologic thresholds, (B) CM/DIF and ANN/SUM thresholds changes at test and retest. Arrows indicate no response.
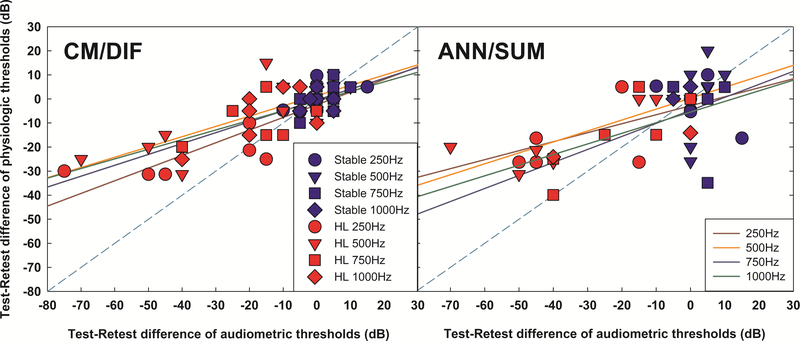
Test - retest differences of CM/DIF and ANN/SUM physiological thresholds and audiometric thresholds for two groups were correlated. Figure 9 shows significant correlations between changes of audiometric thresholds and physiologic thresholds across the delayed-onset hearing loss group and stable hearing group for CM/DIF responses (a) 250Hz: r = 0.8932, p < 0.001, b) 500Hz: r = 0.78, p < 0.001, c) 750Hz: r = 0.7479, p = 0.004, d) 1000Hz: r = 0.6480, p = 0.0031) and ANN/SUM responses at lower stimulation frequencies (a) 250Hz: r = 0.6126, p = 0.0198, b) 500Hz: r = 0.6951, p = 0.0028, c) 750Hz: r = 0.5762, p = 0.0635, d) 1000Hz : r = 0.6530, p = 0.2322). These results suggest that changes in physiological thresholds reflect changes in audiometric thresholds, especially for CM/DIF responses.
Figure 9.
Correlations between test – retest difference of physiologic and audiometric thresholds for the stable hearing group (in blue symbols) and delayed hearing loss group (in red symbols). Solid lines indicate linear regressions for each frequency. The dashed line is a reference line indicating equal difference of audiometric and physiologic thresholds between test and retest.
Relationship between ECoG Measures and Audiometric Thresholds
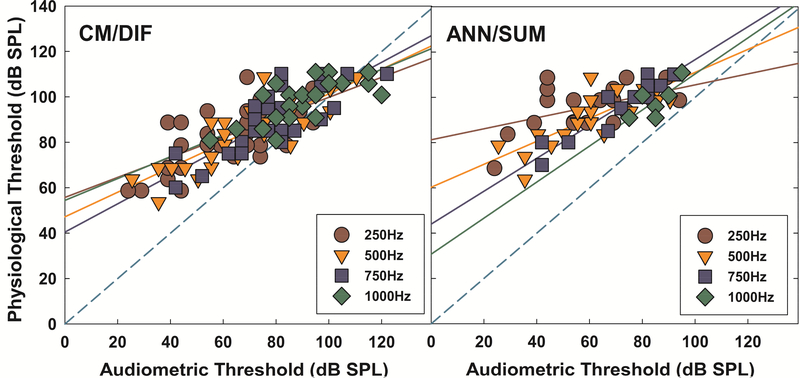
Physiologic and audiometric thresholds of all study participants were compared to investigate the correspondence between physiologic and behavioral data. As shown in Figure 10, audiometric thresholds and physiologic thresholds for both CM/DIF and ANN/SUM responses were significantly correlated at all tested frequencies (for CM/DIF responses: a) 250Hz : r = 0.642, p < 0.001, b) 500Hz : r = 0.815, p < 0.001, c) 750Hz : r = 0.813, p < 0.001, d) 1000Hz : r = 0.731, p < 0.001, for ANN/SUM responses : a) 250Hz: r = 0.502, p = 0.006, b) 500Hz: r = 0.795, p < 0.001, c) 750Hz: r = 0.821, p < 0.001, d) 1000Hz: r = 0.744, p = 0.045). There is a trend that both CM/DIF and ANN/SUM thresholds are elevated compared to audiometric thresholds in general. This result is consistent with the inherent discrepancies between electrophysiological and behavioral thresholds shown in previous evoked potential studies, suggesting the use of 5 to 20 dB correction factors that compensate this discrepancy to estimate hearing sensitivity (Elberling and Don, 1987; Gorga, et al., 2006; Stapells, et al., 2000; Tlumak, et al., 2007).
Figure 10.
Correlations between CM/DIF and ANN/SUM thresholds and audiometric thresholds across tested frequencies. Solid lines represent linear regressions for each frequency. The dashed line is a reference line, indicating the 1:1 relationship between audiometric and physiologic thresholds. The dashed line is a reference line indicating equal physiologic and audiometric thresholds.
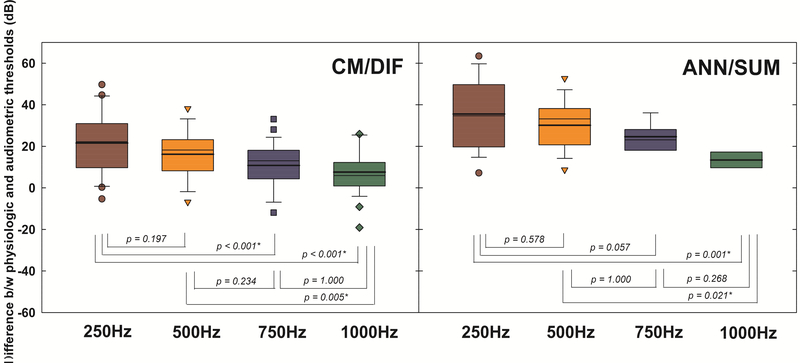
A linear mixed effects model (LME) analysis was implemented to evaluate whether there was a significant difference between audiometric and physiologic thresholds across frequencies. The test frequency was a fixed effect for this model, while a random intercept for subjects was a random effect. Differences between audiometric and physiologic thresholds for both CM/DIF and ANN/SUM responses were statistically significant across frequencies at the .05 significance level (CM/DIF: F(3, 84) = 12.096, p < 0.001, ANN/SUM: F(3, 35) = 6.726, p = 0.001). Figure 11 shows the follow-up pairwise comparisons across tested frequencies. Smaller differences imply that behavioral and physiologic thresholds closely mirror one another. For CM/DIF responses, the difference between physiologic and behavioral thresholds was significantly larger at 250 Hz relative to 750 Hz and 1000 Hz (p < 0.001 in both cases), and 500Hz against to 1000Hz (p = 0.005). For ANN/SUM responses, the difference was significantly larger for 250 Hz and 500 Hz against to 1000 Hz (p = 0.001 and p < 0.05, respectively). With lower stimulation frequencies, the site of stimulation progressively becomes more apical relative to the fixed position of the recording electrode. Thus, a higher stimulus level is required for the tone burst to reach the apical areas of the cochlea, leading to greater differences in physiologic and audiometric thresholds for lower frequencies. Moreover, CM/DIF thresholds tended to be closer to audiometric thresholds, whereas ANN/SUM thresholds were more elevated relative to the audiometric thresholds, likely reflecting that the recording electrode array is closer to the hair cells than the auditory nerve fibers (Abbas, et al., 2017).
Figure 11.
Box and whisker plots of differences between physiological thresholds and audiometric thresholds across tested frequencies, with medians (thin line) and means (thick line). Test statistics of the pairwise comparisons are presented under the box plots.
Discussion
This study demonstrated that the short window recording technique is an efficient method of recording acoustically evoked electrocochleograms from an intracochlear array using the NRT system. Compared to the previous long window method, the short window method reduced the data collection time from 5 minutes to 2 minutes for a single response at each frequency. Without compromising accuracy of the results, testing efficiency and efficacy were evidenced by similar ECoG data for both the long window and short window methods. Improving the efficiency of data collection is essential if the technique is to move from the laboratory to clinical practice. Moreover, enhanced efficiency enables extensive data collection. We also note that in general, CM/DIF responses were present for all stimulation frequencies while ANN/SUM responses were more difficult to record where audiometric threshold were worse at higher frequencies (Figure 10). The fewer responses may be due to limitations in neural phase locking as stimulation frequency increases (Johnson, 1980; Kiang, et al., 1965; Rose, et al., 1967), as well as the severity of hearing loss in the high frequencies.
Contributions from the hair cells (CM/DIF) and auditory nerve (ANN/SUM) were apparent using the modified technique. Generally, a larger response for the CM/DIF than the ANN/SUM was observed at all tested frequencies. This was consistent with our previous report using the long window method (Abbas, et al., 2017). This may indicate that using a shorter window was efficient enough to collect differential hair cell and neural components of the responses. We again note that isolation of hair cell and neural contributions is not complete with the difference and summation technique used here and in many previous studies. However, we argue that there are trends in the current dataset support that the difference response is biased towards the hair cell and the summed response is biased towards the neurons. We note that the latency of the ANN/SUM response is prolonged relative to the CM/DIF response (Figure 4) and we reported similar trends in our previous work using the long-window technique (Abbas, et al., 2017). This may reflect the fact that the recording electrode lies in closer proximity to the hair cells than nerve fibers. We also note that the CM/DIF thresholds did not deviate from audiometric thresholds as much as ANN/SUM thresholds (Figure 10), which again may reflect the position of the recording electrode relative to hair cells and nerve fibers.
Physiological thresholds and audiometric thresholds for both CM/DIF and ANN/SUM were significantly correlated at all four tested frequencies (Figure 10). Correlations between CM/DIF and ANN/SUM thresholds and audiometric thresholds were similar to those we have reported previously using the long window method (Abbas, et al., 2017). Moreover, these results are also consistent with the highly significant correlations between audiometric thresholds and difference / summation response thresholds across 125 to 4000 Hz in Advanced Bionics cochlear implant users (Koka, et al., 2017). The primary difference between the current study and the previous two reports (Abbas, et al., 2017; Koka, et al, 2017) is that our response amplitudes are based on the trough-to-peak analysis of the waveforms while the previous studies reported FFT magnitudes. This demonstrated that the trough-to-peak analysis used with the short window method is comparably similar to the FFT analysis.
Physiologic thresholds were typically elevated relative to behavioral thresholds using this modified method. Differences between physiologic and behavioral thresholds were larger at low-frequency than high-frequency tone bursts, and these differences were also larger for ANN/SUM responses relative to CM/DIF responses (Figure 11). Similar patterns were observed in O’Connell, et al. (2018), which showed that the mean difference between postoperative ECoG thresholds and behavioral thresholds were larger at lower frequencies (125 and 250Hz) compared to 500Hz. Koka, et al. (2017) also reported similar difference and summed ECoG data for 125 to 4000 Hz for 21 subjects. As the stimulus frequency increased, the difference between ECoG response thresholds and audiometric thresholds decreased (with the exception of 3000 and 4000 Hz). In addition, the deviation from audiometric threshold was greater for their ANN/SUM data. It is possible that the site of stimulation for low-frequency tone bursts is more apical relative to the fixed position of the recording electrode, leading to greater differences in physiologic and audiometric thresholds. In addressing the larger deviations of ANN/SUM responses relative to audiometric thresholds, we had reasoned that this reflect the close proximity of the recording electrode to the hair cells relative to the nerve fibers (Abbas, et al., 2017). However, Koka, et al. (2017) also proposed that the difference response contains both the hair cell and neural response while the summed response only contains the distortions of the hair cell and neural components (based on animal work of Forgues, et al., 2014). Thus, the difference response may be expected to be closer to audiometric threshold.
The major limitation of the short window method is that it precludes FFT analysis due to a shorter recording period leading to a less favorable resolution in the frequency domain. We instead performed the trough-to-peak analyses of the time waveforms to quantify CM/DIF and ANN/SUM thresholds and amplitudes. Trough-to-peak analysis of the CM/DIF and ANN/SUM waveforms was challenging and somewhat subjective, because responses are small and variable. Periodicity at low levels in the recordings is not always obvious. Adding to this complication is that ANN/SUM responses are generally smaller than CM/DIF responses and are closer to the noise floor of the recording system. Thus, it is more difficult to see the periodicity evident in ANN/SUM recordings and pick response amplitudes accordingly, which could contribute to the lower incidences of ANN/SUM responses reported in the current study. However, we also note fewer incidences of ANN/SUM responses relative to CM/DIF responses utilizing an FFT based analysis as well (Abbas, et al., 2017), so the fewer incidences of ANN/SUM responses are not solely due to the modified recording methodology. Another limitation of the short window method is that we are unable to capture the latency of the response as well as the onset CAP (Figure 4). Thus, if onset latencies and onset responses are of interest, the long window technique is necessary.
Despite of this limitation in data analysis, comparing ECoG thresholds with audiometric measures using this short window method also has potential clinical value to monitor changes in hearing in the Hybrid CI population, as in the delayed-onset hearing loss data presented in Figures 8 and 9. CM/DIF and ANN/SUM thresholds reflected the pattern of changes of their residual acoustic hearing, in that there was a significant correlation between changes in acoustic hearing and changes in ECoG thresholds, especially for the subjects who lost hearing (Figure 9). The reliability of monitoring ECoG responses to acoustic stimulation is important, because significant hearing loss can occur several months after CI surgery in some patients (Gantz, et al., 2017; Kopelovich, et al., 2015; Scheperle, et al., 2017). Since the cause of this delayed-onset hearing loss is generally unknown, a better understanding of physiological changes could be helpful to distinguish various etiologies of hearing loss (Abbas, et al., 2017; Kopelovich, et al., 2014, 2015; Scheperle, et al., 2017; Tanaka, et al., 2014). Monitoring contributions from cochlear hair cells and auditory nerve separately may be one way to separate changes in mechanical cochlear transduction or hair cell loss versus changes in synaptic function, which may inform underlying cause of delayed-onset hearing loss. Despite some of the limitations of the short window method, we have shown that this method is a promising clinical tool to monitor the status of cochlear and auditory neural survival reliably over time after implant surgery.
Conclusions
This study compares two different recording methods. Results show that the data recorded using the short window method was efficient, reliable, and sensitive. We were able to collect more data with the short window method, and observed similar results between the long window and short window methods. Correlations between CM/DIF and ANN/SUM thresholds and audiometric thresholds were significant, consistent with our previous report. This is an important finding because it demonstrates that we can use the clinically-available software to measure frequency-specific ECoG responses with enhanced efficiency, increasing the odds of translation into clinical practice.
Highlights.
Our previous method of using Neural Response Telemetry to record acoustically evoked ECoG from an intracochlear electrode of Hybrid CI users was feasible, but time consuming, limiting potential clinical applications
The modified technique to record ECoG from Hybrid CI users was feasible to measure responses dominated from the hair cells and auditory nerve fibers
Responses obtained using the modified recording method were comparable to those with our previous recording method
The modified recording method was more efficient, reliable over time, and sensitive to changes in acoustic hearing
Physiological ECoG thresholds obtained using the modified recording method were significantly correlated to audiometric thresholds at all tested frequencies
Acknowledgements
This work was supported by the National Institutes of Health (NIH) / National Institute on Deafness and other Communication Disorders (NIDCD) P50 DC000242. We are thankful to Dr. Jacob Oleson (Department of Biostatistics, University of Iowa) for the statistical counseling and constructive suggestions on the manuscript. We are also grateful to our participants with Hybrid CIs for their time and commitment to research appointments.
Footnotes
Conflict of Interest
The authors declare that they have no conflicts of interest.
Publisher's Disclaimer: This is a PDF file of an unedited manuscript that has been accepted for publication. As a service to our customers we are providing this early version of the manuscript. The manuscript will undergo copyediting, typesetting, and review of the resulting proof before it is published in its final citable form. Please note that during the production process errors may be discovered which could affect the content, and all legal disclaimers that apply to the journal pertain.
References
- Abbas PJ, Tejani VD, Scheperle RA, Brown CJ (2017). Using Neural Response Telemetry to monitor physiological responses to acoustic stimulation in Hybrid cochlear implant users. Ear Hear, 38(4): 409–425. [DOI] [PMC free article] [PubMed] [Google Scholar]
- Adunka OF, Giardina CK, Formeister EJ, Choudbury B, Buchman CA, Fitzpatrick DC Round window electrocochleography before and after cochlear implant electrode insertion. Laryngoscope, 126, 1193–1200. [DOI] [PMC free article] [PubMed] [Google Scholar]
- Campbell L, Kaicer A, Briggs R, et al. (2014). Cochlear response telemetry: intracochlear electrocochleography via cochlear implant neural response telemetry pilot study results. Otol Neurotol, 36, 399–405. [DOI] [PubMed] [Google Scholar]
- Campbell L, Kaicer A, Sly D, Iseli C, Wei B, Briggs R, O’Leary S (2016). Intraoperative realtime cochlear response telemetry predicts hearing preservation in cochlear implantation. Otol Neurotol, 37, 332–338. [DOI] [PubMed] [Google Scholar]
- Centers for Disease Control and Prevention (CDC), National Center for Health Statistics (NCHS). National Health and Nutrition Examination Survey: NHANES 2011–2012 overview. https://wwwn.cdc.gov/nchs/nhanes/continuousnhanes/Overview.aspx?BeginYear=2011. Updated December 5, 2014. Accessed January 15, 2018. [Google Scholar]
- Choudhury B, Fitzpatrick DC, Buchman CA, et al. (2012). Intraoperative round window recordings to acoustic stimuli from cochlear implant patients. Otol Neurotol, 33, 1507–1515. [DOI] [PMC free article] [PubMed] [Google Scholar]
- Dalbert A, Pfiffner F, Hoesil M, Koka K, Veraguth D, Roosli C, Huber A Assessment of cochlear function during cochlear implantation by extra- and intracochlear electrocochleography. Front Neurosci, 12:18, doi: 10.3389/fnins.2018.00018. [DOI] [PMC free article] [PubMed] [Google Scholar]
- Durrant JD (1998). Contralateral suppression of optoacoustic emissions – delay of effect? J Commun Disord, 31(6), 485–8. [DOI] [PubMed] [Google Scholar]
- Elberling C, Don M (1987). Threshold characteristics of the human auditory brainstem response. J Acoust Soc Am, 81(1), 115–121. [DOI] [PubMed] [Google Scholar]
- Fayad JN, Linthicum FH Jr. (2006). Multichannel cochlear implants: relation to histopathology to performance. Laryngoscope, 116(8), 1310–20. [DOI] [PubMed] [Google Scholar]
- Fitzpatrick DC, Campbell AP, Campbell AT, et al. (2014). Round window electrocochleography just before cochlear implantation: Relationship to word recognition outcomes in adults. Otol Neurotol, 35, 64–71. [DOI] [PMC free article] [PubMed] [Google Scholar]
- Forgues M, Koehn HA, Dunnon AK, Pulver SH, Buchman CA, Adunka OF, Fitzpatrick DC (2014). Distinguishing hair cell from neural potentials recorded at the round window. J Neurophysiol, 111(3), 580–593. [DOI] [PMC free article] [PubMed] [Google Scholar]
- Formeister EJ, McClellan JH, Merwin WH III, et al. (2015). Intraoperative round window electrocochleography and speech perception outcomes in pediatric cochlear implant recipients. Ear Hear, 36, 249–260. [DOI] [PubMed] [Google Scholar]
- Gantz BJ, Hansen MR, Turner CW, et al. (2009). Hybrid 10 clinical trial: Preliminary results. Audiol Neurotol, 14(Suppl 1), 32–38. [DOI] [PMC free article] [PubMed] [Google Scholar]
- Gantz BJ, Dunn CC, Oleson J, et al. (2016). Multicenter clinical trial of the Nucleus Hybrid S8 cochlear implant: Final outcomes. Laryngoscope, 126, 962–973. [DOI] [PMC free article] [PubMed] [Google Scholar]
- Gantz BJ, Dunn CC, Oleson J, Hansen MR (2017). Acoustic plus electric speech processing: longterm results. Laryngoscope, EPub ahead of print, doi: 10.1002/lary.26669. [DOI] [PMC free article] [PubMed] [Google Scholar]
- Gfeller KE, Olszewski C, Turner C, et al. (2006). Music perception with cochlear implants and residual hearing. Audio Neurotol, 11(Suppl 1), 12–15. [DOI] [PubMed] [Google Scholar]
- Gifford RH, Dorman MF, Spahr AJ, et al. (2008). Hearing preservation surgery: Psychophysical estimates of cochlear damage in recipients of a short electrode array. J Acoust Soc Am, 124, 2164–2173. [DOI] [PMC free article] [PubMed] [Google Scholar]
- Gifford RH, Dorman MF, Skarzynski H, Lorens A, et al. (2013). Cochlear Implantation with Hearing Preservation Yields Significant Benefit for Speech Recognition in Complex Listening Environments. Ear Hear. 34(4):413–25. [DOI] [PMC free article] [PubMed] [Google Scholar]
- Gorga MP, Johnson PA, Kaminski JR, Beauchaine KL, Grner CA, Neely ST (2006). Using a combination of click- and tone burst-evoked auditory brainstem response measurements to estimate pure-tone thresholds. Ear Hear, 27, 60–74. [DOI] [PMC free article] [PubMed] [Google Scholar]
- Hoffman HJ, Dobie RA, Losonczy KG, et al. (2017). Declining prevalence of hearing loss in US adults aged 20 to 69 years. JAMA Otolaryngol Head Neck Surg, 143(3), 274–285. [DOI] [PMC free article] [PubMed] [Google Scholar]
- Johnson DH (1980). The relationship between spike rate and synchrony in responses of auditory-nerve fibers to single tones. J Acoust Soc Am, 68(4), 1115–1122. [DOI] [PubMed] [Google Scholar]
- Jurawitz MC, Büchner A, Harpel T, et al. (2014). Hearing preservation outcomes with different cochlear implant electrodes: Nucleus® Hybrid™-L24 and Nucleus Freedom™ CI422. Audiol Neurotol, 19, 293–309. [DOI] [PubMed] [Google Scholar]
- Kawano A, Seldon HL, Clark GM, Ramsden RT, Raine CH (1998). Intracochlear factors contributing to psychophysical percepts following cochlear implantation. Acta Otolaryngol, 118(3), 313–26. [DOI] [PubMed] [Google Scholar]
- Khan AM, Whiten DM, Nadol JB Jr., Eddington DK (2005a). Histopathology of human cochlear implants: correlation of psychophysical and anatomical measures. Hear Res, 205(1–2), 83–93. [DOI] [PubMed] [Google Scholar]
- Khan AM, Handzel O, Burgess BJ, Damian D, Eddington DK, Nadol JB Jr. (2005b). Is word recognition correlated with the number of surviving spiral ganglion cells and electrode insertion depth in human subjects with cochlear implants? Laryngoscope, 115(4), 672–7. [DOI] [PubMed] [Google Scholar]
- Kiang NY-S, Watanabe T, Thomas EC et al. (1965). Discharge patterns of single fibers in the cat’s auditory nerve. Cambridge: MIT Press. [Google Scholar]
- Kim JR, Abbas PJ, Brown CJ, Etler CP, O’Brien S, Kim LS (2010). The relationship between electrically evoked compound action potential and speech perception: a study in cochlear implant users with short electrode array. Otol Neurotol, 31(7), 1041–8. [DOI] [PMC free article] [PubMed] [Google Scholar]
- Koka K, Saoji AA, Litvak L (2017a). Electrocochleography in cochlear implant recipients with residual hearing: comparison with audiometric thresholds. Ear Hear, 38(3), e161–167. [DOI] [PubMed] [Google Scholar]
- Kopelovich JC, Reiss LA, Oleson JJ, et al. (2014). Risk factors for loss of ipsilateral residual hearing after Hybrid cochlear implantation. Otol Neurotol, 35, 1403–1408. [DOI] [PMC free article] [PubMed] [Google Scholar]
- Kopelovich JC, Reiss LA, Etler CP, et al. (2015). Hearing loss after activation of hearing preservation cochlear implants might be related to afferent cochlear innervation injury. Otol Neurotol, 36, 1035–1044. [DOI] [PMC free article] [PubMed] [Google Scholar]
- Kujawa SG, Liberman MC (2006). Acceleration of age-related hearing loss by early noise exposure: evidence of a misspent youth. J Neurosci, 26(7), 2115–23. [DOI] [PMC free article] [PubMed] [Google Scholar]
- Kujawa SG, Liberman MC (2009). Adding insult to injury: Cochlear nerve degeneration after “temporary” noise-induced hearing loss. J Neurosci, 29(45), 14077–85. [DOI] [PMC free article] [PubMed] [Google Scholar]
- Lenarz T, James C, Cuda D, O’Connor AF, et al. (2013). European multi-center study of the Nucleus Hybrid L24 cochlear implant. Int J Audiol, 52(12), 838–48. [DOI] [PubMed] [Google Scholar]
- Liberman MC, Mulroy MJ (1982). Acute and chronic effects of acoustic trauma: Cochlear pathology and auditory nerve pathophysiology. In: Hamernik RP, Henderson D, Salvi R, editors. New Perspectives on Noise-Induced Hearing Loss. pp. 105–136. [Google Scholar]
- Nadol JB Jr., Shiao JY, Burgess BJ, Ketten DR et al. (2001). Histopathology of cochlear implants in humans. Ann Otol Rhinol Laryngol, 110(9), 883–91. [DOI] [PubMed] [Google Scholar]
- O’Connell BP, Holder JT, Dwyer RT, Gifford RH et al. (2017). Intra- and postoperative electrocochleography may be predictive of final electrode position and postoperative hearing preservation. Front Neurosci, 11:291. doi: 10.3389/fnins.2017.00291. eCollection 2017. [DOI] [PMC free article] [PubMed] [Google Scholar]
- Patrick JF, Busby PA, Gibson PJ (2006). The development of the Nucleus Freedom cochlear implant system. Trends Amplif, 10(4), 175–200. [DOI] [PMC free article] [PubMed] [Google Scholar]
- Patuzzi RB, Yates GK, Johnstone BM (1989). Outer hair cell receptor current and sensorineural hearing loss. Hear Res, 42(1), 47–72. [DOI] [PubMed] [Google Scholar]
- Pillsbury III HC, Dillon MT, Buchman CA, Staecker H et al. (2018). Multicenter US clinical trial with an electric-acoustic stimulation (EAS) system in adults : final outcomes. Otol Neurotol, 39(3), 299–305. [DOI] [PMC free article] [PubMed] [Google Scholar]
- Podskarbi-Fayette R, Pilka A, Skarzynski H (2010). Electric stimulation complements functional residual hearing in partial deafness. Acta Otolaryngol, 130, 888–896. [DOI] [PubMed] [Google Scholar]
- Portmann M, Negrevergne M, Aran JM, Cazals Y (1983). Electrical stimulation of the ear: clinical applications. Ann Otol Rhinol Laryngol, 92(6 Pt 1), 621–2. [DOI] [PubMed] [Google Scholar]
- Robertson D (1983). Functional significance of dendritic swelling after loud sounds in the guinea pig cochlea. Hear Res, 9(3), 263–78. [DOI] [PubMed] [Google Scholar]
- Roland JT Jr., Gantz BJ, Waltzman SB; Multicenter Clinical Trial Group (2016). United States multicenter clinical trial of the cochlear Nucleus Hybrid implant system. Laryngoscope, 126, 175–181. [DOI] [PMC free article] [PubMed] [Google Scholar]
- Rose JE, Brugge JF, Anderson DJ, Hind JE (1967). Phase-locked response to low-frequency tones in single auditory nerve fibers of the squirrel monkey. J Neurophysiol, 30(4), 769–793. [DOI] [PubMed] [Google Scholar]
- Ruth RA, Lambert PR, Ferraro JA (1988). Electrocochleography: methods and clinical applications. Am J Otol, 9(Suppl), 1–11. [PubMed] [Google Scholar]
- Schoonhoven R, Fabius MA, Grote JJ (1995). Input/output curves to tone bursts and clicks in extratympanic and transtympanic electrocochleography. Ear Hear, 16(6), 619–30. [DOI] [PubMed] [Google Scholar]
- Scheperle RA, Tejani VD, Omtvedt JK et al. (2017). Delayed changes in auditory status in cochlear implant users with preserved acoustic hearing. Hear Res, 350, 45–57. [DOI] [PMC free article] [PubMed] [Google Scholar]
- Skarzynski H, Lorens A, Matusiak M, et al. (2014). Cochlear implantation with the nucleus slim straight electrode in subjects with residual low-frequency hearing. Ear Hear, 35, e33–e43. [DOI] [PubMed] [Google Scholar]
- Stapells DR (2000). Threshold estimation by the tone-evoked auditory brainstem response: a literature meta-anlysis. J Speech-Lang Path Audiol, 24(2), 74–82. [Google Scholar]
- Tanaka C, Nguyen-Huynh A, Loera K, et al. (2014). Factors associated with hearing loss in a normalhearing guinea pig model of Hybrid cochlear implants. Hear Res, 316, 82–93. [DOI] [PMC free article] [PubMed] [Google Scholar]
- Tlumak AI, Rubinsten E, Durrant JD (2007). Meta-analysis of variables that affect accuracy of threshold estimation via measurement of the auditory steady-state response (ASSR). Int J Audiol, 46, 692–710. [DOI] [PubMed] [Google Scholar]
- Turner CW, Gantz BJ, Vidal C, et al. (2004). Speech recognition in noise for cochlear implant listeners: Benefits of residual acoustic hearing. J Acousti Soc Am, 115, 1729–35. [DOI] [PubMed] [Google Scholar]
- Turner CW (2006). Hearing loss and the limits of amplification. Audiol Neurotol, 11(suppl 1), 2–5. [DOI] [PubMed] [Google Scholar]
- Turner CW, Gantz BJ, Reiss LA (2008). Integration of acoustic and electric hearing. J Rehabil Res Dev. 45(5):769–778. [DOI] [PubMed] [Google Scholar]
- Van Abel KM, Dunn CC, Sladen DP, et al. (2015). Hearing preservation among patients undergoing cochlear implantation. Otol Neurotol, 36, 416–421. [DOI] [PMC free article] [PubMed] [Google Scholar]
- Verpy E, Weil D, Leibovici M, Goodyear RJ, et al. (2008). Stereocilia-deficient mice reveal the origin of cochlear waveform distortions. Nature, 456(7219), 255–8. [DOI] [PMC free article] [PubMed] [Google Scholar]
- Zheng XY, Ding DL, McFadden SL, Henderson D (1997). Evidence that inner hair cells are the major source of cochlear summating potentials. Hear Res, 113(1–2), 76–88. [DOI] [PubMed] [Google Scholar]


