Abstract
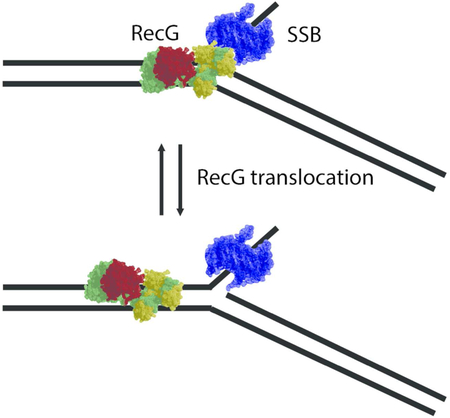
As a guardian of the bacterial genome, the RecG DNA helicase repairs DNA replication and rescues stalled replication. We applied atomic force microscopy (AFM) to directly visualize dynamics of RecG upon the interaction with replication fork substrates in the presence and absence of SSB using high-speed (HS) AFM. We directly visualized that RecG moves back and forth over dozens of base pairs in the presence of SSB. There is no RecG translocation in the absence of SSB. Computational modeling was performed to build models of E. coli RecG in a free state and in complex with the fork. The simulations revealed the formation of complexes of RecG with the fork and identified conformational transitions that may be responsible for RecG remodeling that can facilitate RecG translocation along the DNA duplex. Such complexes do not form with DNA duplex, which is in line with experimental data. Overall, our results provide mechanistic insights into the interaction modes of RecG with the replication fork, suggesting a novel role of RecG in the repair of stalled DNA replication forks.
Keywords: DNA replication; replication fork regression; RecG protein; SSB protein, AFM; time-lapse AFM; nanoscale dynamics; computational modeling
Graphical Abstract
Introduction
The fidelity of the replication machinery is fundamental for the successful completion of genomic duplication and the cell division process. The DNA replication machinery is very accurate; however, the orderly progression of genomic replication is challenged by roadblocks such as template damage, arrested polymerases, and other DNA-protein complexes that stall or collapse the replication fork 1-3. These roadblocks that impede the advancing replication fork need to be removed to allow the DNA synthesis process to resume. These lesions can be repaired by the homologous recombination machinery resulting in formation of Holliday junctions (HJ) 4. RecG helicase is a key player in the formation of HJ by moving the replication fork back (regress) in bacteria 5, 6. RecG specifically binds to the stalled replication fork and unwinds the daughter DNA duplex utilizing ATP hydrolysis to generate a HJ 7.
The crystal structure of T. maritima RecG in complex with a stalled DNA replication fork was obtained by Singleton et al. 8. The authors determined that RecG protein contains a multi-domain structure that allows it to accommodate all arms of the fork. Further modeling of T. maritima RecG revealed that its DNA unwinding activity is accomplished through structural transition within the helicase domain provided by ATP hydrolysis 9. The conformational transition of RecG facilitates unwinding of the daughter duplex by invasion of the wedge domain, with translocation occurring in a step-wise fashion with ATP hydrolysis at each step 10.
Other studies have revealed that the activity of RecG in the early stages of fork rescue is enhanced and controlled by SSB 5, 11-13. We recently showed that in the absence of ATP, E. coli RecG is capable of binding to the stalled replication fork and that interaction with SSB increases the efficiency of RecG loading onto the fork 14. Nanoscale analysis using AFM revealed that SSB-facilitated loading of RecG is a process in which SSB changes the binding mode of RecG. Based on these findings, we proposed that RecG interactions with SSB allow RecG ATP-independent translocation over the DNA duplex.
Here, we use time-lapse AFM to validate the proposed model and study the interaction of RecG with two different models of stalled replication forks by direct visualization of RecG translocation. We found that SSB facilitates RecG binding to the fork substrates and enables RecG to translocate over both DNA duplex substrates. We also used computational modeling to investigate the molecular mechanism of RecG-fork interactions, starting with building an all-atom model for E. coli RecG. The modeling revealed that electrostatic interactions are critical to establish interactions between RecG and the replication fork and identified conformational transitions within RecG responsible for these interactions.
Materials and Methods
Protein preparations.
RecG protein was purified as described previously 15. Briefly, the protein was eluted using a linear gradient (10–1000 mM NaCl) with RecG eluting between 250 and 360 mM NaCl on a 100 ml Q-Sepharose column equilibrated in buffer A [20 mM Tris-HCl (pH 8.5), 1 mM EDTA, 1 mM DTT, 10 mM NaCl]. The pooled fractions were then subjected to heparin FF and hydroxylapatite chromatography, as previously described (44). Pooled fractions from the hydroxylapatite column were dialyzed overnight into S buffer [10 mM KPO4 (pH 6.8), 1 mM DTT, 1 mM EDTA and 100 mM KCl]. The protein was applied to a 1 ml MonoS column and eluted using a linear KCl gradient (100–700 mM) with RecG eluting at 350 mM KCl. The fractions containing RecG were pooled and dialyzed overnight against storage buffer [20 mM Tris-HCl (pH 7.5), 1 mM EDTA, 1 mM DTT, 100 mM NaCl and 50% (v/v) glycerol]. The protein concentration was spectrophotometrically determined using an extinction coefficient of 49 500 M−s cm−c 16.
SSB protein was purified from strain K12DH1Dtrp, as described in 17. The concentration of purified SSB protein was determined at 280 nm using e = 30, 000 M-1 cm-1. The site size of SSB protein was determined to be 10 nucleotides per monomer by monitoring the quenching of the intrinsic fluorescence of SSB that occurs on binding to ssDNA, as described earlier 18.
Preparation of fork DNA substrates.
The replication fork DNA substrate was assembled from two duplexes and the core fork segment, similar to our previous methodology 14. Briefly, a 480 bp template DNA (T1) was obtained by PCR reaction using pUC19 with forward primer p1 (GCGATTAAGTTGGGTAAC) and reverse primer p2 (GTTCTTTCCTGCGTTATC) and purified through phenol and ethanol extraction. Template T1 was then digested by BspQI to generate two DNA duplexes, and the 356 bp DNA fragment (D1) was purified by gel purification. Similarly, a 403 bp template DNA (T2) was obtained from the same PCR product with primer p3 (GAGTTCTTGAAGTGGTGGCC) and primer p4 (GGTAACTGTCAGACCAAGTTTACTC). T2 was then digested with DdeI to generate two duplexes, and the 224 bp DNA (D2) was purified by gel purification. The core fork was annealed from four different oligos. To make F4 core, O30 (TCATCTGCGTATTGGGCGCTCTTCCGCTTCCTATCT), O31 (TCGTTCGGCTGCGGCGAGCGGTATCAGCTCACTCATA), O32 (GCTTATGAGTGAGCTGATACCGCTCGCCGCAGCCGAACGACCTTGCGCAGCGAGTC AGTGAGATAGGAAGCGGAAGAGCGCCCAATACGCAGA), and O33 (CACTGACTCGCTGCGCAAGGCTAACAGCATCACACACATTAACAATTCTA ACATCTGGGTTTTCATTCTTTGGGTTTCACTTTCTCCAC) were mixed in equimolar ratios and then annealed by decreasing the temperature from 95°C to room temperature; to make F5 core, instead of O33, another oligonucleotide O34 (CTAACAGCATCACACACATTAACAATTCTAACATCTGGGTTTTCATTCTTTGGGTTTC ACTTTCTCCACCACTGACTCGCTGCGCAAGG) was used to anneal with O30, O31, and O32. The core fork (F4 or F5) was then ligated with D1 and D2 in equimolar ratios to generate the final fork substrate. The ligation result was then purified by gel purification. All oligonucleotides were obtained from IDT (Integrated DNA Technologies, Inc. Coralville, Iowa, USA).
Preparation of DNA-protein complexes.
RecG-DNA complexes.
DNA (final concentration 2.25 nM) was mixed with RecG in a molar ratio of 1:4 and incubated in 10 μl binding buffer [10mM Tris-HCl (pH 7.5), 50 mM NaCl, 5 mM MgCl2, 1 mM DTT] for 30 min as before 14.
SSB-RecG-DNA complexes.
DNA was mixed with the SSB tetramer in a molar ratio of 1:2, and incubated in binding buffer for 10 min. RecG (4:1 to DNA) was added into the mixture and incubated for an additional 30 min. The final molar ratio of DNA:SSB:RecG was 1:2:4.
Dry sample preparation and AFM imaging.
APS functionalized mica was used as the AFM substrate for all experiments. Briefly, freshly cleaved mica was incubated in a 167 μM aqueous solution of 1-(3-aminopropyl)silatrane (APS) for 30 min and rinsed thoroughly, as described in 19, 20. Five microliters of the sample were deposited onto the APS mica for 2 min, rinsed with deionized water, and dried with a gentle Argon gas flow. Images were acquired using tapping mode in air on a MultiMode 8, Nanoscope V system (Bruker, Santa Barbara, CA) using TESPA probes (320 kHz nominal frequency and a 42 N/m spring constant) from the same vendor.
Liquid sample preparation and HS-AFM imaging.
The sample (2.5 μl) was deposited onto the APS mica, attached to the HS-AFM stage, and incubated for 2 min. The sample was then rinsed with 20 μl binding buffer. Time-lapse images were acquired using a commercial HS-AFM instrument (RIBM Co. Ltd., Tsukuba, Japan) using custom-built, high-aspect ratio, high-frequency carbon probes (based on BL-AC10DS, Olympus Corp., Tokyo, Japan). The image size was usually set to 300×300 nm, and the scan rate was 600 ms/frame.
Data analysis.
The dry sample AFM images were analyzed using the FemtoScan Online software package (Advanced Technologies Center, Moscow, Russia), which enables precise tracing of the DNA molecules. The contour lengths from the DNA end to the protein position and the total DNA lengths were measured for the complexes. The positions of each protein relative to the end of the short arm on the DNA substrate was measured. The yield of complexes was calculated from the ratio of protein-DNA complexes to the total number of DNA molecules. The HS-AFM images were flattened by FalconViewer (kindly provided by T. Ando) and exported as JPG images that were then analyzed by FemtoScan Online. The SSB and RecG position were then measured as described above.
Movies were made from the flattened HS-AFM data file using the Template Matching plugin 21 in ImageJ software 22. Briefly, the HS-AFM files were imported as 16-bit little-endian raw data, the color set to “Blue Orange icb”, and a band-pass filter applied to smooth the images. Complexes of interest were then selected and their motion, within the frame, removed using the plugin, after which the movies were exported in AVI format.
3D model for E. coli RecG.
The sequence of wild-type E. coli RecG was used as the initial target for protein structure modeling, using a threading approach employing the I-TASSER v.4.4 software package 23 with the March 16th 2016 PDB database 24. In this approach, the protein sequence is used to obtain structural templates from a non-redundant structure library, and the sequence is sectioned into aligned and non-aligned regions. The full-length protein models are then constructed by reassembling the continuously aligned fragments, while non-aligned regions are built from scratch using ab initio methods. The final models are assembled using replica-exchange Monte Carlo simulations with two rounds of refinement. The best refined model was then subjected to 20 ns all-atom NPT molecular dynamics (MD) simulations in explicit water to further refine and relax the protein structure by using the Amber14 software package 25. For the simulation, the Amber14SB 26 and TIP3P 27 force field and water model were used, respectively. Additionally, NaCl counter ions were used to neutralize the charge of the system and keep the salt concentration at 150 mM. Temperature and pressure were kept at 300 K and 1 bar, respectively. The cut-off distance was set to 10 Å, and electrostatics were treated using Ewald summation. All subsequent simulations were conducted using this refined structure of RecG.
To characterize the interaction of RecG with the replication fork, a DNA substrate made by modifying the replication fork from the crystal structure 8 was placed above the RecG structure and simulated using an NPT MD simulation for 150 ns with the above parameters. DNA was parameterized using the OL15 force field 28. The fork substrate sequence was: B, 5'-CGCAGCGAGTCAGTGAGATACAGCTCCATGATATGC; C, 3'-GCGTCGCTCAGTCACTCTATGTCGAGGTACGCTCGTGACG; D, 5'-GAGCACTGC. To determine the effect of ssDNA on complex stability, the final conformation of the RecG-fork simulation was used. A nick was introduced on the ssDNA arm of the fork (B), creating a new 9 nt ssDNA strand. This system was then simulated for 90 ns. Similarly, the interaction between RecG and dsDNA was simulated by placing a 25 bp duplex in B form above the RecG protein, and simulating for 150 ns.
Electrostatic potential maps of the RecG protein were calculated using APBS 29 and PyMOL 30. The potential maps for T. maritima RecG and E. coli RecG were generated. Quantitative analysis was done using the GROMACS 2016 suite of programs 31, and graphics were generated using PyMOL and VMD software 32.
Results
Fork DNA constructs
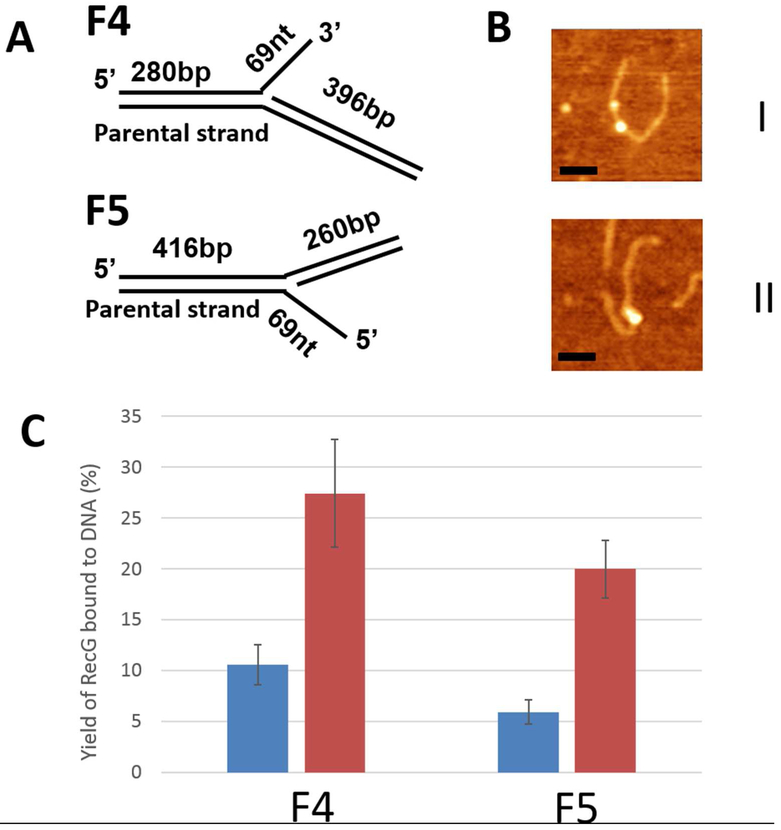
Our constructs mimicking stalled DNA replication forks are schematically shown in Fig. 1A. Construct F4 represents a stalled replication fork with a gap in the nascent leading strand, and DNA duplex regions with unequal lengths (280 bp and 396 bp) that allow us to distinguish between parental and daughter segments of the fork in AFM images 14. This type of replication fork is similar to the substrate used in the crystallographic studies of T. maritima RecG-DNA complexes 8. F5 DNA substrate mimics a stalled replication fork with a gap in the nascent lagging strand and with two DNA duplex regions of 260 and 416 bp.
Figure 1.
The interaction of RecG with stalled replication fork substrates. (A) Replication fork substrate F4 consists of two DNA duplexes (280 bp and 396 bp) with a ssDNA arm of 69 nt. The F5 construct has duplex segments of 260 bp and 416 bp, and a 69 nt 5′ ssDNA. (B) Typical AFM images of SSB-RecG complexes with F4 (I) and F5 (II). Bars are 50 nm. (C) Yields of SSB-RecG complexes with replication fork substrates calculated in the absence (blue bars) and presence of SSB (red bars).
SSB facilitates RecG binding to the fork constructs
The efficiency of RecG binding to both fork constructs was studied using AFM. RecG was complexed with the DNA substrates at a protein-to-DNA ratio of 4:1, and samples with both substrates were prepared in parallel and imaged with AFM (Fig. S1). In the recorded images, RecG appears as a globular feature located on the DNA fork and is highlighted with arrows. The specificity of RecG binding to the fork was verified by measuring the length of the DNA flanks (Fig. S2). The yield of RecG-DNA complexes was relatively low, 10.6±1.9 % and 5.9±1.2 % for F4 and F5 substrates, respectively. Yields for RecG-DNA complexes were generated from 3 independent experiments and the data are assembled in Table S1. The total number of complexes was 67 and 54 for F4 and F5, respectively. A similar low yield, 9.7 %, was previously observed for F4 substrate 14. The two-fold higher binding efficiency for F4 is consistent with this being the preferred fork for RecG 11, 12, 15, 33.
We then compared the effect of SSB on the efficiency of RecG binding to each replication fork substrate using the protocol described in the methods section. The experiments for both substrates were performed in parallel. Representative AFM images for both complexes are shown in Fig. 1B, in which plates I and II correspond to complexes with constructs F4 and F5, respectively. The major feature of these images is the appearance of complexes with two globular features. According to control experiments with SSB only, brighter features correspond to the SSB tetramer and smaller features to RecG, which is in line with our previous publication 14. The yields of protein-DNA complexes for both constructs were calculated and are shown in Fig. 1C. In the presence of SSB, the yield of RecG-DNA complexes increased to 27.4 ± 5.3% and 19.9 ± 2.9% for the F4 and F5 constructs, respectively. This suggests that SSB facilitates RecG binding to both fork constructs, which also agrees with our previous data obtained for the F4 substrate. Even though SSB increases the loading efficiency of RecG onto fork F5, F4 is still the preferred substrate.
We then measured the positions of SSB and RecG proteins on each substrate. The position of each protein was measured from the same end of the DNA molecule to the center of each protein. Given the asymmetry of the fork constructs, positions of proteins relative to the fork and on both flanks of the constructs can be determined.
First, the position of SSB was determined. The data are shown as histograms in Fig. S3A and B for constructs F4 and F5, respectively. Similar measurements for control experiments with only SSB-DNA complexes are shown in Figs. S1 and S2. The histograms were fitted with Gaussian functions, and the values corresponding to the maxima of these distributions are 290 ± 16 bp and 245 ± 25 bp for the F4 and F5 substrates, respectively. Both values correspond very well to the position of the fork.
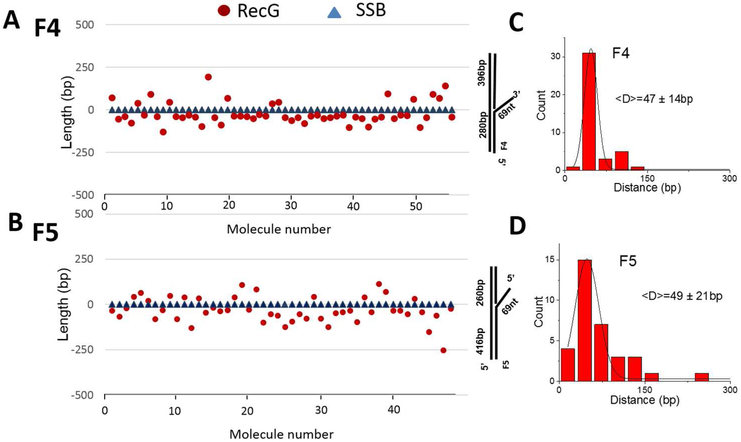
Next, we constructed position graphs of RecG relative to SSB in the SSB-RecG-DNA complexes. The resulting graphs for F4 and F5 substrates are shown in Figs. 2A and B, respectively. SSB and RecG positions were measured relative to the same DNA end, usually the end of the parental strand. Then the position of SSB was set to 0; when RecG translocates to the parental strand, the position of RecG has a negative value (below SSB in the graph). Otherwise, the position of RecG has a positive value (above SSB in the graph). The schematic of DNA to the right of the graphs shows the duplex DNA positions. These graphs show that RecG is not bound exactly at the fork but is instead located some distance away from the fork and has a clear preference for one of the flanking duplex regions. For construct F4, RecG is preferentially loaded onto a location on the short flank 75% of the cases, while for construct F5, RecG is preferentially loaded onto the long flank 70% of the cases. For each fork substrate, the preferred duplex region corresponds to the parental strand of the replication fork. Figures 2C and D show the statistical analysis of the RecG translocation distance to the parental strand DNA of F4 and F5 substrates, respectively. The translocation distance to the daughter strand DNA of F4 was also compared to the translocation to parental DNA strand (Fig. S4). The results show that the distance RecG translocates on the parental and daughter strand is similar. The mean distance values between the two proteins are 47±14 bp and 49±21 bp for F4 and F5 substrates, respectively. These findings suggest that the loading efficiency of RecG is enhanced in the presence of SSB, and the helicase does not remain at the fork after loading. Instead, it slides on the DNA with a preference for the parental duplex arm.
Figure 2.
AFM analysis of the RecG (circle) and SSB (triangle) location on the DNA substrate. (A) and (B) depict protein positions on the F4 and F5 DNA substrates, respectively. In the graphs, the position of SSB is set to 0. When RecG appeared on the parental strand, the position of RecG has a negative value (below SSB). Otherwise, the position of RecG is positive (above SSB). The schematic to the right of the graphs shows the duplex DNA position. The X-axis denotes the number of the complex. (C) and (D) show histograms for the distributions of distances between RecG and SSB on F4 and F5 constructs, respectively. Histograms were approximated with Gaussians and the values corresponding to maxima on these distributions are shown in the histograms.
Direct observation of RecG translocation on DNA
It is conceivable that the binding site positions observed above are not due to sliding but instead reflect RecG binding to dsDNA regions of the fork, with the fork itself being occluded by SSB. To determine whether RecG is sliding, as proposed, we performed time-lapse AFM experiments using a HS-AFM instrument that allows us to visualize dynamics of protein-DNA complexes with sub-second temporal resolution 34. The complexes were prepared in a similar fashion to the above AFM experiments.
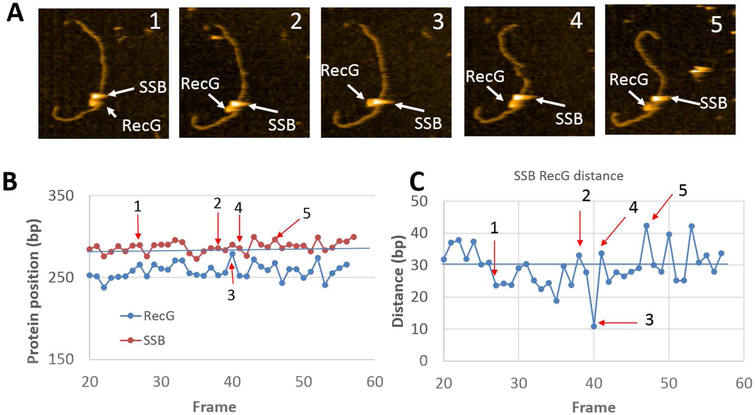
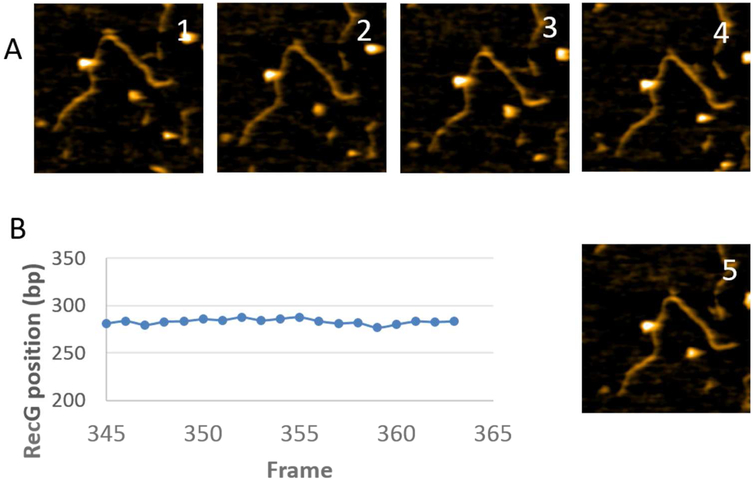
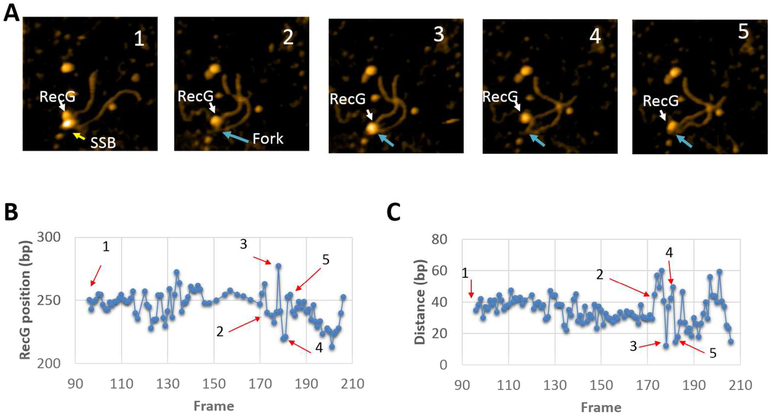
Selected frames from the protein-DNA complex with F4 are shown in Fig. 3A, with the full set in movie S1 (out of four similar videos). The larger particle corresponds to SSB while the smaller one is RecG. In plate 1, both RecG and SSB are bound to the DNA and both proteins are clearly separated from each other. The distance between them becomes smaller on plate 2, and both proteins occupy essentially the same position on plate 3. The proteins then move apart, as illustrated in plates 4 and 5. To characterize protein dynamics, positions of RecG and SSB were measured for each frame and the data were plotted in Fig. 3B; arrows 1 through 5 correspond to the plates of the images above. The graph demonstrates that the position of SSB fluctuates around 287 ± 6 bp, corresponding to the position of the fork. In contrast, the RecG position fluctuates more widely around 258 ± 9 bp from the closest end of the construct, which is on the parental duplex arm. When the SSB to RecG distances are compared over the same set of data, the inter-protein gap varies over ~40 bp, with the largest distance between the proteins found on plate 5 (Fig. 3C). In the graph (Fig. 3B), there is a correlation between the position of SSB and RecG. This can be explained by the fact that during the observation DNA flanks move while the proteins remain at their positions. The DNA dynamics is primarily due to the elevated mobility caused by transient dissociation from the surface, making the DNA segment appear shorter, which translates to a correlative displacement of positions of SSB and RecG. Control experiments with RecG alone did not reveal such dynamics. Fig. 4 and movie S2 (representative of four similar videos) demonstrate that RecG stays at a distance of 283 ± 3 bp from the DNA end in the absence of SSB, indicating interaction with the fork.
Figure 3.
Time-lapse experiments with SSB-RecG complexes formed on the F4 substrate. (A) Five frames selected from movie S1, demonstrating the dynamics of RecG over the parental strand. The arrows show positions of SSB and RecG. The images size is 200×200nm. (B) Distances of SSB (red curve) and RecG (blue curve) measured from the closest end of DNA over time. (C) Distance of RecG relative to SSB over time. The numbered arrows correspond to the location of AFM frames from (A).
Figure 4.
The interaction of RecG with F4 DNA fork substrates. (A) A few frames of the time-lapse HS-AFM data from movie S2. The image size is 200×200nm. (B) Plot of the time-dependent position of RecG relative to closest end of the DNA substrate.
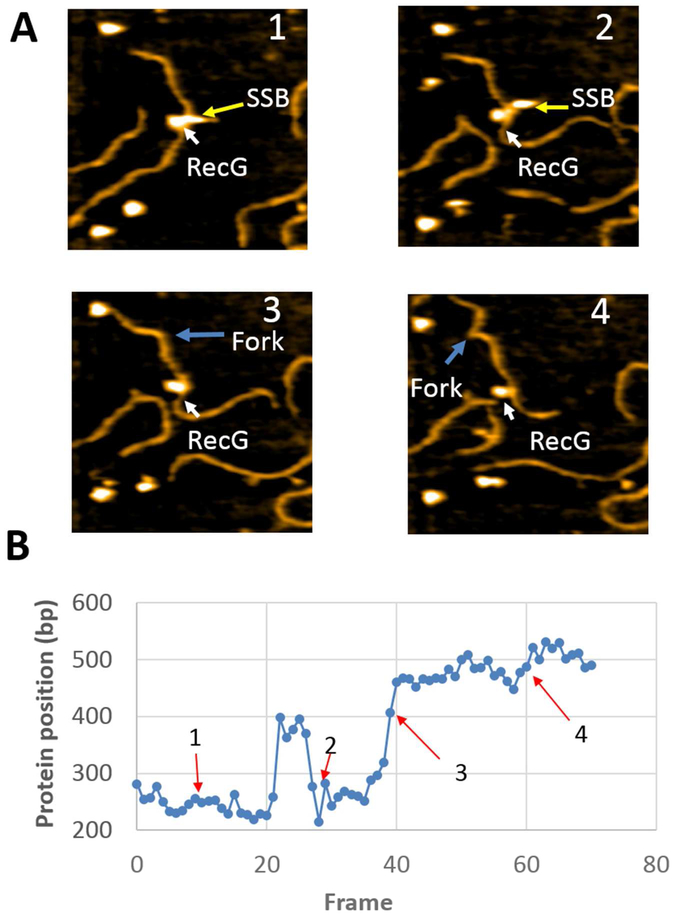
According to Fig. 3, SSB remains bound to the fork throughout the experiment. To determine if SSB binding to the fork affects translocation of RecG, an analysis of another complex in which SSB dissociates was carried out. Initially (Fig. 5A, frame 1), both proteins are bound to the fork. The next frame (plate 2) demonstrates that SSB dissociates, leaving only RecG bound. A kink in the DNA, indicated with an arrow, appears after SSB dissociation and corresponds to the fork position in the substrate. Interestingly, the kink remains during the entire observation period. In subsequent frames, RecG approaches the kink (plate 3) and moves away (plate 4). Continued sliding back and forth is observed for a period of over 100 frames, corresponding to approximately 60 seconds. Cross-section analysis of the complex shows that RecG remains bound to DNA during the translocation (Fig. S5). Figure 5 graphically illustrates RecG sliding over the DNA, demonstrating that SSB binding is not necessary for RecG translocation. The time-dependent fluctuation of the distance between RecG to the fork is shown in Figure 5C. In the majority of cases, RecG moves between ~20 and ~40 bp, although translocations over larger distances are observed and these are marked with arrows. The full dataset was assembled as movie S3 and can be seen in the supplement.
Figure 5.
Time-lapse experiment with SSB-RecG complexes formed on the F4 substrate, illustrating RecG dynamics after dissociation of SSB. (A) Selected frames from movie S2, demonstrating the dynamics of RecG over the parental strand. The arrows show the positions of SSB and RecG. After SSB dissociation, the positions of the fork are indicated with yellow arrows. The images size is 200×200nm. (B) The dependence of the RecG position relative to the fork over time. The arrows correspond to the frames as they appear in panel (A). (C) The distance of RecG relative to the fork over time. The arrows correspond to the frames as they appear in panel (A).
To characterize RecG translocation quantitatively, we measured one dimensional diffusion coefficients for RecG translocate using approach described in our earlier paper 35. The RecG displacement for movies S1 and S3 are shown in Fig. S6 (A, B) and squared displacements of the RecG translocation events are plotted against times as shown in Fig. S6 (C, D), respectively. The diffusion coefficients for each translocation segment were calculated, the values are shown in Table S2. The diffusion coefficients for each of the datasets are in the same range and similar with each other (the mean values are 19.91 ± 5.66 nm2/s and 19.92 ± 11.64 nm2/s), suggesting that the diffusion speed of RecG are not influenced by the presence SSB once the translocation has been started.
Similar time-lapse experiments were performed with complexes assembled on the F5 construct that has a different polarity of the ssDNA arm of the fork. The dataset was assembled as movie S4 and is shown in the supplement. Five frames from this movie, reflecting key points of RecG dynamics, are shown in Fig. 6A. Initially, RecG is bound close to the DNA fork (plate 1). Then RecG moves over a large distance (~150 bp) along the long duplex arm and returns back to SSB (plate 2). SSB dissociates, but RecG continues translocation along the same arm of the fork (plates 3 and 4). Graphically, RecG dynamics is plotted in Fig 6B. RecG moves over the long duplex arm of the fork construct between frames 20 and 22, stays at the same position between frames 23 and 26, and moves back between frames 27 and 28. At frame 30, SSB dissociates from the fork, but RecG continues translocation over the same arm. It reaches a distance as large as ~200 bp along the substrate at frame 40 and jiggles around this position until the end of observation. Translocation of RecG over the long arm of the F5 construct, which is a parental strand for this design, agrees with the data obtained for the dried sample and the statistical analysis (Fig. 6B).
Figure 6.
Time-lapse experiment with SSB-RecG complexes formed on the F5 substrate, illustrating RecG dynamics. (A) Selected frames from the movie S4, demonstrating the dynamics of RecG over the parental strand. The positions of SSB or the fork are indicated with yellow arrows. The white arrows show the position of RecG. The images size is 250×250nm. (B) Dependence of the RecG position relative to the fork over time. The arrows correspond to the frames as they appear in panel (A).
Computational modeling
To understand the details of RecG-DNA complexes, we performed computational analysis. First, we built an atomic structure of RecG alone using computational modeling approaches and available structural data. Crystallographic data is only available for complexes of a stalled replication fork with the RecG of T. maritima, which is ~90 residues larger than E. coli RecG 9. The model for RecG was built using iterative threading assembly as implemented in the I-TASSER suite 23. The resulting model is shown in Fig. S7A. Our computational model for E. coli RecG shows a large degree of similarity to T. maritima RecG; with one notable difference in the wedge domain, where E. coli RecG has fewer residues and is therefore lacking the N-terminal helix bundle of T. maritima RecG (Fig. S7B). Similar to T. maritima RecG, E. coli RecG is spatially divided into the helicase and wedge domains. The helicase domain consists of two sub-domains and is connected to the wedge domain via a linker region consisting of primarily α-helices. The secondary structure of our RecG model and the crystal structure of T. maritima RecG are also in good agreement; both the helicase domain and the wedge domain contain similar folds and secondary structure elements (Fig. S8). The secondary structure map for our RecG model and the crystal structure of T. maritima RecG are presented in Fig. S8.
We examined the role of electrostatics in the formation of protein-DNA complexes by determining the electrostatic potential of the protein (Fig. S9). This analysis shows that positively charged regions in RecG are found on the front side of the wedge domain while the rest of the domain is predominantly negatively charged (Fig. S9A, column IV). This suggests that the ridge on the wedge domain is a candidate for interactions with DNA.
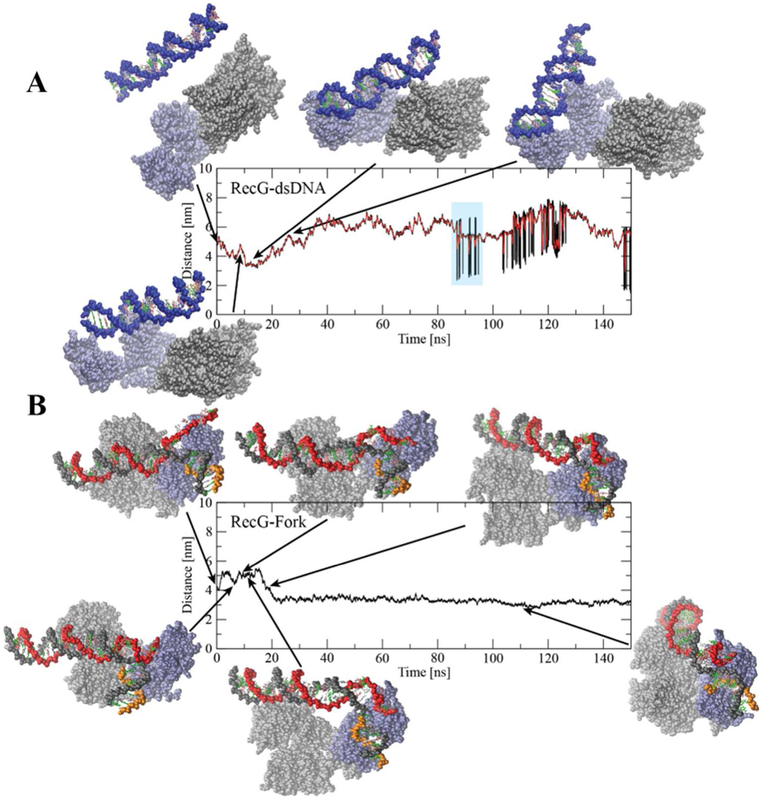
Next, we placed a 25 bp DNA duplex away from the RecG and followed the dynamics of the complex assembly over time, using all-atom molecular dynamics simulation. A few frames obtained during the 150 ns simulation are shown in Fig. 7A. These snapshots demonstrate that DNA moves around the protein without forming a stable complex. Consistent with this, analysis of the time-dependent distance between the Center-of-Mass (COM) of RecG and DNA duplex shows that the COM value fluctuates in a broad range with the DNA generally remaining far away from the protein (Fig. 7A).
Figure 7.
Interaction of E. coli RecG with the DNA substrates characterized using MD simulations. (A) Results for interaction between RecG and 25 bp dsDNA showing COM distances between RecG and the DNA substrate versus time. Initially the dsDNA was placed parallel to RecG at a large distance. (B) COM distance between RecG and a stalled replication fork substrate from 150 ns MD simulation; key events are highlighted with a snapshot. RecG is presented as van der Waal spheres with the wedge domain colored in light blue and the helicase domain in grey. Each DNA strand is shown in a separate color to indicate the chain, and each base is given its own color.
We then performed similar simulations using a model fork substrate (Fig. 7B). The COM values between RecG and the fork substrate decrease after 6 ns, indicating that the distance between DNA and RecG decreases as well. According to Fig. 7B, during this short period (6.2 ns), ssDNA of the fork binds to the wedge domain of RecG. This binding is accompanied by a structural change in the wedge domain leading to opening of a cleft that binds the lagging strand of the DNA duplex arm (9.4 ns; Fig. 7B). The COM distance then increases, corresponding to the reorientation of the parental DNA duplex to interact with the helicase domain (18 ns, Fig. 7B). Following the reorientation of the parental duplex (21 ns, Fig. 7B), the COM distance remains constant at about 3.2 nm for the remainder of the simulation, consistent with the stable complex formation. Thus, the replication fork is capable of making a stable complex with RecG, whereas a short linear DNA duplex does not, consistent with experimental findings 14.
To determine the effect of ssDNA bound to the wedge domain on the stability of the RecG-fork complex, we introduced a nick in the ssDNA arm of the fork. The simulation uses the last frame from the previous 150 ns RecG-fork simulation as a starting structure (Fig. S10). The DNA duplex remains stably bound to RecG, partly due to the interaction of the nascent daughter strand with the wedge domain and the interaction of the parental duplex with the helicase domain. Throughout the 90 ns simulation, very little structural and conformational change is observed for either RecG or the DNA substrate; in fact, apart from thermal motion, no major rearrangement is observed. These results suggest that for dsDNA translocation to occur, RecG must undergo structural reorganization after being loaded (either by SSB or by direct fork binding) onto the DNA.
Discussion
The HS-AFM data demonstrate directly that RecG is capable of translocating over the duplex DNA when it assembles on the DNA fork in the presence of SSB protein. This novel property of RecG was hypothesized in our previous work based on the AFM analysis of dried samples of F4-RecG-SSB complexes 14, but here RecG translocation was directly visualized using HS-AFM. We show that RecG translocation does not depend on the polarity of the ssDNA arm of the fork. Translocation of RecG was observed in the models of the stalled replication fork with a gap in the nascent leading strand (construct F4, Figs. 3 and 5; movies S1 and S3) and a replication fork with a gap in the nascent lagging strand (construct F5, Fig. 5; movie S4). The presence of SSB is critical because no RecG mobility was observed in the complex of RecG assembled on the fork in the absence of SSB (Fig. S5). However, after RecG loading on the fork, SSB presence is not essential for RecG translocation. During translocation, RecG can move far from the fork position where SSB is located, reaching distances over several dozens of base pairs (Figs. 3B and 5B) for construct F4. Interestingly, RecG can move over ~250 bp for construct F5 (Fig. 6B). Importantly, dissociation of SSB from the fork does not change the translocation ability of RecG. As seen in Fig. 5, the range of RecG translocation is similar after dissociation of SSB to the range observed in the experiments during which SSB remained bound to the fork (Fig. 3). Therefore, we hypothesize that SSB is required only for the assembly of RecG on the fork. According to our previous paper 14, 10 residues at the C-terminal of SSB play an important role in the interaction of SSB and RecG at the fork.
Two major factors should be taken into account to characterize initial SSB-RecG interactions. First, RecG alone does not have affinity to the DNA duplex 14. Second, RecG is not motile during interaction with the fork in the absence of SSB, as illustrated by the time-lapse experiment in Fig. 4 in which no mobility of RecG is detected. This data is consistent with our previous findings in which AFM data of dried samples were analyzed 14. Thus, we assume that interaction of RecG with SSB is transient and leads to rearrangement of RecG on the fork, allowing the protein to slide over the duplex. Interestingly, during translocation when RecG approaches the fork and the positions of SSB and RecG coincide (Fig. 3A, frame 3), no interaction between the proteins is observed as RecG is seen moving back from the fork at the same rate. Another important observation is that RecG translocation is asymmetric. The protein moves over the parental type DNA duplex, corresponding to the short arm for the F4 construct (Figs. 3 and 5) and the long arm for the F5 construct (Fig. 6). These time-lapse data agree with the statistical analysis of the AFM images of dried samples (Fig. 2).
Computational modeling shed some light on the molecular mechanism of RecG-fork interactions. Regardless of a favorable electrostatic potential for DNA binding on the protein surface, linear duplex DNA does not bind RecG (Fig. 7A). While electrostatic interactions bring the duplex to RecG, they are not sufficient to assemble a stable complex. When a fork substrate is present, the initial attraction is also electrostatic in nature. Once the fork is close, the ssDNA arm of the fork firmly binds to the wedge domain and anchors the entire fork substrate near the RecG surface to facilitate additional interactions with the duplex regions. These interactions are accompanied by a structural change, in which a groove in the wedge domain opens to accommodate the nascent lagging DNA strand. At the same time, the parental duplex is reoriented to interact with the positively charged regions of the helicase domain. Interestingly, after the assembly of the complex, the ssDNA arm is no longer needed for complex stability. This is supported by the data in Fig. S10. In this figure, ssDNA within the RecG-DNA complex was cleaved and the dynamics of the complex were simulated. Throughout the simulation, no major changes were observed in the conformation of the complex, nor in the structures of the protein and DNA. The complex remained stable due to the interaction between parental DNA and the helicase domain, as well as the daughter strand and the wedge domain. These results suggest that binding of ssDNA to SSB releases the hook of RecG to the fork, allowing the protein to translocate over the duplex. However, we cannot exclude additional effects of SSB on the RecG structure that may further stabilize the complex with the DNA duplex arms and provide the selectivity of the parental arm over the daughter arm. The assumption regarding the interaction of RecG and SSB is supported by our previous findings 14 that identified that the C-terminal segment of SSB (10 residues) plays a critical role in RecG loading onto the fork. Although RecG is capable of spontaneous sliding over the DNA duplex, this process can be impeded if there are defects in the DNA helix. We hypothesize that RecG can stop at such defects, thereby sending a signal to other components of the repair machinery. This quality control mechanism to ensure accurate genome duplication may be another function of RecG, and this hypothesis will be tested in our future studies.
In conclusion, we discovered a novel property of RecG that allows the protein to slide ahead of the replication fork. This process is a thermally driven diffusion, as no ATP is required for this mobility of RecG, and RecG is capable of sliding over dozens of base pairs. The process happens on the dozens of seconds time scale; however, we need to take into consideration inevitable interaction of RecG and DNA substrate with the surface that can contribute to the rate of movement of RecG. In the cell, only a few copies of RecG are present, so the rapid recruitment of RecG to the replication fork when it stalls is a critical step 36. Our finding eliminates this problem. As shown previously, recruitment may occur as an SSB-RecG complex, or via RecG loading onto SSB bound at the fork, or via transfer within the replisome to the stalled fork 14, 15, 37, 38. Each loading mechanism serves to bring the helicase into close proximity with duplex DNA, which results in RecG remodeling. When loading is ssDNA-mediated, the helicase remains bound at the fork and is primed to drive fork regression. When loading is SSB-mediated, the binding mode of RecG to the replication fork is changed, which facilitates conformational changes in RecG, after which RecG slides and clears the DNA ahead of the fork of bound obstacles prior to the onset of regression.
Supplementary Material
Acknowledgments
Funding
The work was supported by the National Institutes of Health (R01 GM100156 to YLL and PRB, R01 GM096039, R01GM118006 to YLL) and the National Science Foundation (MCB 1515346). MH was partially supported by the Bukey Memorial Fellowship. Computational modeling was performed using computational facilities of the Holland Computing Center at the University of Nebraska (supported by the Nebraska Research Initiative) and the San Diego Supercomputing Center at the University of California San Diego through the Extreme Science and Engineering Discovery Environment (XSEDE; supported by National Science Foundation [ACI-1053575 for XSEDE]).
Footnotes
Completing financial interests
The authors declare no competing financial interests.
References:
- [1].Bhattacharyya B, George NP, Thurmes TM, Zhou R, Jani N, Wessel SR, Sandler SJ, Ha T, and Keck JL (2014) Structural mechanisms of PriA-mediated DNA replication restart, Proc Natl Acad Sci U S A 111, 1373–1378. [DOI] [PMC free article] [PubMed] [Google Scholar]
- [2].Cox MM (2001) Recombinational DNA repair of damaged replication forks in Escherichia coli: questions, Annu Rev Genet 35, 53–82. [DOI] [PubMed] [Google Scholar]
- [3].Cox MM, Goodman MF, Kreuzer KN, Sherratt DJ, Sandler SJ, and Marians KJ (2000) The importance of repairing stalled replication forks, Nature 404, 37–41. [DOI] [PubMed] [Google Scholar]
- [4].Sung P, and Klein H (2006) Mechanism of homologous recombination: mediators and helicases take on regulatory functions, Nat Rev Mol Cell Biol 7, 739–750. [DOI] [PubMed] [Google Scholar]
- [5].Buss JA, Kimura Y, and Bianco PR (2008) RecG interacts directly with SSB: implications for stalled replication fork regression, Nucleic Acids Res 36, 7029–7042. [DOI] [PMC free article] [PubMed] [Google Scholar]
- [6].Manosas M, Perumal SK, Bianco PR, Ritort F, Benkovic SJ, and Croquette V (2013) RecG and UvsW catalyse robust DNA rewinding critical for stalled DNA replication fork rescue, Nat Commun 4, 2368. [DOI] [PMC free article] [PubMed] [Google Scholar]
- [7].McGlynn P, and Lloyd RG (2001) Rescue of stalled replication forks by RecG: simultaneous translocation on the leading and lagging strand templates supports an active DNA unwinding model of fork reversal and Holliday junction formation, Proc Natl Acad Sci U S A 98, 8227–8234. [DOI] [PMC free article] [PubMed] [Google Scholar]
- [8].Singleton MR, Scaife S, and Wigley DB (2001) Structural analysis of DNA replication fork reversal by RecG, Cell 107, 79–89. [DOI] [PubMed] [Google Scholar]
- [9].Mahdi AA, Briggs GS, Sharples GJ, Wen Q, and Lloyd RG (2003) A model for dsDNA translocation revealed by a structural motif common to RecG and Mfd proteins, Embo j 22, 724–734. [DOI] [PMC free article] [PubMed] [Google Scholar]
- [10].Martinez-Senac MM, and Webb MR (2005) Mechanism of translocation and kinetics of DNA unwinding by the helicase RecG, Biochemistry 44, 16967–16976. [DOI] [PubMed] [Google Scholar]
- [11].Abd Wahab S, Choi M, and Bianco PR (2013) Characterization of the ATPase activity of RecG and RuvAB proteins on model fork structures reveals insight into stalled DNA replication fork repair, The Journal of biological chemistry 288, 26397–26409. [DOI] [PMC free article] [PubMed] [Google Scholar]
- [12].Slocum SL, Buss JA, Kimura Y, and Bianco PR (2007) Characterization of the ATPase activity of the Escherichia coli RecG protein reveals that the preferred cofactor is negatively supercoiled DNA, Journal of molecular biology 367, 647–664. [DOI] [PMC free article] [PubMed] [Google Scholar]
- [13].Hargreaves D, Rafferty JB, Sedelnikova SE, Lloyd RG, and Rice DW (1999) Crystallization of Escherichia coli RuvA complexed with a synthetic Holliday junction, Acta Crystallogr D Biol Crystallogr 55, 263–265. [DOI] [PubMed] [Google Scholar]
- [14].Sun Z, Tan HY, Bianco PR, and Lyubchenko YL (2015) Remodeling of RecG Helicase at the DNA Replication Fork by SSB Protein, Sci Rep 5, 9625. [DOI] [PMC free article] [PubMed] [Google Scholar]
- [15].Buss J, Kimura Y, and Bianco P (2008) RecG interacts directly with SSB: implications for stalled replication fork regression., Nucleic Acids Res 36, 7029–7042. [DOI] [PMC free article] [PubMed] [Google Scholar]
- [16].Gill S, and von Hippel P (1989) Calculation of protein extinction coefficients from amino acid sequence data., Anal Biochem 182, 319–326. [DOI] [PubMed] [Google Scholar]
- [17].Lohman TM, Green JM, and Beyer RS (1986) Large-scale overproduction and rapid purification of the Escherichia coli ssb gene product. Expression of the ssb gene under. lambda. PL control, Biochemistry 25, 21–25. [DOI] [PubMed] [Google Scholar]
- [18].Lohman TM, and Overman LB (1985) Two binding modes in Escherichia coli single strand binding protein-single stranded DNA complexes. Modulation by NaCl concentration, The Journal of biological chemistry 260, 3594–3603. [PubMed] [Google Scholar]
- [19].Lyubchenko YL, Shlyakhtenko LS, and Ando T (2011) Imaging of nucleic acids with atomic force microscopy, Methods (San Diego, Calif: ) 54, 274–283. [DOI] [PMC free article] [PubMed] [Google Scholar]
- [20].Shlyakhtenko LS, Lushnikov AY, Miyagi A, and Lyubchenko YL (2012) Specificity of binding of single-stranded DNA-binding protein to its target, Biochemistry 51, 1500–1509. [DOI] [PMC free article] [PubMed] [Google Scholar]
- [21].Tseng Q, Wang I, Duchemin-Pelletier E, Azioune A, Carpi N, Gao J, Filhol O, Piel M, Thery M, and Balland M (2011) A new micropatterning method of soft substrates reveals that different tumorigenic signals can promote or reduce cell contraction levels, Lab Chip 11, 2231–2240. [DOI] [PubMed] [Google Scholar]
- [22].Schindelin J, Rueden CT, Hiner MC, and Eliceiri KW (2015) The ImageJ ecosystem: An open platform for biomedical image analysis, Mol Reprod Dev 82, 518–529. [DOI] [PMC free article] [PubMed] [Google Scholar]
- [23].Yang J, Yan R, Roy A, Xu D, Poisson J, and Zhang Y (2015) The I-TASSER Suite: protein structure and function prediction, Nat Meth 12, 7–8. [DOI] [PMC free article] [PubMed] [Google Scholar]
- [24].Berman HM, Westbrook J, Feng Z, Gilliland G, Bhat TN, Weissig H, Shindyalov IN, and Bourne PE (2000) The Protein Data Bank, Nucleic Acids Res 28, 235–242. [DOI] [PMC free article] [PubMed] [Google Scholar]
- [25].Case DA, Babin V, Berryman JT, Betz RM, Cai Q, Cerutti DS, Cheatham TE, Darden TA, Duke RE, Gohlke H, Goetz AW, Gusarov S, Homeyer N, Janowski P, Kaus J, Kolossváry I, Kovalenko A, Lee TS, LeGrand S, Luchko T, Luo R, Madej B, Merz KM, Paesani F, Roe DR, Roitberg A, Sagui C, Salomon-Ferrer R, Seabra G, Simmerling CL, Smith W, Swails J, Walker, Wang J, Wolf RM, Wu X, and Kollman PA (2014) {Amber 14}. [Google Scholar]
- [26].Hornak V, Abel R, Okur A, Strockbine B, Roitberg A, and Simmerling C (2006) Comparison of multiple Amber force fields and development of improved protein backbone parameters, Proteins: Structure, Function, and Bioinformatics 65, 712–725. [DOI] [PMC free article] [PubMed] [Google Scholar]
- [27].Jorgensen WL, Chandrasekhar J, Madura JD, Impey RW, and Klein ML (1983) Comparison of simple potential functions for simulating liquid water, The Journal of Chemical Physics 79, 926–935. [Google Scholar]
- [28].Zgarbová M, Šponer J, Otyepka M, Cheatham TE, Galindo-Murillo R, and Jurečka P (2015) Refinement of the Sugar–Phosphate Backbone Torsion Beta for AMBER Force Fields Improves the Description of Z- and B-DNA, Journal of Chemical Theory and Computation 11, 5723–5736. [DOI] [PubMed] [Google Scholar]
- [29].Baker NA, Sept D, Joseph S, Holst MJ, and McCammon JA (2001) Electrostatics of nanosystems: Application to microtubules and the ribosome, Proceedings of the National Academy of Sciences 98, 10037–10041. [DOI] [PMC free article] [PubMed] [Google Scholar]
- [30].Schrodinger LLC. (2015) The PyMOL Molecular Graphics System, Version 1.8. [Google Scholar]
- [31].Abraham MJ, Murtola T, Schulz R, Páll S, Smith JC, Hess B, and Lindahl E (2015) GROMACS: High performance molecular simulations through multi-level parallelism from laptops to supercomputers, SoftwareX 1–2, 19-25. [Google Scholar]
- [32].Humphrey W, Dalke A, and Schulten K (1996) VMD: Visual molecular dynamics, Journal of Molecular Graphics 14, 33–38. [DOI] [PubMed] [Google Scholar]
- [33].McGlynn P, and Lloyd R (1999) RecG helicase activity at three- and four-strand DNA structures., Nucleic Acids Res 27, 3049–3056. [DOI] [PMC free article] [PubMed] [Google Scholar]
- [34].Miyagi A, Ando T, and Lyubchenko YL (2011) Dynamics of Nucleosomes Assessed with Time-Lapse High-Speed Atomic Force Microscopy, Biochemistry 50, 7901–7908. [DOI] [PubMed] [Google Scholar]
- [35].Gilmore JL, Suzuki Y, Tamulaitis G, Siksnys V, Takeyasu K, and Lyubchenko YL (2009) Single-molecule dynamics of the DNA-EcoRII protein complexes revealed with high-speed atomic force microscopy, Biochemistry 48, 10492–10498. [DOI] [PMC free article] [PubMed] [Google Scholar]
- [36].Bianco PR (2015) I came to a fork in the DNA and there was RecG, Prog Biophys Mol Biol 117, 166–173. [DOI] [PMC free article] [PubMed] [Google Scholar]
- [37].Yu C, Tan HY, Choi M, Stanenas AJ, Byrd AK, K DR, Cohan CS, and Bianco PR (2016) SSB binds to the RecG and PriA helicases in vivo in the absence of DNA, Genes Cells 21, 163–184. [DOI] [PMC free article] [PubMed] [Google Scholar]
- [38].Upton AL, Grove JI, Mahdi AA, Briggs GS, Milner DS, Rudolph CJ, and Lloyd RG (2014) Cellular location and activity of Escherichia coli RecG proteins shed light on the function of its structurally unresolved C-terminus, Nucleic Acids Res 42, 5702–5714. [DOI] [PMC free article] [PubMed] [Google Scholar]
Associated Data
This section collects any data citations, data availability statements, or supplementary materials included in this article.


