Abstract
Purpose:
To assess the potential of machine learning with multiparametric MRI (mpMRI) for the early prediction of pathological complete response (pCR) to neoadjuvant chemotherapy (NAC) and of survival outcomes in breast cancer patients.
Materials and Methods:
This IRB-approved prospective study included 38 women (median age 46.5 years; range 25–70 years) with breast cancer who were scheduled for NAC and underwent mpMRI of the breast at 3T with DCE, DWI and T2-weighted imaging prior to and after two cycles of NAC. For each lesion, 23 features were extracted: qualitative T2-weighted and DCE-MRI features according to BI-RADS, quantitative pharmacokinetic DCE features (mean plasma flow, volume distribution, mean transit time) and DWI apparent diffusion coefficient (ADC) values. To apply machine learning to mpMRI, eight classifiers including linear support vector machine (SVM), linear discriminant analysis (LDA), logistic regression (LR), random forest (RF), stochastic gradient descent (SGD), decision tree, adaptive boosting (AdaBoost) and extreme gradient boosting (XGBoost) were employed to rank the features. Histopathologic Residual Cancer Burden (RCB) class (with RCB 0 being a pCR), recurrence-free survival (RFS) and disease-specific survival (DSS) were used as the standards of reference. Classification accuracy with area under the receiving operating characteristic curve (AUC) was assessed using all the extracted qualitative and quantitative features for pCR as defined by RCB class, RFS and DSS using recursive feature elimination. To overcome overfitting, four-fold cross-validation was employed.
Results:
Machine learning with mpMRI achieved stable performance as shown by mean classification accuracies for the prediction of RCB class (AUC 0.86) and DSS (AUC 0.92) based on XGBoost and the prediction of RFS (AUC 0.83) with LR. The XGBoost classifier achieved the most stable performance with high accuracies compared with other classifiers. The most relevant features for the prediction of RCB class were: changes in lesion size, complete pattern of shrinkage and mean transit time on DCE-MRI; minimum ADC on DWI; and peritumoral edema on T2-weighted imaging. The most relevant features for prediction of RFS were: volume distribution, mean plasma flow and mean transit time, DCE-MRI lesion size, minimum, maximum, and mean ADC with DWI. The most relevant features for prediction of DSS were: lesion size, volume distribution and mean plasma flow on DCE-MRI and maximum ADC with DWI.
Conclusion:
Machine learning with mpMRI of the breast enables early prediction of pCR to NAC as well as survival outcomes in breast cancer patients with high accuracy and thus may provide valuable predictive information to guide treatment decisions.
Keywords: Breast Cancer, machine learning, response prediction, neoadjuvant chemotherapy, residual cancer burden, multiparametric magnetic resonance imaging, dynamic contrast-enhanced MRI, diffusion weighted imaging
Introduction
Neo-adjuvant chemotherapy (NAC) as a standard of care offers several advantages such as increased rates of breast-conserving surgery and decreased axillary dissection (1). The recent St. Gallen consensus statement also indicates that NAC is widely used in TNBC and HER2+ subtypes of breast cancer, with this preference being extended to women who are eligible for breast conservation at diagnosis (1). This new development is driven by response-guided assessment of prognosis, adjuvant treatment and follow up. The achievement of a pathological complete response (pCR) is significantly associated with improved disease-free and overall survival (2) in breast cancer patients undergoing NAC whereas poor outcome after NAC is associated with less favorable prognosis (3). Nevertheless, a pCR is achieved in only 30% of the patients after the completion of NAC and thus determining factors and an accurate means to predict treatment response as early as possible are desirable for identifying patients who do not benefit from NAC (2). Several studies have demonstrated that dynamic contrast-enhanced magnetic resonance imaging (DCE-MRI) is the most sensitive method for the assessment and prediction of treatment response to NAC (4–8). In addition, it has been demonstrated that multiparametric MRI (mpMRI) using morphological as well as additional functional parameters such as diffusion-weighted imaging (DWI) has the potential for improving the prediction of treatment response (6, 8–12). Further, with advances in the field of bioinformatics, new approaches to medical imaging data analysis for predictive modeling in cancer evaluation have been developed (13). In contrast to traditional statistical approaches which usually consider a limited finite set of hypotheses and evaluate them, machine learning approaches have the capability to generate models for prediction by extensively searching through the model and parameter space and thus have been embraced for predictive modeling and decision-making in biomedicine (14–18). Inital results have demonstrated the potential for the application of machine learning with MRI almost exclusively on DCE-MRI for prediction of treatment response, but the potential of mpMRI in this context has not yet been fully explored (19–21). Therefore, the aim of this study was to assess the feasibility of machine learning with mpMRI using T2-weighted-MRI, DCE-MRI and DWI for the early prediction of pCR to NAC, recurrence-free survival (RFS) and disease specific survival (DSS) in breast cancer patients.
Material and Methods
The institutional review board approved this prospective, single-institution study and retrospective radiomics data analysis. All patients gave written, informed consent.
Patients
Between 04/2008 and 04/2013, 38 patients (median age 46.5 years; range 25–70 years) who fulfilled the following inclusion criteria were enrolled in this study:: ≥18 years; not pregnant; not breastfeeding; new diagnosis of histopathologically proven breast cancer scheduled for NAC [(Breast Imaging Reporting and Data System [(BI-RADS) 6, biopsy-proven malignancy)]. Exclusion criteria were: previous treatment; and contraindications for MRI or MRI contrast agents. All patients underwent multiparametric mpMRI two weeks prior to initiation and after two cycles of NAC. For all patients the following information were recorded at therapy: age; type and start date of systemic therapy; histologic type; tumor grade; receptor status; tumor proliferation rate (ki67), nodal status, date of progression (local recurrence, distant metastases) to determine duration (months) of RFS; and date and cause of death or date of last follow-up to determine duration (months) of DSS.
MR Imaging
All patients underwent mpMRI of the breast at 3T in the prone position (Trio Tim; Siemens Medical Solutions, Erlangen, Germany) with a dedicated four-channel breast coil (In Vivo, Orlando, FL, USA). The following protocol was used before and during NAC:
A T2-weighted turbo spin echo sequence with fat suppression: time of repetition (TR)/time of echo (TE) 4800/59 msec; field of view (FOV) 340 mm; 44 slices at 4 mm; flip angle 120°; matrix 384×512; and acquisition time (TA) 2:35 min.
DWI:
A double-refocused, single-shot echo-planar imaging (EPI) with inversion recovery (IR) fat suppression: TR/TE/time of inversion (TI) 13700/83/220 msec; FOV 340×117 mm; 40 slices at 3.5 mm; matrix 192×64 [50% oversampling]; 2 averages; b values, 50 and 850 s/min2; and TA 3 min 19 sec.
DCE-MRI:
Until December 2011 a hybrid DCE-MRI protocol was used with the following sequences: T1-weighted Volume-Interpolated-Breathhold-Examination sequences (TR/TE 3.62/1.4 ms; FOV 320 mm; 72 slices; 1.7 mm isotropic; matrix 192×192; one average; TA 13.2 sec per volume, 37 measurements) and T1-weighted turbo fast-low-angle-shot-3D sequences with selective water-excitation (TR/TE 877/3.82 ms; FOV 320 mm; 96 slices; 1 mm isotropic; matrix 320×134; one average; TA 2 min) with a total time of acquisition of 9:20 min (22). From January 2012 onwards a transversal T1-weighted time-resolved angiography with stochastic trajectories (TWIST) was acquired (water excitation fat-saturation; TR/TE 6.23/2.95 ms; flip angle 15°, FOV 196×330 mm2; 144 slices; spatial resolution 0.9×0.9×1 mm; temporal interpolation factor 2; temporal resolution 14 s; matrix 384×384; one average; center k-space region with a resampling rate of 23%; reacquisition density of peripheral k-space 20%; and TA 6:49 min.
A standard dose (0.1 mmol/kg body weight) of gadoterate meglumine (Gd-DOTA; Dotarem®, Guerbet, France) was injected intravenously as a bolus at 4 ml/s followed by a saline flush. The total MRI examination time was approximately 10–12 minutes.
Image Analysis
mpMRI data were evaluated by two experienced breast radiologists (K.P., 12 years of experience; G.W., 5 years of experience). Qualitative and quantitative imaging features were extracted from baseline and follow up mpMRI images. These features were used as attributes to feed machine learning classifiers.
Qualitative imaging features
For all lesions size (largest diameter) in the right-left (RL), cranio-caudal (CC) and anterior-posterior (AP) direction and pattern of shrinkage (concentric, fragmentation or complete) were recorded. Signal intensity on T2-weighted sequences (hypointense, isointense or hyperintense) and the presence or absence of a peri-tumoral edema were noted. In DCE-MRI tumors were classified as mass or non-mass enhancing lesions. According to the 5th edition of the American College of Radiology and Breast Imaging Reporting and Data System (23) the following descriptors were assessed for masses: shape (round, oval and irregular), margins (circumscribed, irregular and spiculated) and internal enhancement characteristics (homogeneous, heterogeneous, rim enhancement and dark internal septations). For non-mass enhancing lesions the distribution (focal, linear, regional, segmental, multiple and diffuse), internal enhancement pattern (homogeneous, heterogeneous, clumped and clustered ring) and symmetry (symmetric and asymmetric) were evaluated.
Quantitative imaging features
For pharmacokinetic assessment of DCE-MRI, the mean plasma flow, volume distribution and mean transit time were assessed with parametric maps using a 3D-based region of interest (ROI) segmentation approach using the UMM-perfusion tool of OsiriX ® version 7.0 (University of Heidelberg) (24).
DWI high b-value (i.e., 850 s/mm2) images were qualitatively assessed for hyperintense regions corresponding to the lesion on DCE-MRI. The slice with the greatest representative portion of the tumor was selected. One two-dimensional region-of-interest (2D ROI) with a minimum area of 1 mm2 was drawn on the part of the tumor with the lowest apparent diffusion coefficient (ADC) using OsiriX ® and the mean, minimum and maximum ADC was recorded.
Histopathologic Diagnosis
All surgical specimens were analyzed by two breast pathologists (Z.B., seven years of experience in breast pathology; S.A., 7 years of experience in breast pathology). The residual cancer burden (RCB) score was used for assessment of pathological treatment response. The RCB score is as continuous variable that is calculated using the following parameters: 1) primary tumor bed area (mm2), overall cancer cellularity (% of area) and percentage of cancer that is in situ disease (%); and 2) number of positive lymph nodes and diameter of largest metastasis (mm) (25). Scores were then expressed as four RCB classes: RCB 0 is consistent with pCR with no evidence of residual disease. If residual disease is present this was classified into three categories: RCB 1 minimal residual disease present; RCB 2 moderate response to neoadjuvant disease and moderate residual disease burden; and RCB 3 extensive residual disease burden (26).
Survival Outcomes
For the assessment of RFS and DSS, all patients underwent clinical and imaging follow-up with mammography, sonography or computed tomography until progression, followed by routine follow-up until death. At the discretion of the treating physician, some patients were also followed with MRI of the breast and positron emission tomography/computed tomography scans. All local and distant recurrences were histopathologically verified (27).
Machine Learning
Eight robust machine learning algorithms including linear support vector machine (SVM), linear discriminant analysis (LDA), logistic regression (LR), random forests (RF), stochastic gradient descent (SGD), decision tree, adaptive boosting (AdaBoost) and extreme gradient boosting (XGBoost) were applied to the mpMRI data to predict RCB class, RFS and DSS. For details on the individual classifiers refer to Supplement S1. For the purposes of predicting RCB class, machine learning class 1 denoted a complete (RCB 0) and machine learning class 0 an incomplete pathologic response (RCB class 1, 2, 3). Each specific learning algorithm was designed to provide the best model to fit the input data and predict the class labels correctly. Optimum ranking of the features based on their importance in the models was reported using recursive feature elimination. To overcome overfitting, four-fold cross-validation was employed to differentiate between two groups of each defined classes. Area under the receiver operation characteristic (ROC) curve (AUC) was used as the classification metric.
Results
Of the 38 patients in the study, after completion of NAC, nine patients were classified as RCB class 0, seven as RCB class 1, fourteen as RCB class 2 and eight as RCB class 3. Tumor histopathology, grade and receptor status proliferation rate stratified by RCB class are summarized in Table 1. NAC regimes and RCB class for all patients are listed in Table 2. The median follow-up time for all patients was 65 months (range, 6–119 months). Eight patients (21.05%) progressed during the follow-up period after a median interval of 16 months (range, 1–56 months), and four patients (10.52%) died of breast cancer during the follow-up period at a median interval of 53 months (range, 12–87 months).
Table 1:
Tumor histopathology, grade and receptor status proliferation rate stratified by RCB class.
| RCB 0 (pCR) | RCB 1 | RCB 2 | RCB 3 | Total | |
|---|---|---|---|---|---|
| Number of lesions | 9 (23.68%) | 7 (18.42%) | 14 (36.84%) | 8 (21.05%) | 38 (100%) |
| Age at diagnosis (years) | 53.22 (11.9) | 41.71 (12.73) | 52.33 (9.14) | 47.25 (9.13) | 49.47 (10.83) |
| Tumor type | |||||
| IDC | 8 (21.05%) | 7 (18.42%) | 13 (34.21%) | 8 (21.05%) | 36 (94.74%) |
| ILC | 1 (2.63%) | 0 (0.0%) | 1 (2.63%) | 0 (0.0%) | 2 (5.26%) |
| Histologic grade | |||||
| 1 | 0 (0.0%) | 0 (0.0%) | 1 (2.63%) | 0 (0.0%) | 1 (2.63%) |
| 2 | 1 (2.63%) | 3 (7.89%) | 3 (7.89%) | 3 (7.89%) | 10 (26.32%) |
| 3 | 8 (21.05%) | 4 (10.53%) | 10 (26.32%) | 5 (13.15%) | 27 (71.05%) |
| ER | |||||
| Positive | 3 (7.89%) | 5 (13.15%) | 7 (18.42%) | 6 (15.78%) | 21 (55.26%) |
| Negative | 6 (15.78%) | 2 (5.26%) | 7 (18.42%) | 2 (5.26%) | 17 (44.74%) |
| PR | |||||
| Positive | 0 (0.0%) | 4 (10.53%) | 8 (21.05%) | 5 (13.15%) | 17 (44.74%) |
| Negative | 9 (23.68%) | 3 (7.89%) | 6 (15.78%) | 3 (7.89%) | 21 (55.26%) |
| HER2 | |||||
| Positive | 4 (10.53%) | 2 (5.26%) | 6 (15.78%) | 2 (5.26%) | 14 (36.84%) |
| Negative | 5 (13.15%) | 5 (13.15%) | 8 (21.05%) | 6 (15.78%) | 24 (63.16%) |
| ER & PR | |||||
| Positive | 0 (0.0%) | 3 (7.89%) | 6 (15.78%) | 5 (13.15%) | 14 (36.84%) |
| TN | 4 (10.53%) | 1 (2.63%) | 3 (7.89%) | 1 (2.63%) | 9 (23.68%) |
| ki67 | |||||
| High (≥20%) | 9 (23.68%) | 6 (15.78%) | 11 (28.94%) | 4 (10.53%) | 30 (78.95%) |
| Low (20%) | 0 (0.0%) | 0 (0.0%) | 0 (0.0%) | 2 (5.26%) | 2 (5.26%) |
| N/A | 0 (0.0%) | 1 (2.63%) | 3 (7.89%) | 2 (5.26%) | 6 (15.79%) |
| Tumor diameter at baseline | Mean | ||||
| 22.55 (18.66) | 23.00 (13.27) | 36.64 (14.73) | 61.875 (27.50) | 36.10 (23.32) | |
Note: RCB, Residual Cancer Burden; ER, Estrogen Receptor; PR, Progesteron Receptor; HER2, Human Epidermal Growth Factor Receptor 2; TN, Triple negative (ER, PR, Her2 negative)
Table 2:
NAC regimes and RCB class for all patients.
| Nr. | NAC regimes | RCB class |
|---|---|---|
| 1 | Anthracycline/Taxane-containing plus Herceptin and Avastin | 3 |
| 2 | Anthracycline/Taxane-containing plus Herceptin | 2 |
| 3 | Anthracycline/Taxane-containing plus Herceptin and Avastin | 0 |
| 4 | Anthracycline/Taxane-containing plus Herceptin and Avastin | 0 |
| 5 | Anthracycline/Taxane-containing plus Herceptin | 2 |
| 6 | Anthracyclin-containing | 0 |
| 7 | Anthracycline/Taxane-containing | 2 |
| 8 | Anthracyclin-containing | 1 |
| 9 | Anthracycline/Taxane-containing | 0 |
| 10 | Anthracycline/Taxane-containing | 3 |
| 11 | Anthracycline/Taxane-containing | 3 |
| 12 | Anthracycline/Taxane-containing | 2 |
| 13 | Anthracycline/Taxane-containing | 2 |
| 14 | Anthracycline/Taxane-containing | 1 |
| 15 | Anthracycline/Taxane-containing | 3 |
| 16 | Anthracyclin-containing plus Herpceptin | 3 |
| 17 | Anthracycline/Taxane-containing | 2 |
| 18 | Taxane-containing | 2 |
| 19 | Epirubicin - Taxotere plus Herceptin | 3 |
| 20 | Anthracycline/Taxane-containing | 2 |
| 21 | Anthracycline/Taxane-containing | 0 |
| 22 | Anthracycline/Taxane-containing | 2 |
| 23 | Anthracycline/Taxane-containing | 2 |
| 24 | Anthracycline/Taxane-containing | 1 |
| 25 | Anthracycline/Taxane-containing | 1 |
| 26 | Anthracycline/Taxane-containing | 3 |
| 27 | Anthracycline/Taxane-containing | 1 |
| 28 | Anthracycline/Taxane-containing | 2 |
| 29 | Anthracycline/Taxane-containing | 2 |
| 30 | Anthracycline/Taxane-containing | 0 |
| 31 | Anthracycline/Taxane-containing | 1 |
| 32 | Anthracycline/Taxane-containing | 1 |
| 33 | Anthracycline/Taxane-containing plus Herceptin | 0 |
| 34 | Anthracycline/Taxane-containing | 0 |
| 35 | Anthracycline/Taxane-containing plus Herceptin and Avastin | 0 |
| 36 | Anthracycline/Taxane-containing | 3 |
| 37 | Anthracycline/Taxane-containing | 2 |
| 38 | Anthracycline/Taxane-containing | 2 |
Based on recursive feature elimination, feature importance in the mpMRI model for prediction of RCB class, RFS, and DSS are summarized in Figure 1. For prediction of RCB class, RFS and DSS, qualitative and quantitative features from all mpMRI sequences, i.e., T2-weighted, DCE and DWI, were necessary. The most relevant features for prediction of RCB class were qualitative features including changes in lesion size (RL, CC and AP) and complete pattern of shrinkage on DCE-MRI, quantitative pharmacokinetic features including mean transit time with DCE-MRI, peritumoral edema on T2-weighted imaging and minimum ADC with DWI. For prediction of RFS, the most relevant features were the qualitative feature of lesion size on DCE-MRI (RL, AP), the quantitative features of volume distribution and mean plasma flow and ADC with DWI. For prediction of DSS, the qualitative feature of lesion size (RL, AP), the quantitative pharmacokinetic features of volume distribution and mean plasma flow and maximum ADC with DWI were most relevant.
Figure 1.
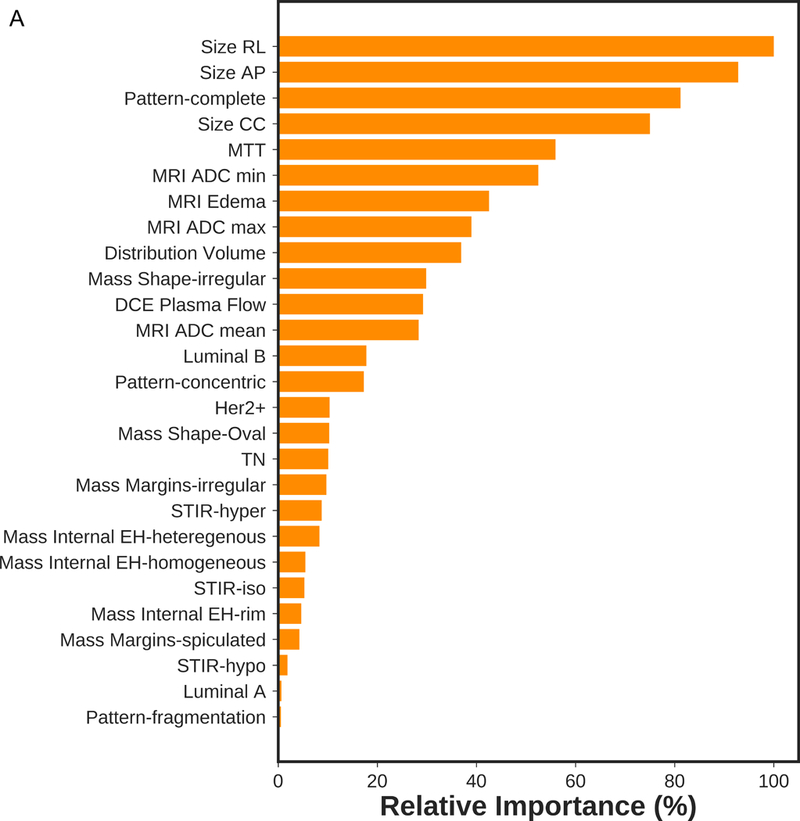
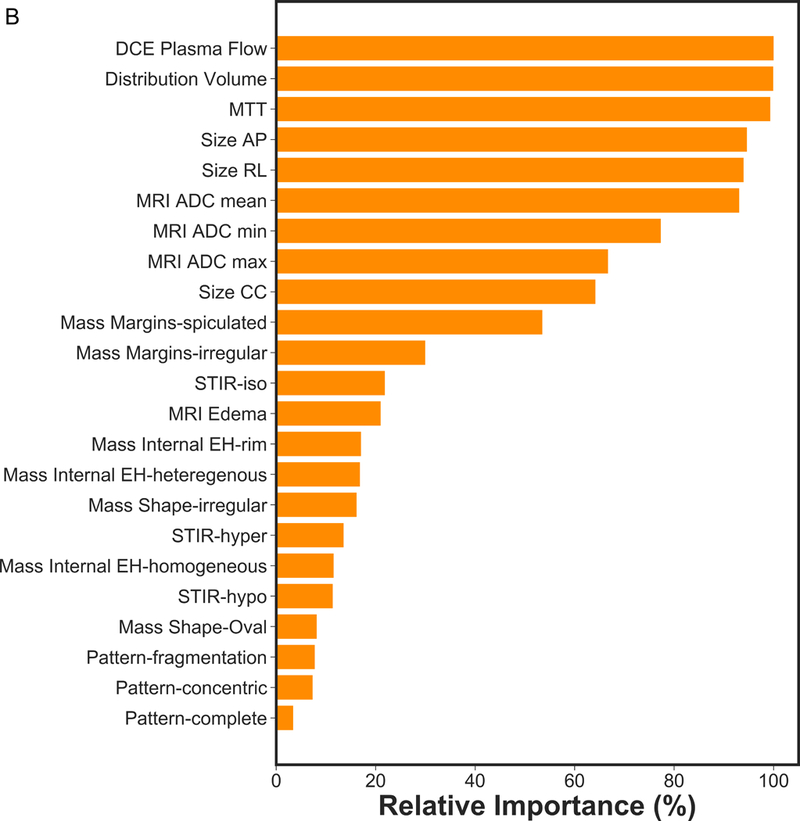
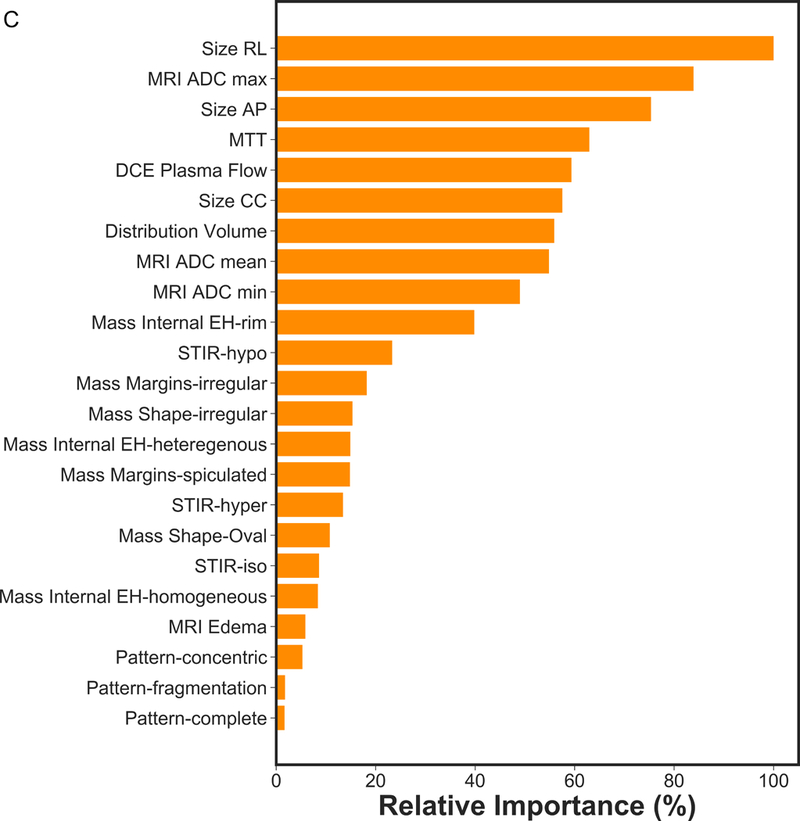
Feature importance of mpMRI model in prediction of a) RCB class, b) RFS and c) DSS.
Figure 2 presents the box plot illustration of the performance of recursive feature elimination along with eight machine learning classifiers in prediction of RCB class (Figure 2a), RFS (Figure 2b) and DSS (Figure 2c). Table 3 summarizes the AUCs for all classifier models. To identify the most stable classifier with high accuracy and low variance for predicting RCB class, RFS and DSS, radar plot presentations of the mean AUC and the best AUC of the eight machine learning classifiers were calculated (Figure 3). XGBoost outperformed all other classifier models including SVM, LDA, LR, RF, SGD, decision tree and AdaBoost in the prediction of RCB class and DSS, with AUCs ranging from 0.8577–0.9430 and 0.9052–0.92 for RCB class and DSS, respectively. For the prediction of RFS, LR showed better performance with AUCs ranging from 0.8259–0.8666 (~3% better than XGBoost) (Figure 4); however, it should be noted that, XGBoost showed a more stable performance (less variance) in prediction of all three classes (Table 3).
Figure 2.
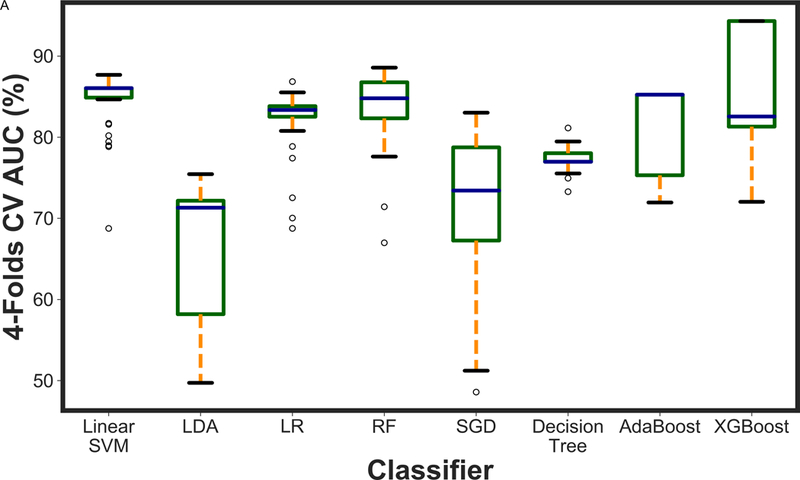
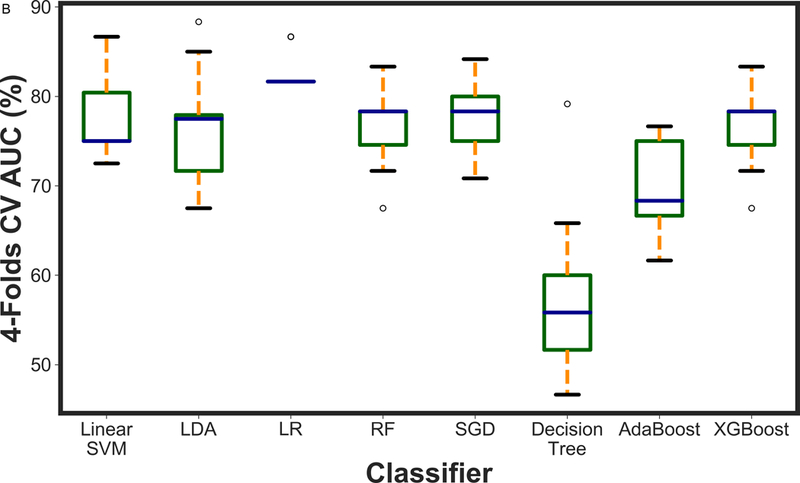
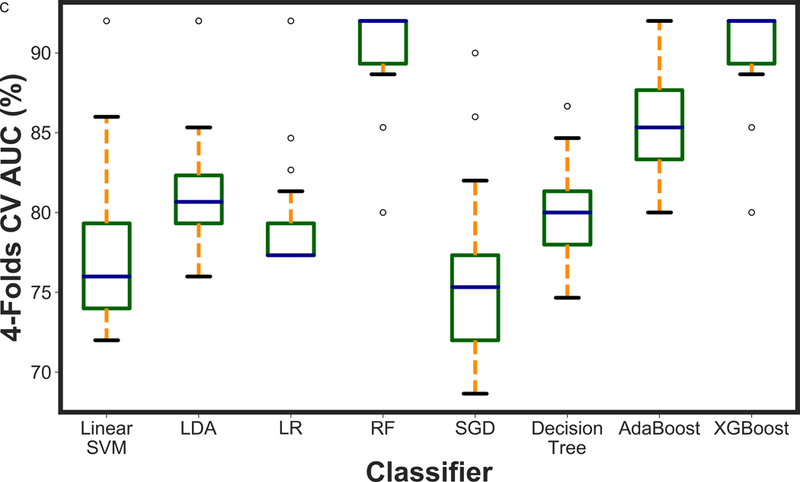
A boxplot illustration of various machine learning algorithms performance using recursive feature elimination to predict a) RCB class, b) RFS and c) DSS employing four-fold cross-validation. AUC was used as the classification metric.
Table 3:
Classification performance of mpMRI models using various classifiers along with recursive feature elimination. Best AUC (Mean AUC) was reported for each classifier as the classification performance metric.
| Classifier | RCB | RFS | DSS |
|---|---|---|---|
| XGBoost | 0.9430 (0.8577) | 0.8333 (0.7672) | 0.9200 (0.9052) |
| AdaBoost | 0.8523 (0.8112) | 0.7666 (0.7009) | 0.9200 (0.8342) |
| Linear SVM | 0.8767 (0.8450) | 0.8666 (0.7777) | 0.9200 (0.7797) |
| LDA | 0.7544 (0.6608) | 0.8833 (0.7620) | 0.9705 (0.9019) |
| LR | 0.8684 (0.8207) | 0.8666 (0.8259) | 0.9200 (0.8130) |
| SGD | 0.8303 (0.7086) | 0.8416 (0.7787) | 0.9000 (0.7605) |
| Decision Tree | 0.8113 (0.7729) | 0.7916 (0.5654) | 0.8666 (0.8028) |
| RF | 0.8857 (0.8364) | 0.7916 (0.6682) | 0.8666 (0.8559) |
Note: RCB, residual class burden; recurrence-free survival; DSS, disease-specific survival, RFS, recurrence-free survival, SVM, linear support vector machine; LDA, linear discriminant analysis; LR, logistic regression; RF, random forests; SGD, stochastic gradient descent; decision tree
Figure 3.
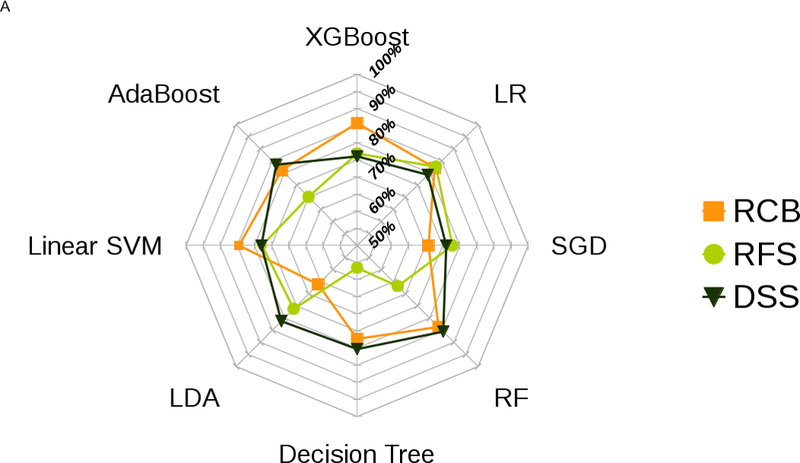
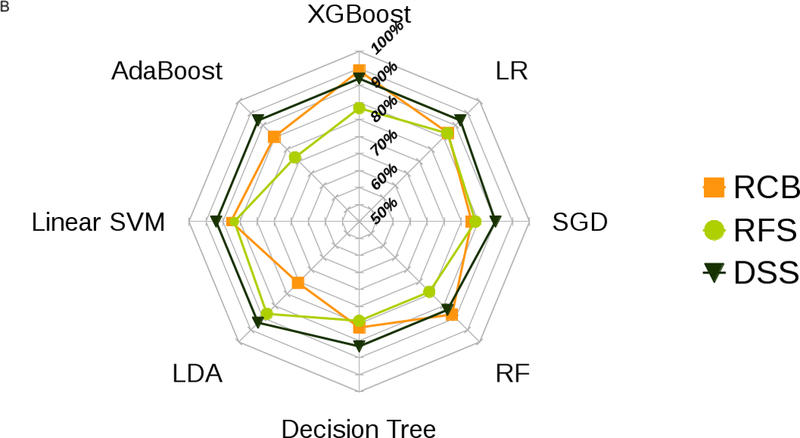
Radar plot illustrations of a) mean and b) best performance to identify the most stable ML classifier with high accuracy and low variance for predicting RCB class, RFS and DSS.
Figure 4.
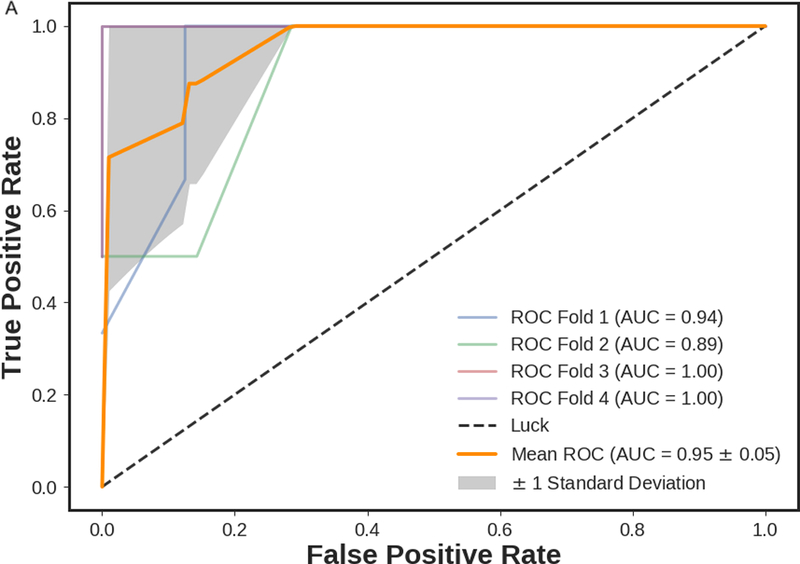
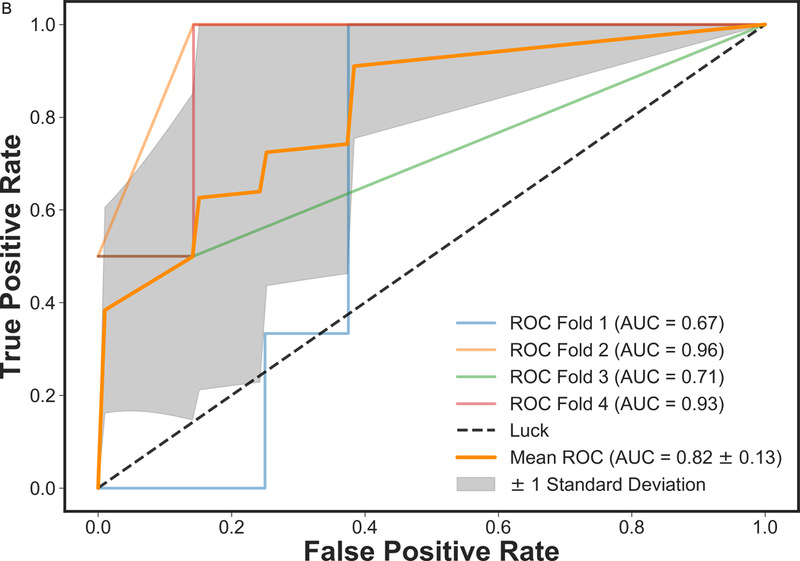
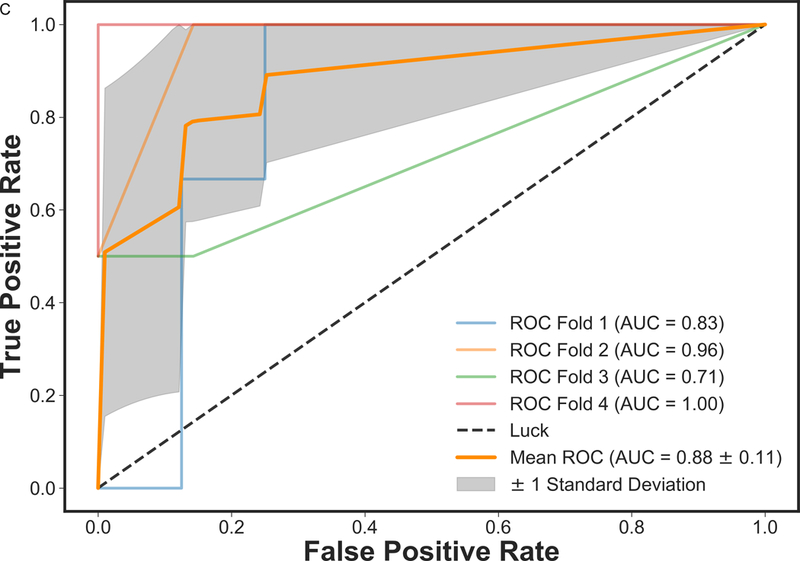
ROC curves of mpMRI model using XGBoost classifier employing four-fold cross-validations in prediction of a) RCB class and b) RFS, and three-fold cross-validation in prediction of c) DSS. The solid orange lines present the mean ROC curve, the lighter lines illustrate the ROC curve for each fold, and the gray shaded areas provide the confidence interval for the predictions using mpMRI model.
Discussion
In this study, we applied machine learning to mpMRI of the breast for early prediction of pCR to NAC and survival outcomes in breast cancer patients. Machine learning with mpMRI allowed prediction of pCR (best/mean AUC 0.94/0.86) and survival outcomes (RFS best/mean AUC 0.83/0.77; DSS best/mean AUC 0.92/0.91) with high accuracy. Qualitative and quantitative features from all MRI sequences were necessary for prediction of RCB class, RFS and DSS, thus supporting the use of an mpMRI approach. Of all machine learning classifier models, the XGBoost classifier model outperformed all other models in the prediction of pCR and DSS. Only for RFS, the LR classifier model showed a slightly better accuracy (~3%) yet the XGBoost model is more stable.
In breast cancer patients undergoing NAC, the achievement of a pCR is significantly associated with improved disease-free and overall survival (2) and yet is achieved in only 30% of patients (2). Therefore, means for early prediction of treatment response to identify women, who are less likely to achieve pCR to standard NAC and are therefore candidates for alternative treatment approaches, may be pivotal. The application of machine learning to mpMRI to improve its predictive capabilities is an important step towards precision medicine in breast cancer.
In contrast to initial prior studies, we used a wealth of qualitative and quantitative parameters extracted from mpMRI including T2-weighted-MRI, DCE-MRI and ADC (min, max, mean) with DWI. We extracted 23 features per lesion and employed eight robust machine learning algorithms including SVM, LDA, LR, RF, SGD, decision tree, AdaBoost, and XGBoost. We showed that both qualititve and quantitive features from mpMRI are important for accurate prediction of pCR. Such features include changes in lesion size and complete pattern of shrinkage on DCE-MRI, mean transit time on DCE-MRI, minimum ADC with DWI and peritumoral edema on T2-weighted imaging. We demonstrated that all classifiers predicted pCR, with XGBoost outperforming the others with a mean AUC of 0.8577 and best AUC of 0.9430.
Several studies that have investigated DCE-MRI in this context have shown that functional imaging with or without texture analysis outperforms conventional imaging, paving the way for new, effective and preferably non-invasive or minimally invasive approaches to predict treatment response (8, 28–30). Previous studies that have explored utility of machine learning for improved prediction of pCR to NAC in breast cancer patients have so far almost exclusively focused on single-parametric DCE-MRI derived kinetic features (31–33). O’Flynn et al. (12) have shown that machine learning algorithms such as linear discriminant analysis along with statistical methods based on DCE-MRI features such as enhancement fraction, tumor volume, initial area under the gadolinium curve, and pharmaco-kinetic parameters such as Ktrans and Kep can be employed to predict patients in terms of responders and non-responders to NAC. However, it should be noted that they have employed only seven features along with one machine learning algorithm based on thirty-two patients.
Mani et al. investigated the early prediction of the response to NAC, adding functional information from DWI to DCE-MRI as well as ultrasonographic, clinical and histopathological information (20). Thirteen imaging features from quantitative DCE-MRI features; ADCmean with DWI; size on ultrasound; eleven clinical parameters including age, clinically estimated tumor size, receptor status, proliferation rate and node parameters were used for the predictive models. Three linear classifiers (Gaussian Naïve Bayes, LR and Bayesian LR), two decision tree based classifiers (CART36 and RF), one kernel based classifier (SVM) and one rule learner (Ripper) in conjuntion with three feature selection methods (HITON-MB, Gram-Schmidt orthogonalization with a maximum number of ten features output, and BLCD-MB) were used. In studies combining imaging and clinical data, Bayesian LR had the best performance with an AUC of 0.96 (20). In a follow-up study, the authors achieved similar results (AUC 0.86) when expanding the number of variables derived from semi-quantitve and quantitive DCE-MRI (19). It has to be noted that in this the information of both invasive histopathologic assessement, clinical examination and ultrasound was necessary. In our study, we solely relied on the qualitative and quantitive features extracted from one imaging modality, i.e., mpMRI, achieving similar results with high accuarcies (best/mean AUC 0.94/0.86).
In addition, we investigated the potential of applying machine learning with mpMRI for the prediction of RFS and DSS. We found that qualitative features such as lesion size together with quantitative pharmacokinetic features (volume distribution, mean plasma flow and mean transit time) and ADC with DWI proved to be necessary for prediction of RFS and DSS. The XGBoost classifier model for mpMRI outperformed all other classifier models for DSS (mean AUC 0.92) and was only minimally superseded for RFS by LR (mean AUC 0.83) and showed the most stable performance of all models. So far, machine learning for prediction of survival outcomes in breast cancer has mainly utilized histopathologic and genomic data derived from invasive tissue sampling (21, 34–37). The results of the current study further provide evidence that functional MRI features can improve our understanding and prediction of cancer progression (16, 21, 30, 38). Our data further highlight the potential of machine learning in this context and indicate that machine learning with non-invasive mpMRI might in the future be used as a cost-effective alternative to genomic assays such as OncotypeDx, MammaPrint, Mammostrat and PAM50/Prosigna which provide scores for risk of recurrence and guide treatment decisions (39).
A limitation of the current study is the small number of patients. At the start of the study, patients routinely underwent pre-treatment staging with MRI and MRI before surgery for assessment of residual disease. Participation in this study required an additional MRI exam which limited compliance. As mpMRI has now been established in this context, validation of the current results pending adequate patient follow-up is the focus of an ongoing study. We used qualitative and quantitative features that can be routinely extracted from mpMRI, which required human input for lesion identification and evaluation. Such inter- or intraobserver variability may affect the extracted imaging features, and in turn, may affect the prediction of pCR, PFS and DSS. This potential effect should be a topic of future studies.
In conclusion, machine learning with mpMRI of the breast enables early prediction of pCR to NAC and of survival outcomes in breast cancer patients with high accuracy. The integration of machine learning with mpMRI may provide valuable predictive information on treatment outcomes and risk of recurrence to guide treatment decisions and thus is a pivotal step for the realization of precision medicine in breast cancer.
References
- 1.Curigliano G, Burstein HJ, Winer EP, et al. De-escalating and escalating treatments for early-stage breast cancer: the St. Gallen International Expert Consensus Conference on the Primary Therapy of Early Breast Cancer 2017. Ann Oncol. 2018. [DOI] [PMC free article] [PubMed] [Google Scholar]
- 2.Cortazar P, Zhang L, Untch M, et al. Pathological complete response and long-term clinical benefit in breast cancer: the CTNeoBC pooled analysis. Lancet. 2014;384(9938):164–72. [DOI] [PubMed] [Google Scholar]
- 3.Cortazar P, Geyer CE Jr. Pathological complete response in neoadjuvant treatment of breast cancer. Ann Surg Oncol. 2015;22(5):1441–6. [DOI] [PubMed] [Google Scholar]
- 4.Abramson RG, Li X, Hoyt TL, et al. Early assessment of breast cancer response to neoadjuvant chemotherapy by semi-quantitative analysis of high-temporal resolution DCE-MRI: preliminary results. Magn Reson Imaging. 2013;31(9):1457–64. [DOI] [PMC free article] [PubMed] [Google Scholar]
- 5.Arlinghaus LR, Li X, Levy M, et al. Current and future trends in magnetic resonance imaging assessments of the response of breast tumors to neoadjuvant chemotherapy. J Oncol. 2010;2010. [DOI] [PMC free article] [PubMed] [Google Scholar]
- 6.Li X, Abramson RG, Arlinghaus LR, et al. Multiparametric magnetic resonance imaging for predicting pathological response after the first cycle of neoadjuvant chemotherapy in breast cancer. Invest Radiol. 2015;50(4):195–204. [DOI] [PMC free article] [PubMed] [Google Scholar]
- 7.Wu LA, Chang RF, Huang CS, et al. Evaluation of the treatment response to neoadjuvant chemotherapy in locally advanced breast cancer using combined magnetic resonance vascular maps and apparent diffusion coefficient. J Magn Reson Imaging. 2015;42(5):1407–20. [DOI] [PubMed] [Google Scholar]
- 8.Minarikova L, Bogner W, Pinker K, et al. Investigating the prediction value of multiparametric magnetic resonance imaging at 3 T in response to neoadjuvant chemotherapy in breast cancer. Eur Radiol. 2017;27(5):1901–11. [DOI] [PMC free article] [PubMed] [Google Scholar]
- 9.Liu S, Ren R, Chen Z, et al. Diffusion-weighted imaging in assessing pathological response of tumor in breast cancer subtype to neoadjuvant chemotherapy. J Magn Reson Imaging. 2015;42(3):779–87. [DOI] [PubMed] [Google Scholar]
- 10.Hahn SY, Ko EY, Han BK, et al. Role of diffusion-weighted imaging as an adjunct to contrast-enhanced breast MRI in evaluating residual breast cancer following neoadjuvant chemotherapy. Eur J Radiol. 2014;83(2):283–8. [DOI] [PubMed] [Google Scholar]
- 11.Woodhams R, Kakita S, Hata H, et al. Identification of residual breast carcinoma following neoadjuvant chemotherapy: diffusion-weighted imaging--comparison with contrast-enhanced MR imaging and pathologic findings. Radiology. 2010;254(2):357–66. [DOI] [PubMed] [Google Scholar]
- 12.O’Flynn EA, Collins D, D’Arcy J, et al. Multi-parametric MRI in the early prediction of response to neo-adjuvant chemotherapy in breast cancer: Value of non-modelled parameters. Eur J Radiol. 2016;85(4):837–42. [DOI] [PubMed] [Google Scholar]
- 13.Shortliffe EH, Marsden SB. The Computer Meets Medicine and Biology: Emergence of a Discipline. In: Informatics B, ed. Health Informatics; Springer; 2006:3–45. [Google Scholar]
- 14.Nattkemper TW, Arnrich B, Lichte O, et al. Evaluation of radiological features for breast tumour classification in clinical screening with machine learning methods. Artif Intell Med. 2005;34(2):129–39. [DOI] [PubMed] [Google Scholar]
- 15.Wei L, Yang Y, Nishikawa RM, Jiang Y. A study on several machine-learning methods for classification of malignant and benign clustered microcalcifications. IEEE Trans Med Imaging. 2005;24(3):371–80. [DOI] [PubMed] [Google Scholar]
- 16.Delen D, Walker G, Kadam A. Predicting breast cancer survivability: a comparison of three data mining methods. Artif Intell Med. 2005;34(2):113–27. [DOI] [PubMed] [Google Scholar]
- 17.Antropova N, Abe H, Giger ML. Use of clinical MRI maximum intensity projections for improved breast lesion classification with deep convolutional neural networks. J Med Imaging (Bellingham). 2018;5(1):014503. [DOI] [PMC free article] [PubMed] [Google Scholar]
- 18.Antropova N, Huynh BQ, Giger ML. A deep feature fusion methodology for breast cancer diagnosis demonstrated on three imaging modality datasets. Med Phys. 2017;44(10):5162–71. [DOI] [PMC free article] [PubMed] [Google Scholar]
- 19.Mani S, Chen Y, Li X, et al. Machine learning for predicting the response of breast cancer to neoadjuvant chemotherapy. J Am Med Inform Assoc. 2013;20(4):688–95. [DOI] [PMC free article] [PubMed] [Google Scholar]
- 20.Mani S, Chen Y, Arlinghaus LR, et al. Early prediction of the response of breast tumors to neoadjuvant chemotherapy using quantitative MRI and machine learning. AMIA Annu Symp Proc. 2011;2011:868–77. [PMC free article] [PubMed] [Google Scholar]
- 21.Drukker K, Li H, Antropova N, et al. Most-enhancing tumor volume by MRI radiomics predicts recurrence-free survival “early on” in neoadjuvant treatment of breast cancer. Cancer Imaging. 2018;18(1):12. [DOI] [PMC free article] [PubMed] [Google Scholar]
- 22.Pinker K, Grabner G, Bogner W, et al. A combined high temporal and high spatial resolution 3 Tesla MR imaging protocol for the assessment of breast lesions: initial results. Invest Radiol. 2009;44(9):553–8. [DOI] [PubMed] [Google Scholar]
- 23.D’Orsi CJ SE, Mendelson EB, Morris EA. ACR BI-RADS® Atlas, Breast Imaging Reporting and Data System. Reston, VA: American College of Radiology; 2013. [Google Scholar]
- 24.Rosset A, Spadola L, Ratib O. OsiriX: An Open-Source Software for Navigating in Multidimensional DICOM Images. Journal of digital imaging. 2004;17(3):205–16. [DOI] [PMC free article] [PubMed] [Google Scholar]
- 25.Center MAC;Pages. Accessed at http://www3.mdanderson.org/app/medcalc/index.cfm?pagename=jsconvert3.
- 26.Symmans WF, Peintinger F, Hatzis C, et al. Measurement of residual breast cancer burden to predict survival after neoadjuvant chemotherapy. J Clin Oncol. 2007;25(28):4414–22. [DOI] [PubMed] [Google Scholar]
- 27.Senkus E, Kyriakides S, Ohno S, et al. Primary breast cancer: ESMO Clinical Practice Guidelines for diagnosis, treatment and follow-up. Ann Oncol. 2015;26 Suppl 5:v8–30. [DOI] [PubMed] [Google Scholar]
- 28.Ah-See ML, Makris A, Taylor NJ, et al. Early changes in functional dynamic magnetic resonance imaging predict for pathologic response to neoadjuvant chemotherapy in primary breast cancer. Clin Cancer Res. 2008;14(20):6580–9. [DOI] [PubMed] [Google Scholar]
- 29.Yu HJ, Chen JH, Mehta RS, et al. MRI measurements of tumor size and pharmacokinetic parameters as early predictors of response in breast cancer patients undergoing neoadjuvant anthracycline chemotherapy. J Magn Reson Imaging. 2007;26(3):615–23. [DOI] [PubMed] [Google Scholar]
- 30.Hylton NM, Blume JD, Bernreuter WK, et al. Locally advanced breast cancer: MR imaging for prediction of response to neoadjuvant chemotherapy--results from ACRIN 6657/I-SPY TRIAL. Radiology. 2012;263(3):663–72. [DOI] [PMC free article] [PubMed] [Google Scholar]
- 31.Aghaei F, Tan M, Hollingsworth AB, et al. Computer-aided breast MR image feature analysis for prediction of tumor response to chemotherapy. Med Phys. 2015;42(11):6520–8. [DOI] [PMC free article] [PubMed] [Google Scholar]
- 32.Braman NM, Etesami M, Prasanna P, et al. Intratumoral and peritumoral radiomics for the pretreatment prediction of pathological complete response to neoadjuvant chemotherapy based on breast DCE-MRI. Breast Cancer Res. 2017;19(1):57. [DOI] [PMC free article] [PubMed] [Google Scholar]
- 33.Fan M, Wu G, Cheng H, et al. Radiomic analysis of DCE-MRI for prediction of response to neoadjuvant chemotherapy in breast cancer patients. Eur J Radiol. 2017;94:140–7. [DOI] [PubMed] [Google Scholar]
- 34.Vanneschi L, Farinaccio A, Mauri G, et al. A comparison of machine learning techniques for survival prediction in breast cancer. BioData Min. 2011;4:12. [DOI] [PMC free article] [PubMed] [Google Scholar]
- 35.Kourou K, Exarchos TP, Exarchos KP, et al. Machine learning applications in cancer prognosis and prediction. Comput Struct Biotechnol J. 2015;13:8–17. [DOI] [PMC free article] [PubMed] [Google Scholar]
- 36.Montazeri M, Montazeri M, Montazeri M, Beigzadeh A. Machine learning models in breast cancer survival prediction. Technol Health Care. 2016;24(1):31–42. [DOI] [PubMed] [Google Scholar]
- 37.Mucaki EJ, Baranova K, Pham HQ, et al. Predicting Outcomes of Hormone and Chemotherapy in the Molecular Taxonomy of Breast Cancer International Consortium (METABRIC) Study by Biochemically-inspired Machine Learning. F1000Res. 2016;5:2124. [DOI] [PMC free article] [PubMed] [Google Scholar]
- 38.Jafri NF, Newitt DC, Kornak J, et al. Optimized breast MRI functional tumor volume as a biomarker of recurrence-free survival following neoadjuvant chemotherapy. J Magn Reson Imaging. 2014;40(2):476–82. [DOI] [PMC free article] [PubMed] [Google Scholar]
- 39.Gokmen-Polar Y, Badve S. Molecular profiling assays in breast cancer: are we ready for prime time? Oncology (Williston Park). 2012;26(4):350–7, 61. [PubMed] [Google Scholar]


